
Example 1. Quality Control Chart Software
The Total Quality Management TQM Diagrams Solution from the "Quality" area of ConceptDraw Solution Park contains a wide set of predesigned templates, samples and TQM Diagram library.

Example 2. Total Quality Management TQM Diagrams — Design Elements
The TQM Diagram library of Total Quality Management TQM Diagrams Solution includes a great number of ready-to-use predesigned vector objects that will help you design the professional looking quality control charts in minutes.

Example 3. ISO Flowcharting — Quality Control Chart
This example was redesigned from the file [en.wikimedia.org]
This sample was created in ConceptDraw DIAGRAM using the Total Quality Management TQM Diagrams Solution from the "Quality" Area of ConceptDraw Solution Park and shows the Quality Control Chart. An experienced user spent 10 minutes creating this sample.
Use Total Quality Management TQM Diagrams Solution for ConceptDraw DIAGRAM to create your own Quality Control Chart of any complexity quick, easy and effective.
The Quality Control Charts designed with ConceptDraw DIAGRAM are vector graphic documents and are available for reviewing, modifying, converting to a variety of formats (image, HTML, PDF file, MS PowerPoint Presentation, Adobe Flash or MS Visio), printing and send via e-mail in one moment.
TEN RELATED HOW TO's:
All about prototyping. GUI Prototyping with ConceptDraw. Download prototyping software.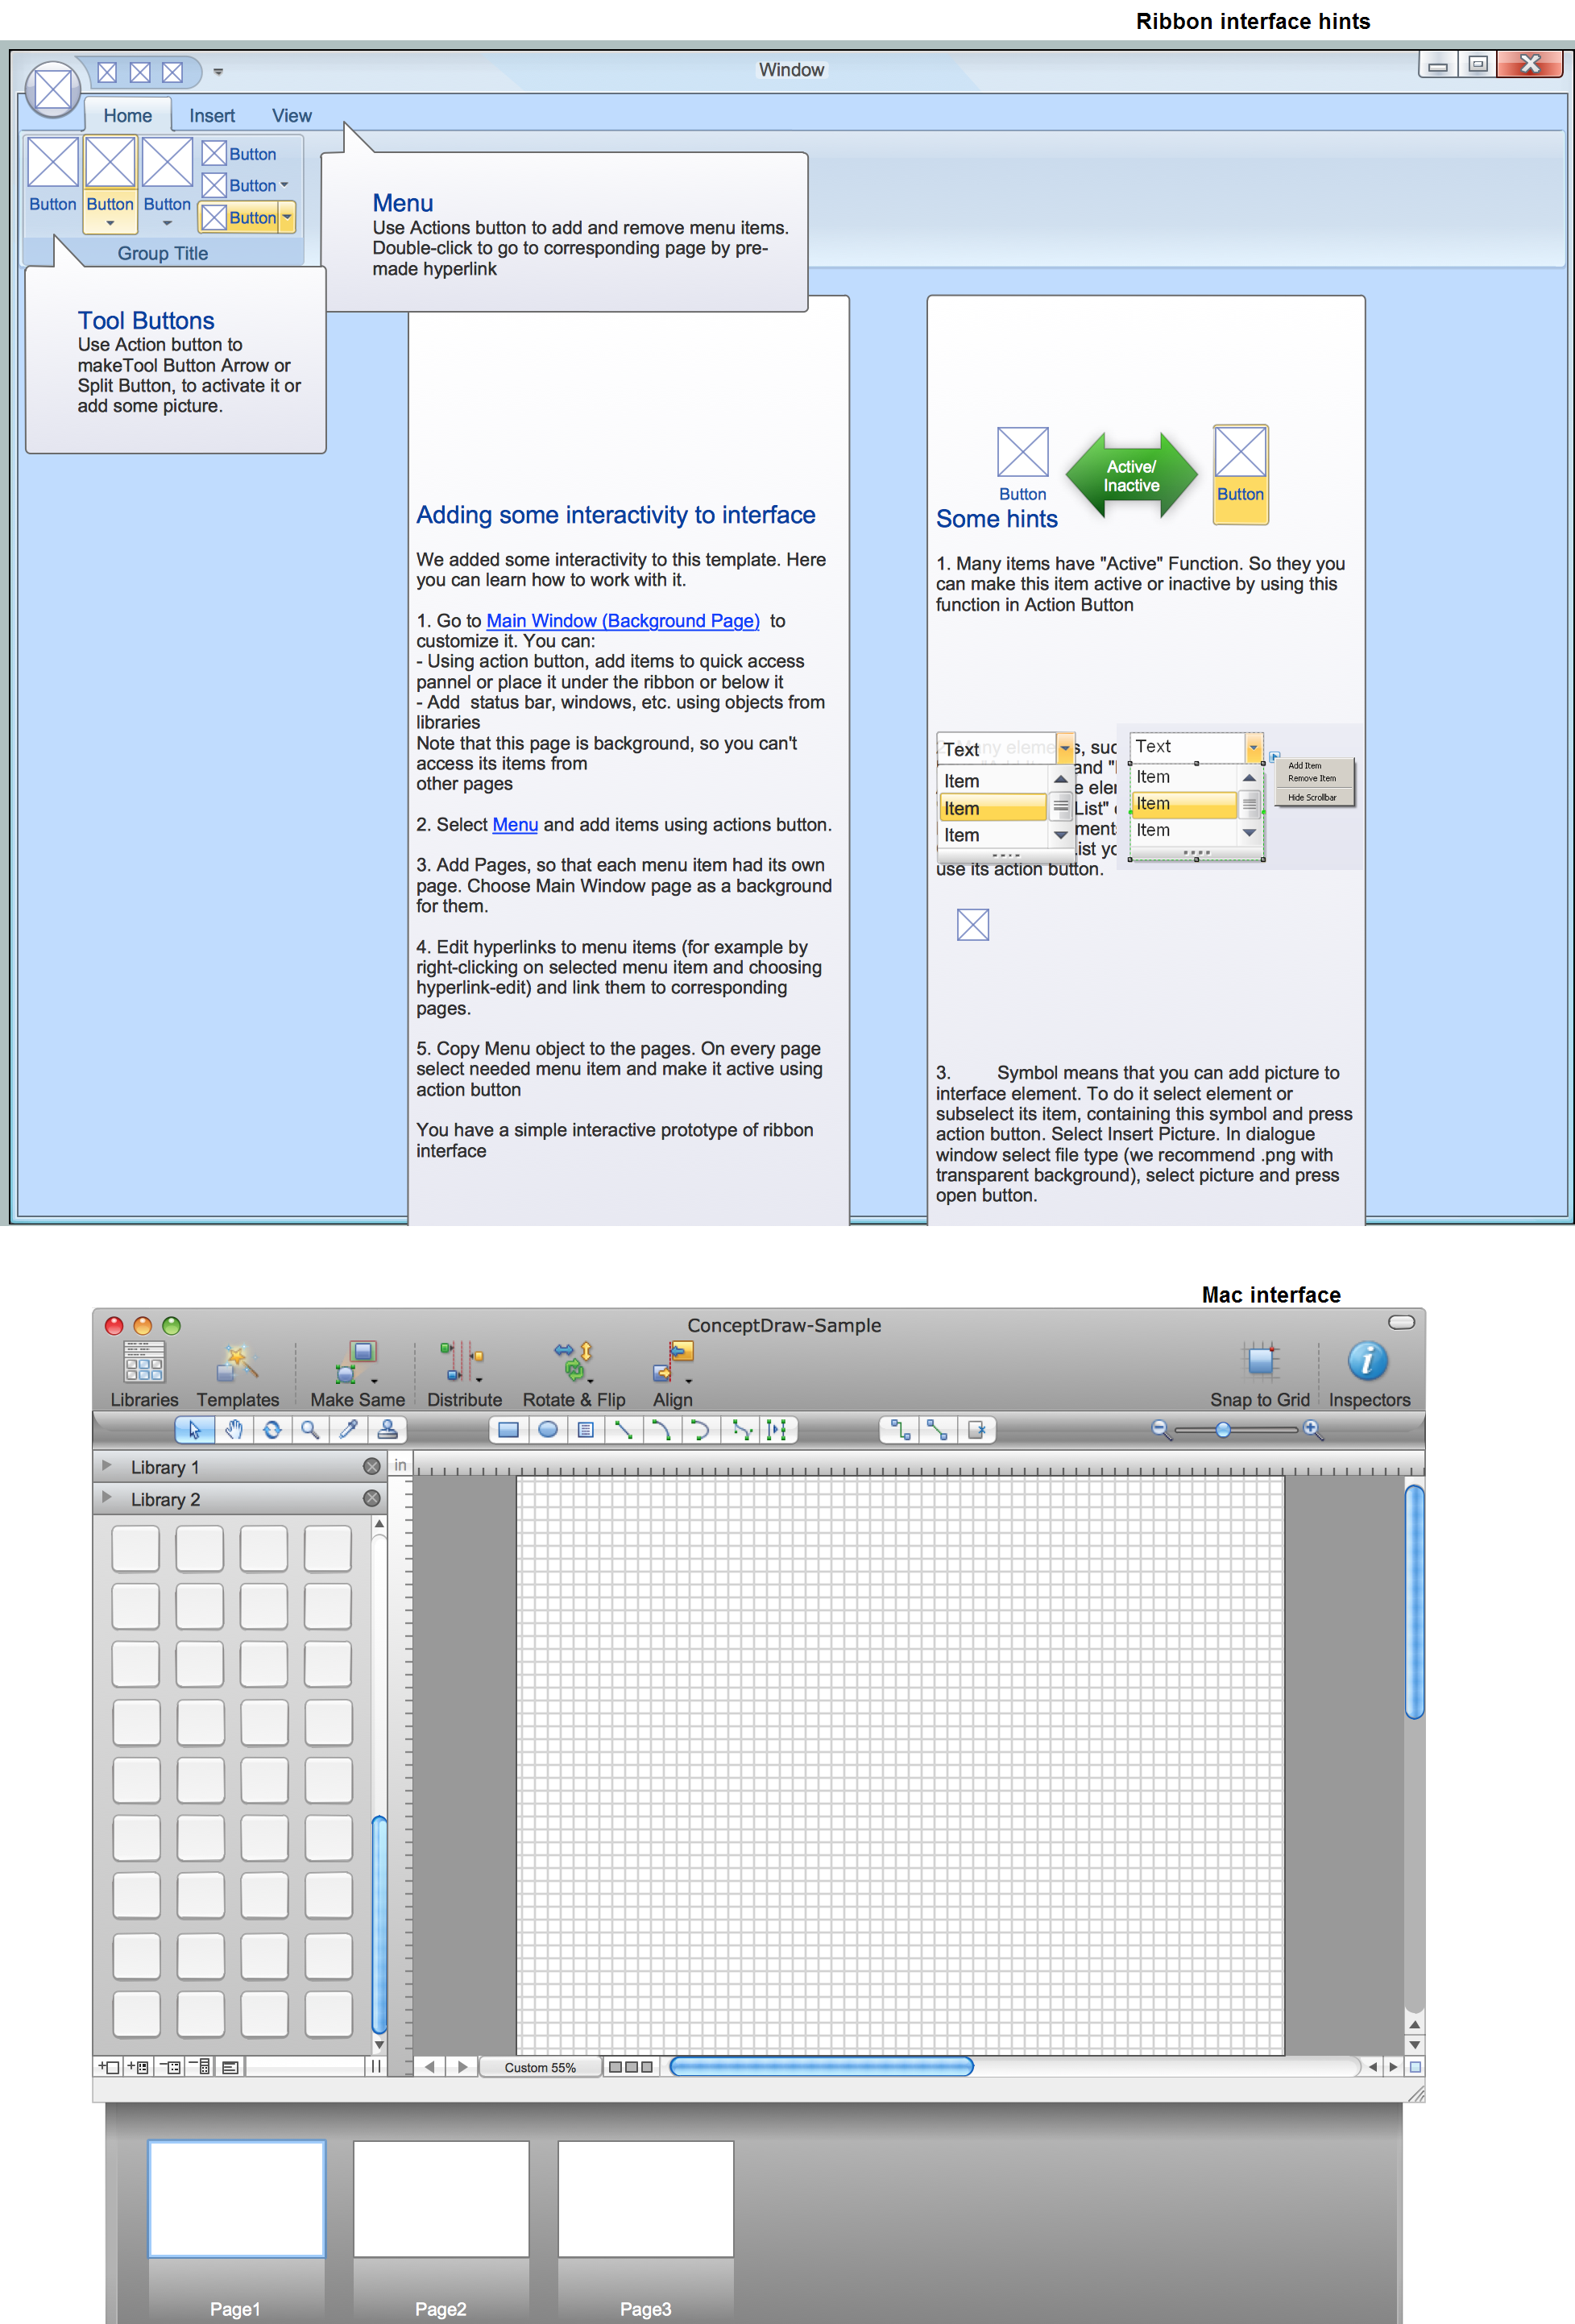
Picture: GUI Prototyping with ConceptDraw DIAGRAM
ConceptDraw DIAGRAM is a professional software for building of great-looking Flowcharts ✔️ of various types and any degree of complexity, ✔️ in a few simple steps, ✔️ even if you have no experience, ✔️ using RapidDraw technology, ✔️ to perform different tasks in different fields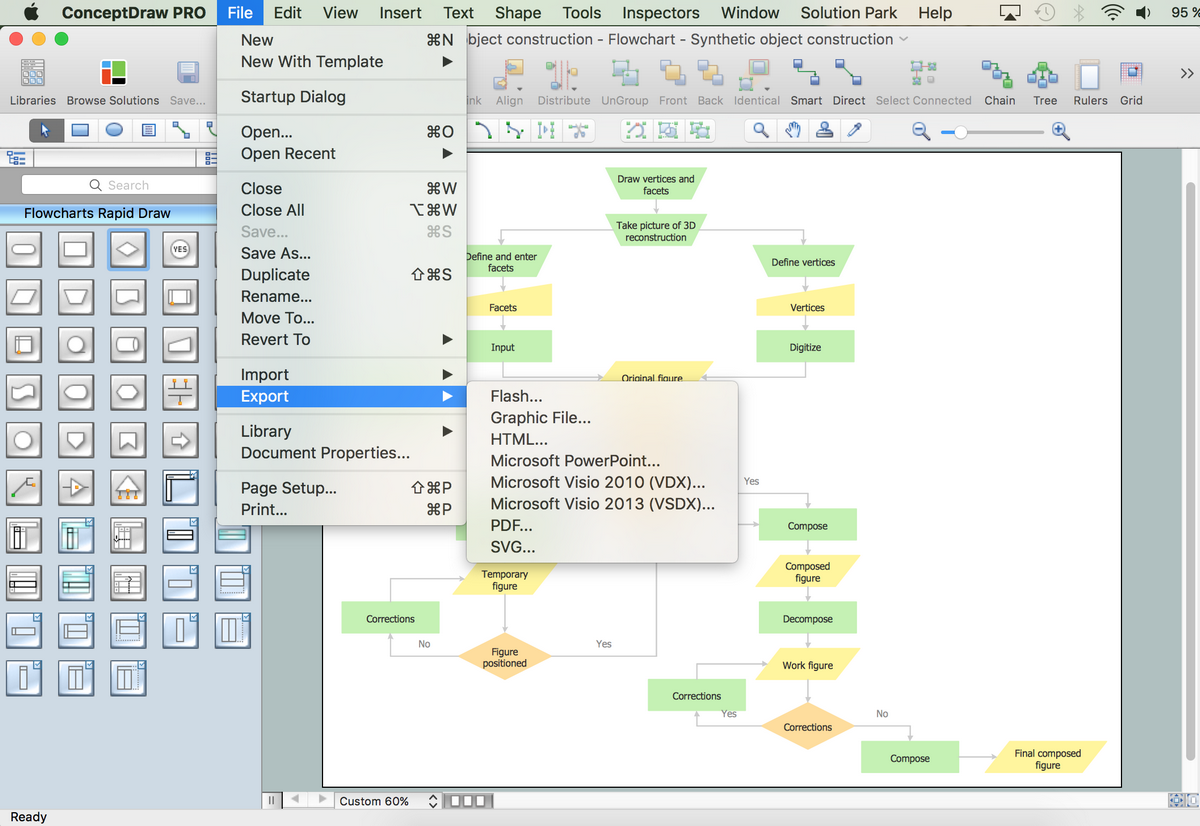
Picture: How to Build a Flowchart
Related Solution:
Create Quality Engineering Diagrams (value stream maps) - for value stream analysis and value stream management, material and information flow mapping, using our quick start templates included with ConceptDraw.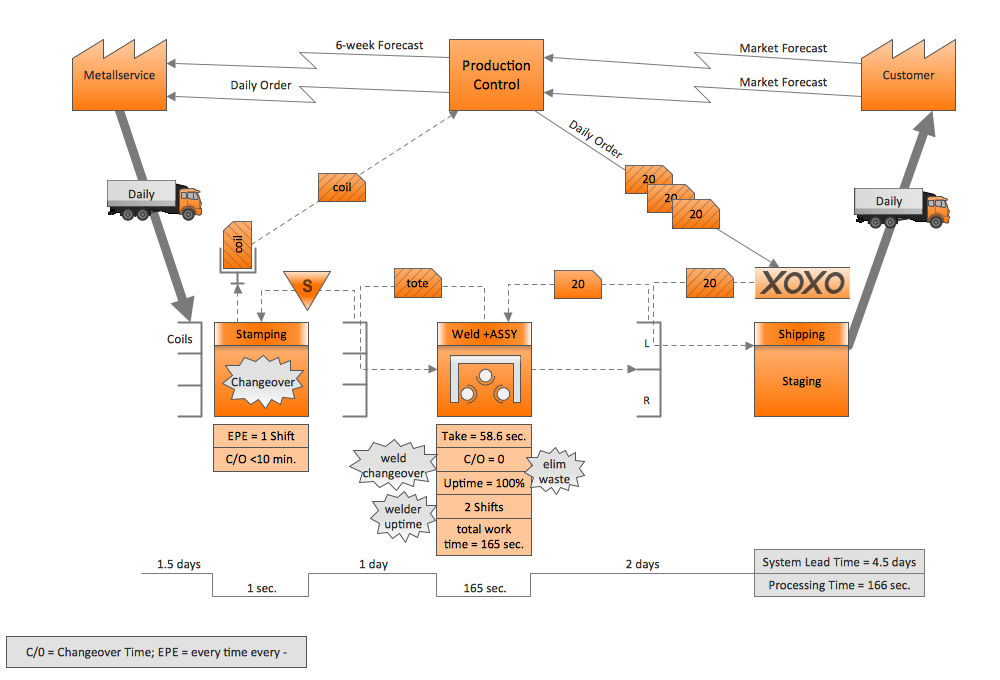
Picture: Quality Engineering Diagrams
Related Solution:
Constant improvement of key performance indicators that are related to quality is a step in the right direction for a company interested in market growth.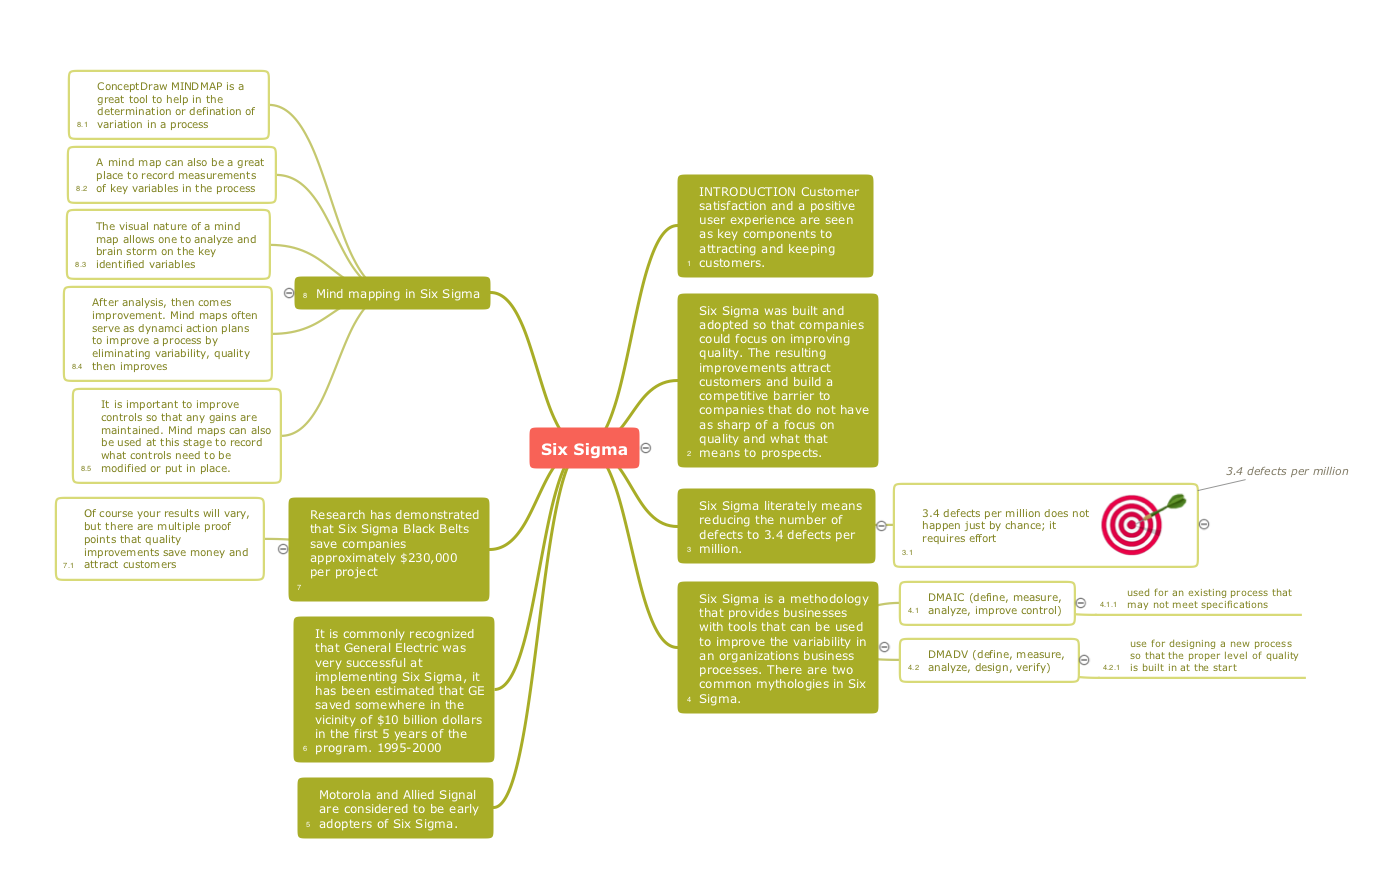
Picture: Quality Improvement
Related Solution:
Use Software Diagram Templates from the solutions of Software Development area for ConceptDraw DIAGRAM to create your own professional looking Software Diagrams in minutes.
The Software Diagrams designed with ConceptDraw DIAGRAM are vector graphic documents and are available for reviewing, modifying, converting to a variety of formats (image, HTML, PDF file, MS PowerPoint Presentation, Adobe Flash or MS Visio XML), printing and send via e-mail in one moment.
Picture: Software Diagram Templates
ConceptDraw DIAGRAM is perfect for software designers and software developers who need to draw Basic Network Diagrams._Win_Mac.png)
Picture: Network Diagramming Software for Design Basic Network Diagrams
Create your own flow charts of purchasing business processes using the ConceptDraw DIAGRAM software
Picture:
Purchasing Flowchart - Purchase Order
Flowchart Examples
Related Solution:
The UML Diagrams are widely used by software developers and software engineers. They can draw the UML Diagrams manually on the paper, but it is incredibly convenient to use the special UML diagramming software. The UML diagramming software allows you to draw the UML Diagrams in a few minutes.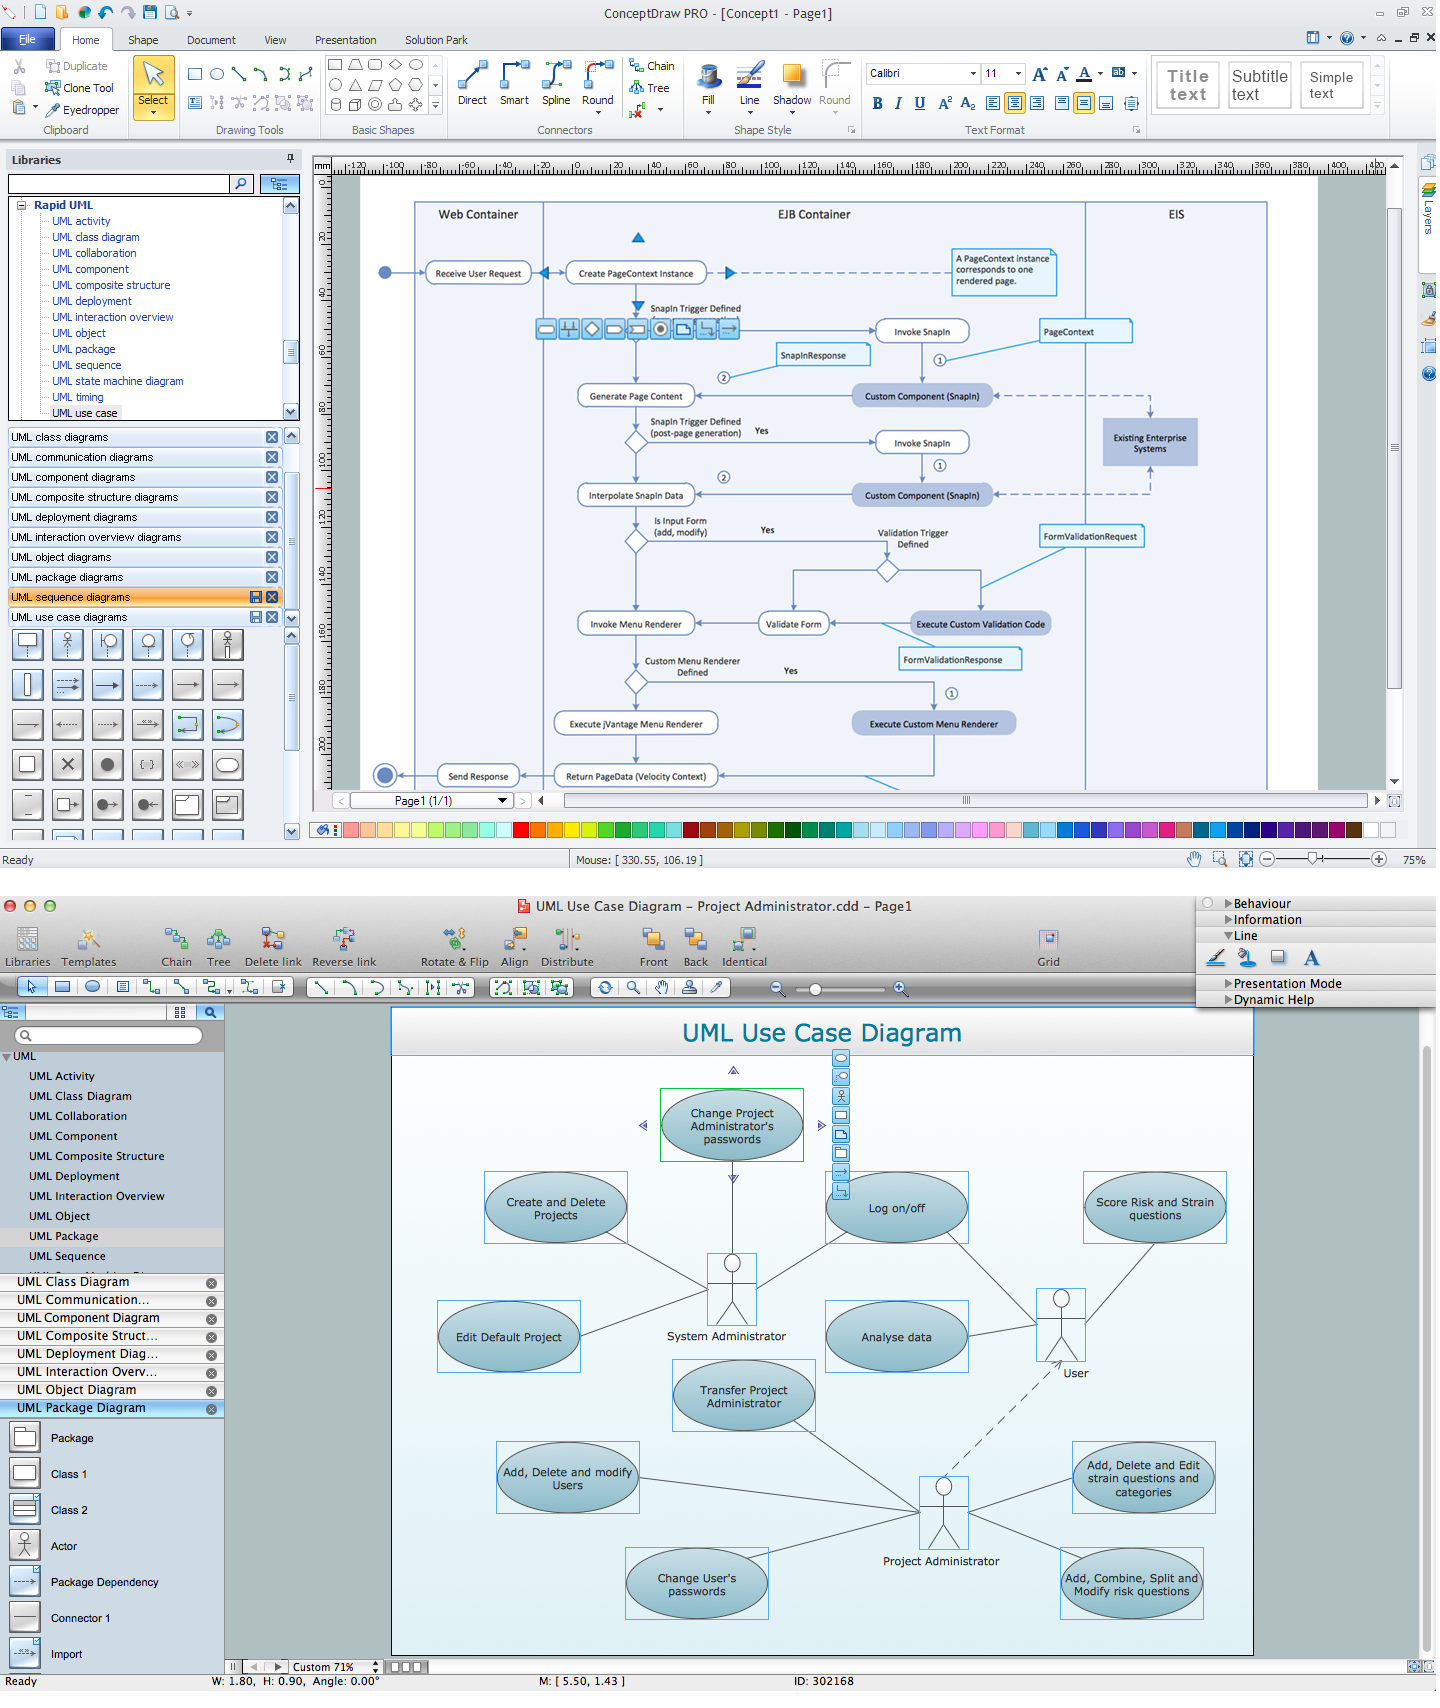
Picture: UML Diagramming Software
Related Solution:
The Total Quality Management Diagram solution helps your organization visualize business and industrial processes. Create Total Quality Management diagrams for business process with ConceptDraw software.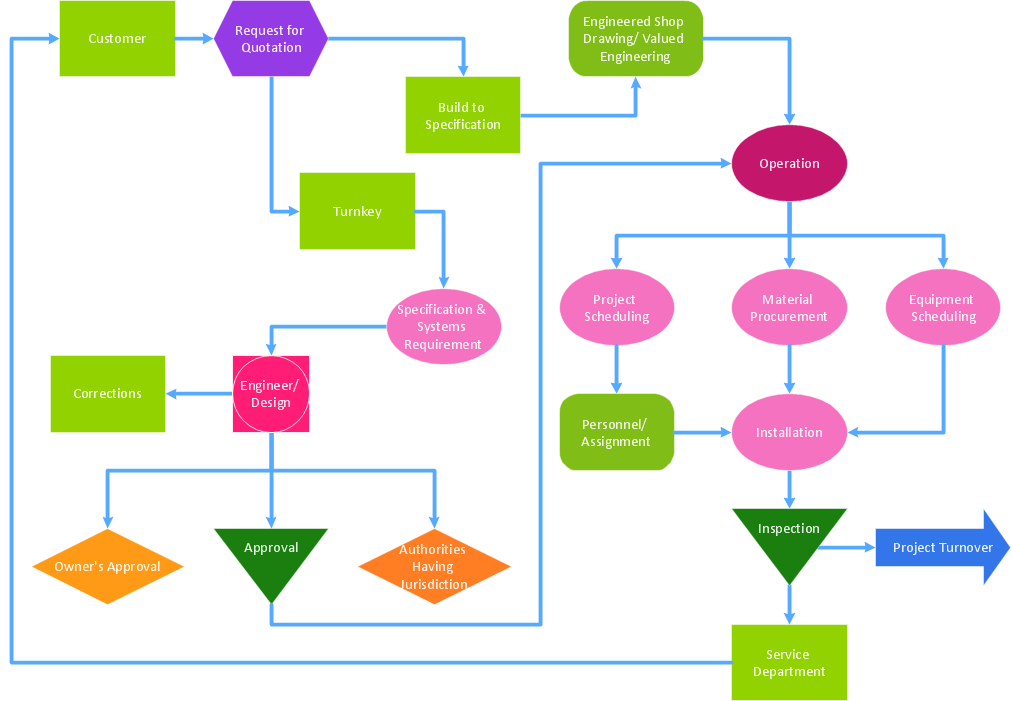
Picture: Best Value — Total Quality Management
Related Solution:
Any business process consists from a number of tasks carrying out the certain business goal. It is useful to diagram business processes to ensure that they are as foolproof, logical and sequential as possible. This business process diagram describes a typical booking process flow by the example of a cab booking process. It can be used as a roadmap for any booking system implementation. Diagramming a business process allows you to look at the entire project and take into account all types of possible scenarios. Business process diagram helps you investigate and clarify the process thoroughly so that you can find out how it can be improved. Business process diagram supports team communications by ensuring that each process element is clear and everyone in the team is on the same page.
Sometimes your company brings you less profit than you expect it to be, and it’s difficult to reveal the causes. Maybe it’s time to learn new technologies, because business diagram are easily developed by means of special software, so you won’t make any extra effort. In return, you will increase your productivity and get more done in a less time.
Picture: Business Diagram Software
Related Solutions:

