Seven Basic Tools of Quality - Pareto Chart
Pareto Chart is one of the seven basic tools of quality control, it is a type of diagram that combines the elements of bar chart and line graph. The individual values are represented in descending order by bars, and the cumulative total is represented by the line. The left vertical axis is the frequency of occurrence, cost or another important unit of measure. The right vertical axis is the cumulative percentage of the total number of occurrences, total cost, or total of other unit of measure.
The purpose of Pareto analysis and the Pareto chart is to detach the most important among a set of factors. In quality control, it often represents the most common sources of defects, the top set of causes which needed to be resolved. Then to identify the root causes of the problems, can be applied such tools as fishbone analysis and Fishbone diagram.
Pareto analysis is also effectively used in risk management for detecting the risks that have the most impact on the project.
Pareto Chart design is now easier than ever thanks to the ConceptDraw DIAGRAM software and powerful drawing tools, 9 libraries with numerous vector objects, collection of professionally designed and well thought-out samples offered by Seven Basic Tools of Quality solution from the Quality area of ConceptDraw Solution Park.
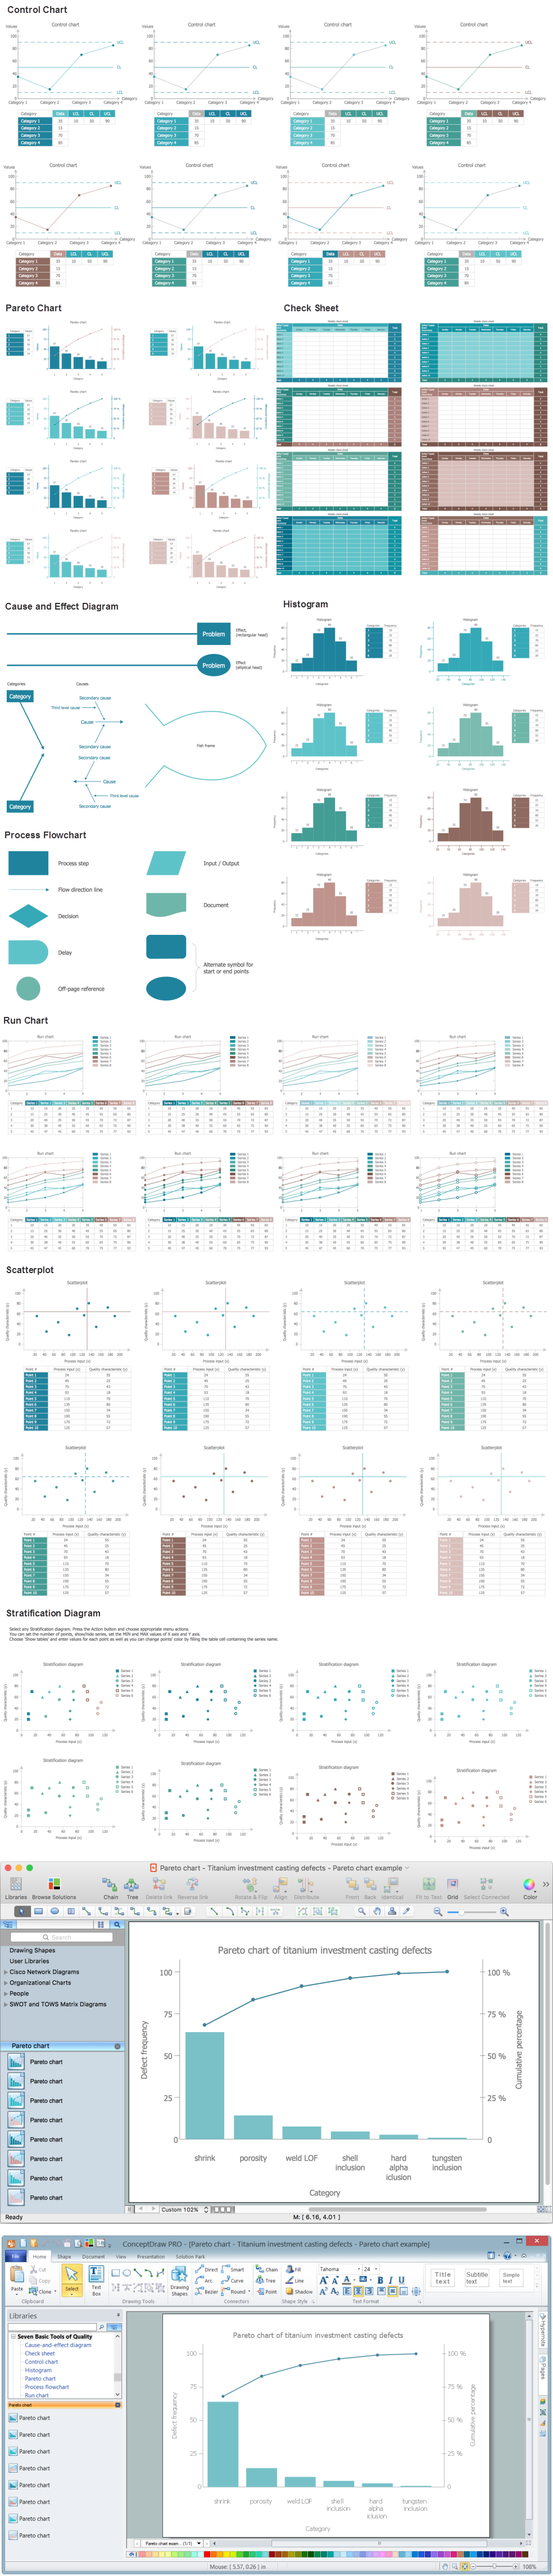
Example 1. Seven Basic Tools of Quality - Pareto Chart. Design Elements — Titanium Investment Casting Defects for Apple OS X and Windows
The sample you see on this page was created in ConceptDraw DIAGRAM software using the tools of the Seven Basic Tools of Quality Solution for ConceptDraw Solution Park. This sample shows the Titanium Investment Casting Defects. An experienced user spent 15 minutes creating it in ConceptDraw DIAGRAM
Use the Seven Basic Tools of Quality Solution for ConceptDraw DIAGRAM software to create your own professional looking Pareto Chart and other quality-related diagrams of any complexity quick, easy and effective.
All source documents are vector graphic documents. They are available for reviewing, modifying, or converting to a variety of formats (PDF file, MS PowerPoint, MS Visio, and many other graphic formats) from the ConceptDraw STORE. The Seven Basic Tools of Quality Solution is available for all ConceptDraw DIAGRAM


