
Example 1. Create Fishbone Diagrams with the ConceptDraw
If you dream to design the Fishbone Diagrams quick and easy, and need a powerful software to do this, the ConceptDraw DIAGRAM is the best choice for you. Fishbone Diagrams Solution extends ConceptDraw DIAGRAM with large collection of ready Fishbone Diagram templates for quick start. All they are available from ConceptDraw STORE, you can choose any that meets your requirements and design your chart on its base.

Example 2. Fishbone Diagrams Solution in ConceptDraw STORE
Another convenient way to create Fishbone Diagrams with the ConceptDraw is to design it from the beginning at new ConceptDraw document using the predesigned objects from the Fishbone Diagrams library. Simply drag desired vector objects and arrange them, add the text, make some stylish changes, and your professional-looking Cause and Effect Diagram or Fishbone Diagram will be ready.

Example 3. Template - Fishbone 8 Ps
The sample and template you see on this page were created in ConceptDraw DIAGRAM using the Fishbone Diagrams Solution. An experienced user spent 10 minutes creating each of them.
Use the tools of Fishbone Diagrams Solution to create Fishbone Diagrams with the ConceptDraw quick, easy and effective.
All source documents are vector graphic documents. They are available for reviewing, modifying, or converting to a variety of formats (PDF file, MS PowerPoint, MS Visio, and many other graphic formats) from the ConceptDraw STORE. The Fishbone Diagrams Solution is available for all ConceptDraw DIAGRAM or later users.
TEN RELATED HOW TO's:
ConceptDraw Network Drawing Software - Network design software for network drawings with abundant examples and templates.
Create computer network designs, diagrams and schematics using ConceptDraw.
Picture: Network Drawing Software
If you want to find a way to understand complex things in minutes, you should try to visualize data. One of the most useful tool for this is creating a flowchart, which is a diagram representing stages of some process in sequential order. There are so many possible uses of flowcharts and you can find tons of flow charts examples and predesigned templates on the Internet. Warehouse flowchart is often used for describing workflow and business process mapping. Using your imagination, you can simplify your job or daily routine with flowcharts.
Warehouse flowcharts are used to document product and information flow between sources of supply and consumers. The flowchart provides the staged guidance on how to manage each aspect of warehousing and describes such aspects as receiving of supplies; control of quality; shipment and storage and corresponding document flow. Warehouse flowchart, being actual is a good source of information. It indicates the stepwise way to complete the warehouse and inventory management process flow. Also it can be very useful for an inventory and audit procedures.
Picture: Flow Chart Example: Warehouse Flowchart
Related Solution:
Venn Diagrams visualize all possible logical relations between several sets and are widely used in mathematics, logic, statistics, marketing, sociology, etc.
This Venn Diagram shows the relative complement of the set A with respect to the set B. It is the set of the elements in B, but not in A. In other words it is the set-theoretic difference B-A.
Picture:
Basic Circles Venn Diagram
Venn Diagram Example
Related Solution:
Now the problem of complexity the Cause and Effect Fishbone Diagram creating is solved thanks to the ConceptDraw DIAGRAM diagramming and vector drawing software extended with Fishbone Diagrams solution from the Management area.
Picture: Cause and Effect Fishbone Diagram
Related Solution:
Common uses of the Fishbone (Ishikawa) diagrams are product design and quality defect prevention. They are effectively used to identify potential factors causing an overall effect for making possibility to solve a problem.
To create Fishbone Diagrams, Cause-and-Effect Diagrams, Ishikawa Diagrams, we recommend to use a ConceptDraw DIAGRAM software enhanced with Fishbone Diagrams solution from the Management area of ConceptDraw Solution Park.
Picture: Create Fishbone Diagrams
Related Solution:
ConceptDraw DIAGRAM is a powerful tool for drawing business communication ideas and concepts, simple visual presentation of numerical data in the Mac environment.
Picture: Best Multi-Platform Diagram Software
Related Solution:
Using ConceptDraw you will be able to create bubble diagrams from the ready ConceptDraw library objects or make your own objects. The created diagram can be saved and edited, objects can be moved and links between them will be automatically repainted after object moving because of using the ConceptDraw connectors.
Picture: Bubble diagrams with ConceptDraw DIAGRAM
Related Solution:
The Affinity Diagram shows the structure of large, complex factors that have an influence on a problem, and then divides them up into a smaller and simpler structure. The Affinity Diagram does not show a causal relationship between the factors. This diagram is designed to prepare the data for further analysis of the cause-effect relationships.
Picture: Affinity Diagram
Related Solution:
Get a creative look at a quality procedures with mindmaping software ConceptDraw MINDMAP. Mind maps can be of great value in depicting and describing a problem in detail, then structure it, and find the right decision.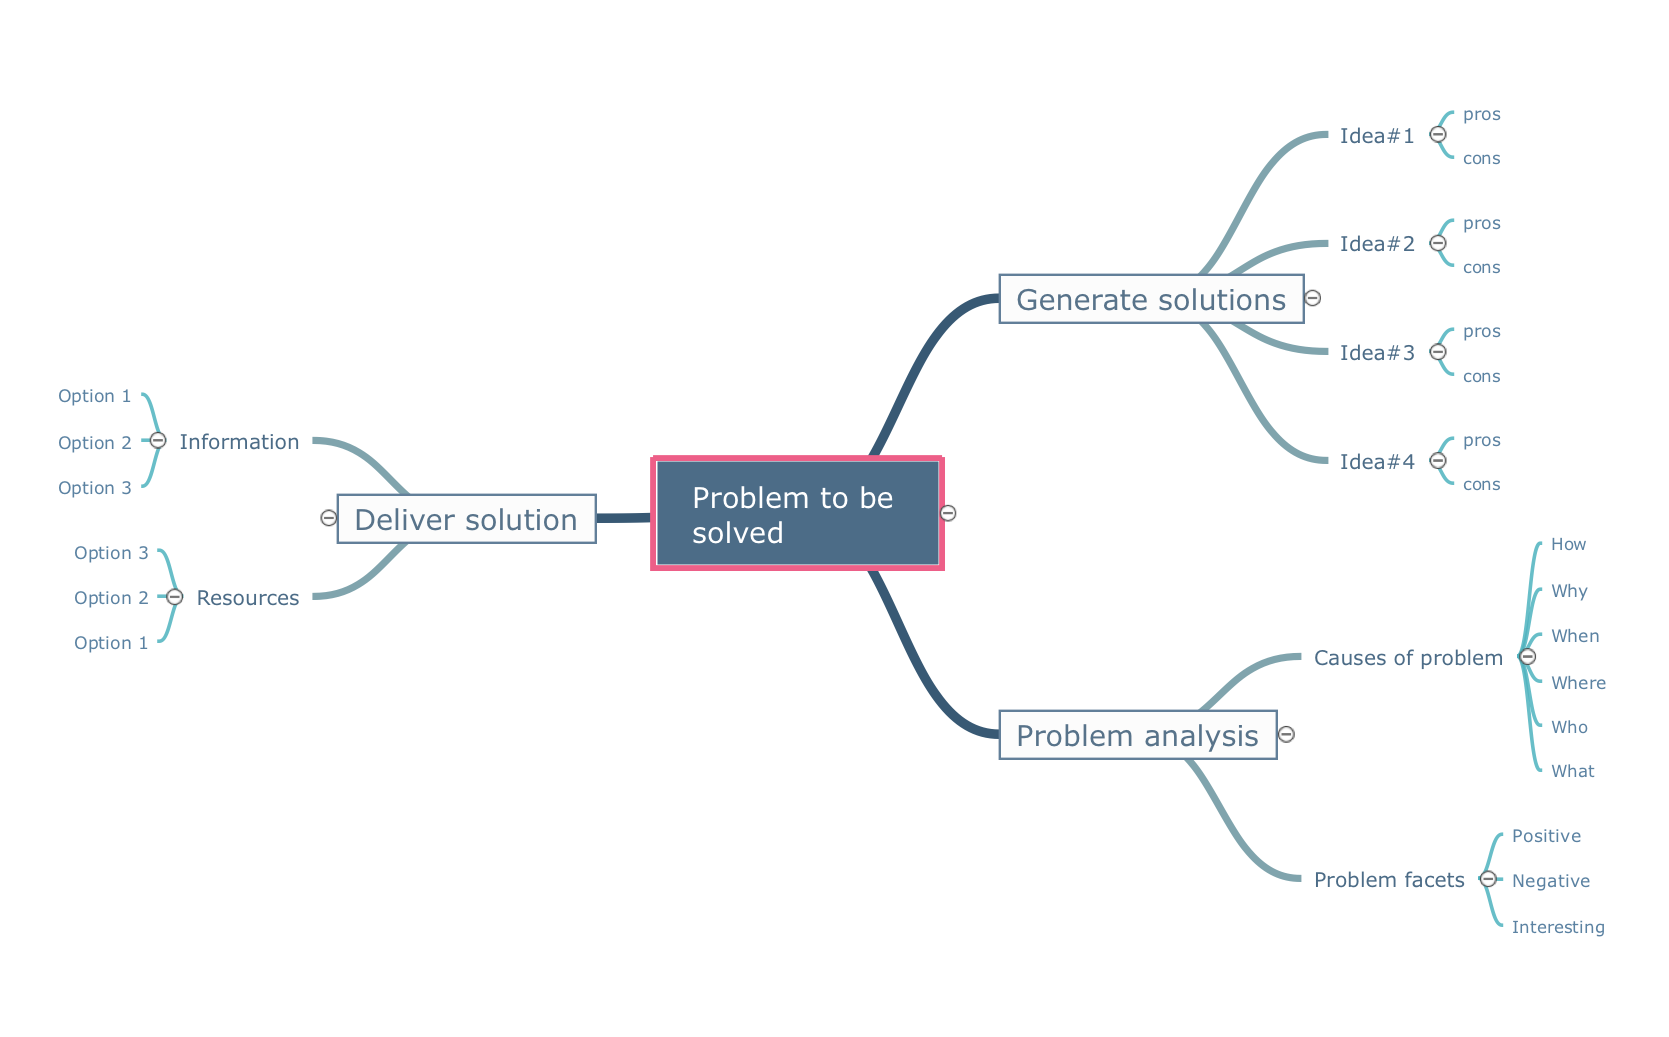
Picture: A Creative Look at Quality Procedures
Related Solution:
Basketball is a popular sport played by two teams of five players with a ball. The game takes place on a rectangular court. The team goal is to score a ball into the basket of the opponent team. The team with the most points wins the game.
ConceptDraw DIAGRAM diagramming and vector drawing software extended with Basketball solution from the Sport area of ConceptDraw Solution Park is a very useful tool for designing the basketball-related diagrams of any complexity.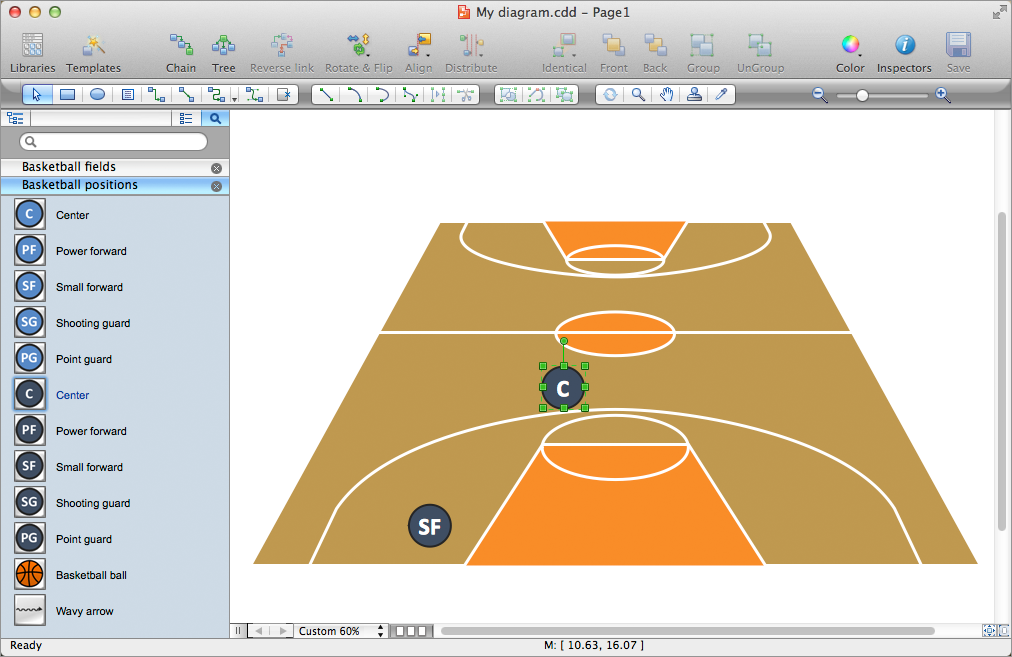
Picture: Basketball Plays Software
Related Solution:

