Affinity Diagram
Affinity DiagramThe Affinity Diagram shows the structure of large, complex factors that have an influence on a problem, and then divides them up into a smaller and simpler structure. The Affinity Diagram does not show a causal relationship between the factors. This diagram is designed to prepare the data for further analysis of the cause-effect relationships. It's also known as a KJ diagram. The History of Affinity DiagramsThe affinity diagram is a business tool for large idea and data organization. It's a part of the Seven Management and Planning Tools. The term affinity diagram was invented by Jiro Kawakita in the 1960s, so now it could be referred to as the KJ Method sometimes. Project Managers use this method right after brainstorming to sort large numbers of ideas into groups, based on their natural relationships. Another area of affinity diagrams usage is contextual inquiry as a way to sort notes and observations from field interviews, open-ended survey responses organizing, support call logs, etc. Other tools include:
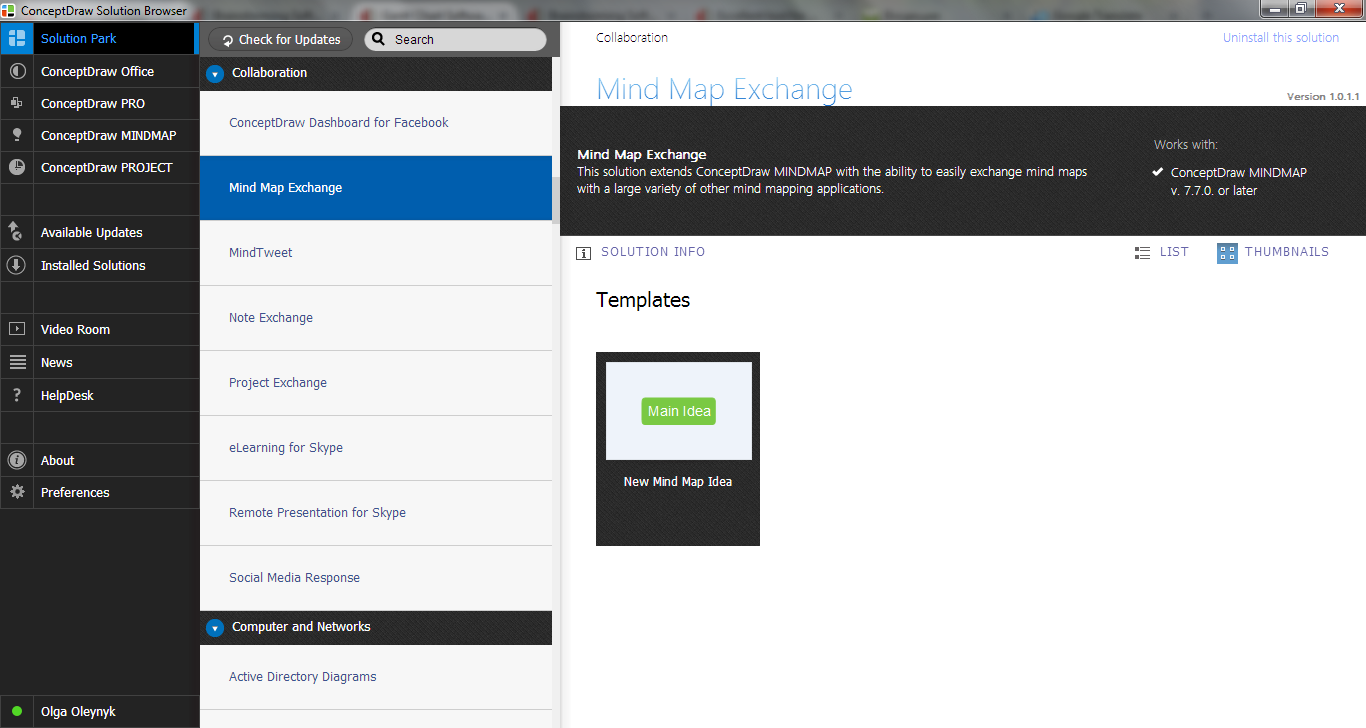
When to Use Affinity Diagrams?Once you finished a big brainstorming session with your team or on alone, next handy step will be - Affinity diagram. It is used within Project Managers to organize a large number of ideas and represent it to team members in a better way, so they may see the patterns in what's been discussed and identify possible solutions to problems they have. ConceptDraw STORE offers the Mind Map Exchange Solution from the Collaboration Area which allows to get instantly the access to the ConceptDraw MINDMAP for create Affinity Diagram. Example 1. Mind Map Exchange Solution in ConceptDraw STORE
Best Practices When Creating Affinity Diagrams
Collect and structure factors that impact on a problem. |

Example 2. Factors of Sales Problems
The Benefits for ConceptDraw MINDMAP Brainstorming Software
- ConceptDraw MINDMAP is effective for brainstorming, designing mind maps, idea generating, creative and lateral thinking, creativity and problem solving.
- ConceptDraw MINDMAP is ideal for team and personal work in Business, Marketing and Project Management.
- The libraries with large quantity of vector objects help to illustrate your mind maps and to make them bright, visual and comprehensible.
- Use of View Navigator tool lets create presentations from a mind map: you can simply select the map parts you want to present, sequence your slides, and preview the presentation.
- ConceptDraw MINDMAP provides wide capabilities of importing and exporting in various formats: Microsoft PowerPoint, Microsoft Word, MS Excel, Mindjet MindManager, image, HTML, PDF file.
TEN RELATED HOW TO's:
Process Flow Diagram →
A Process Flow Diagram (PFD) is a diagram which shows the relationships between the main components in a system. Process Flow Diagrams are widely used by engineers in chemical and process engineering, they allows to indicate the general flow of plant process streams and equipment, helps to design the petroleum refineries, petrochemical and chemical plants, natural gas processing plants, and many other industrial facilities. ConceptDraw DIAGRAM diagramming and vector drawing software extended with powerful tools of Flowcharts Solution from the "Diagrams" Area of ConceptDraw Solution Park is effective for drawing: Process Flow Diagram, Flow Process Diagram, Business Process Flow Diagrams.
Root Cause Tree Diagram →
Analyze the root causes of factors that influence the problem. A diagram is constructed separately for each high priority factor. Identify the root causes for a factor and then list possible corrective action. The diagram displays the structure of causes for a factor and possible corrective actions. The Root Cause Tree Diagram is used for further formulation of actions.
When To Use a Fishbone Diagram →
Fishbone diagrams work for most entrepreneurs and almost any industry or person having a problem. Professional diagramming software may help you create Fishbone (Cause and Effect or Ishikawa) diagrams. When people are unclear about what is causing an issue, ConceptDraw DIAGRAM will be your lifesaver. When to use a Fishbone diagram? Originally developed as a quality control tool, you may find a Fishbone diagram helpful when used in many cases, such as to analyze a complex problem when there are many causes, for identifying all possible root causes for an effect or a problem, when you need different point of view to look on a problem, to uncover bottlenecks and identify where and why a process doesn't work, for acceleration a process when traditional ways of problem solving consume many time.
Successful Quality Management →
Successful quality management implemented in a company of any size is a critical component of a company’s organization. You can use mind maps for a complete quality process analysis, giving more visibility to the focal points that you need to get clear.
Venn Diagram Examples for Problem Solving. Environmental Social Science. Human Sustainability Confluence →
The Venn diagram example below shows sustainable development at the confluence of three constituent parts. Create your Venn diagrams for problem solving in environmental social science using the ConceptDraw DIAGRAM diagramming and vector drawing software extended with the Business Diagrams solution from the Management area of ConceptDraw Solution Park.
Fishbone Diagram Template →
A causal model is an abstract concept, that describes the causal mechanisms of a system, by noting certain variables and their influence on each other, in an effort to discover the cause of a certain problem or flaw. This model is presented in diagram form by using a fishbone diagram. ConceptDraw DIAGRAM diagramming and vector drawing software enhanced with Fishbone Diagrams solution helps you create business productivity diagrams from Fishbone diagram templates and examples, that provide to start using of the graphic method for the analysis of problem causes. Each predesigned Fishbone Diagram template is ready to use and useful for instantly drawing your own Fishbone Diagram.
Quality Improvement →
Constant improvement of key performance indicators that are related to quality is a step in the right direction for a company interested in market growth.
How to Draw a Bubble Chart →
Video tutorials on ConceptDraw products. Try it today!