Business Process Modeling Software for Mac
What is the Business Process Modeling?
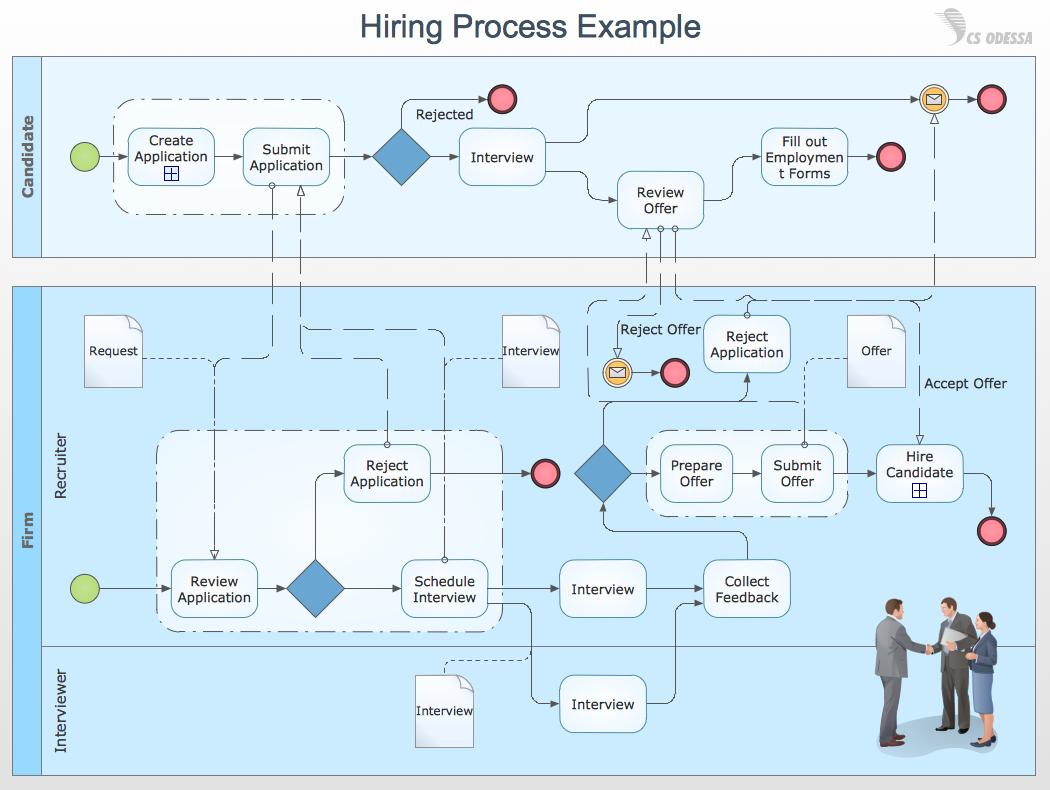
Business process modeling (BPM) in systems engineering is the activity of representing processes of an enterprise, so that the current process may be analyzed or improved. BPM is typically performed by business analysts, who provide expertise in the modeling discipline; by subject matter experts, who have specialized knowledge of the processes being modeled; or more commonly by a team comprising both. Alternatively, the process model can be derived directly from events' logs using process mining tools.

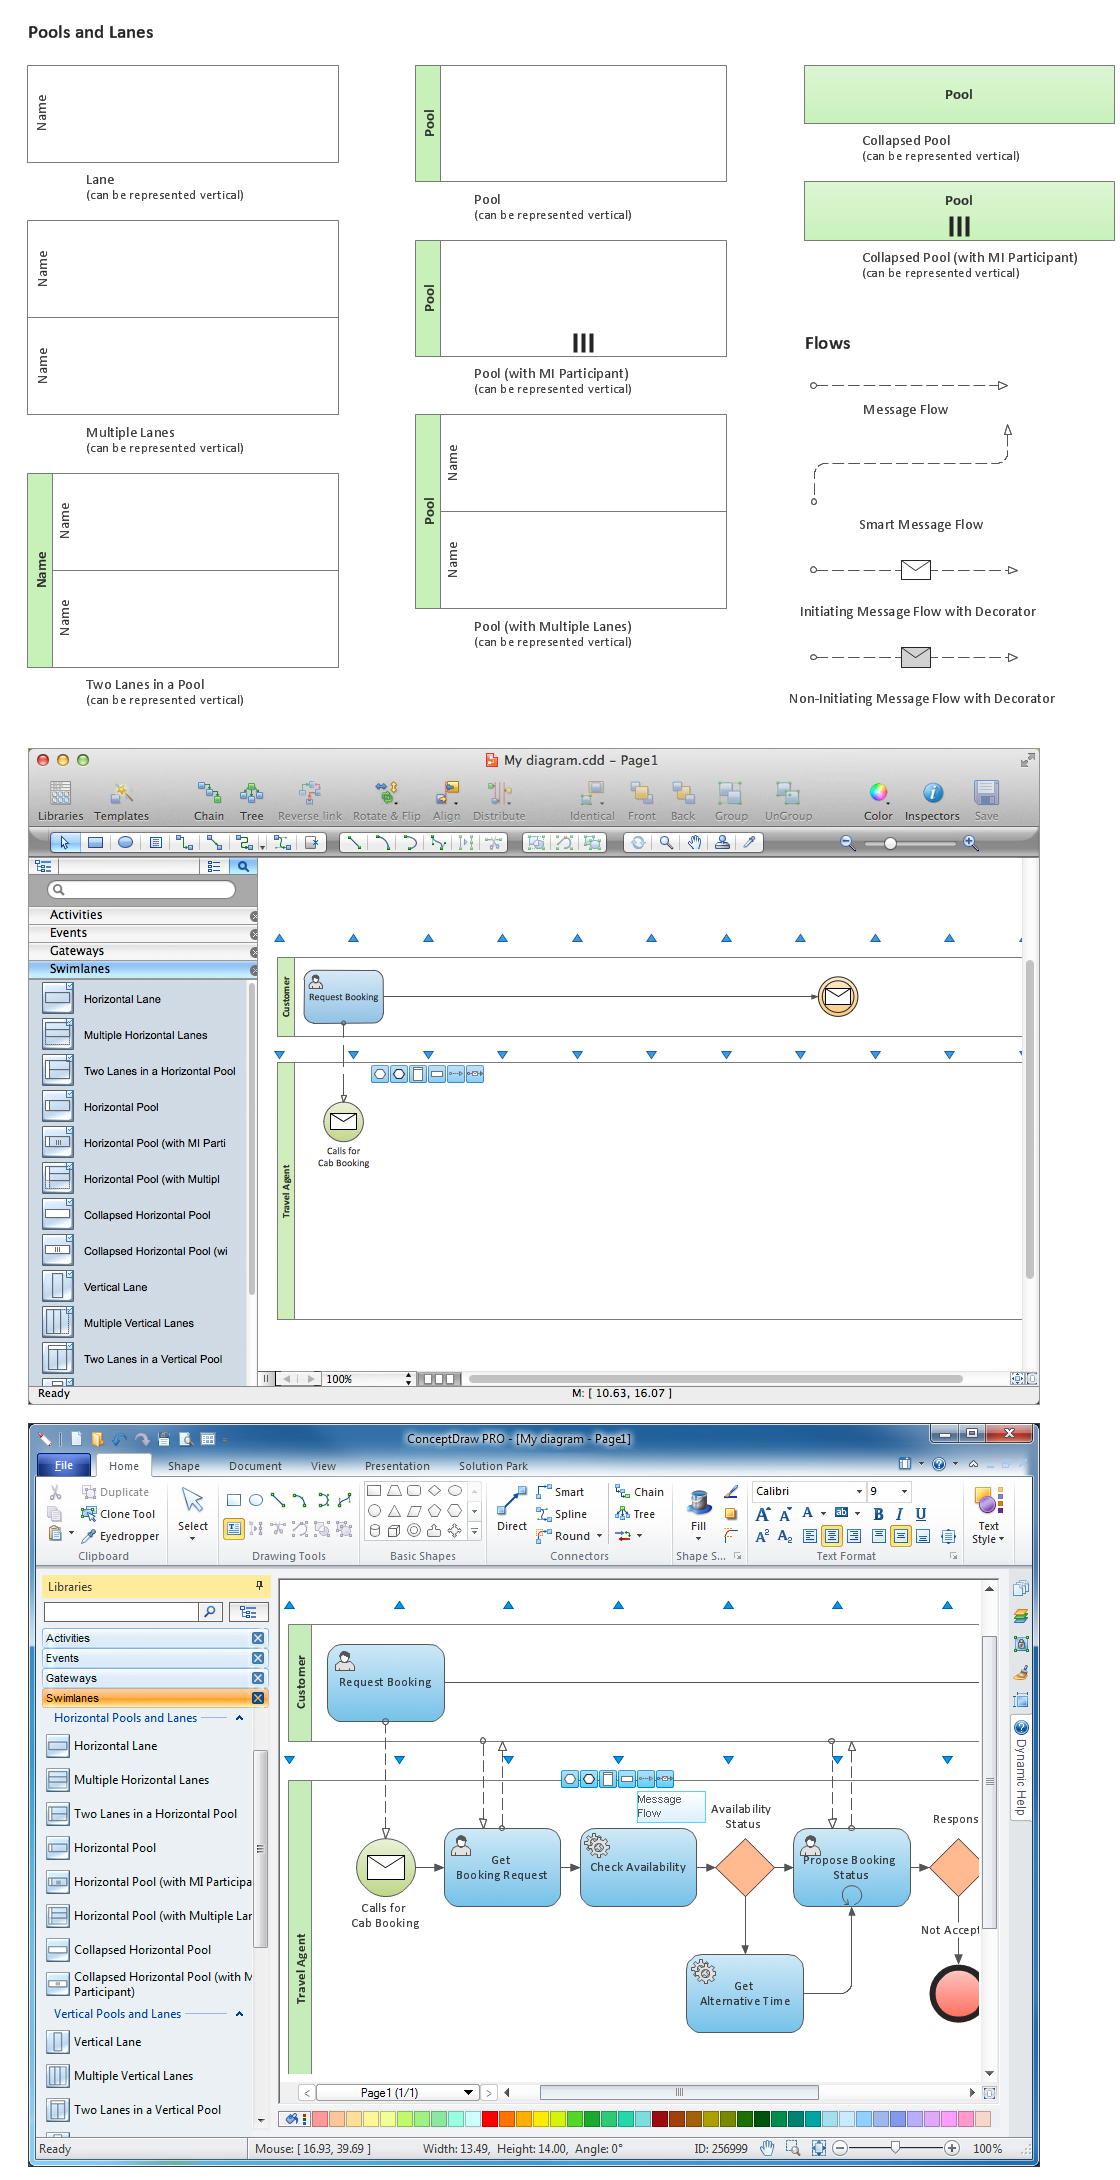
Pic.1. Business Process Modeling Diagrams
Business process modelling diagrams are known to be used in the software engineering and to get a chance to create one of those you might need a good (read: professional) software in order to get the final smart looking result already within a couple of hours maximum. One of such applications, which is known to be a great alternative of MS Visio for Mac, is ConceptDraw DIAGRAM software.
The mentioned business process modelling diagram software is very useful for creating any kinds of diagrams, including the BPM one, as it provides all of the necessary tools to make the final result look simply great and professional, offering the pre-made examples and templates of the existing diagrams as well as the stencils, which are all can become a part of your engineering drawings.
Thus, it’s well known that ConceptDraw DIAGRAM was developed especially for a purpose of providing the convenience for macOS operating system users, created especially for Mac fans to enjoy having it in order to have the necessary drawings finished the sooner the better. You might wonder what exactly it is so special of this particular application, but once you compare it to the other Visio alternatives, which also can be suitable for Mac, then it’ll become obvious that ConceptDraw DIAGRAM is the only one offering the pre-made solutions, available in another application, developed by the CS Odessa team — ConceptDraw STORE.
Having both ConceptDraw DIAGRAM drawing software and ConceptDraw STORE means having enough tools for creating the great looking as well as smart BPM diagrams, common for being used in the systems engineering in order to represent the needed processes of some particular enterprise, so that the current process may be analyzed or/and improved.
BPMN Tool
Business Process Model and Notation (BPMN) is a common standard for the modeling of business processes. Graphical notation provided by BPMN is applied when designing the Business Process Diagrams for analyzing and process improvement, uncovering and elimination problems, solving new challenges and goals in organizational development, reducing costs and increasing profits, and enhancement quality and performance.
The Business Process Diagram or Business Process Flowchart graphically represents the actions and steps in a process, depicts relations between major parts of the system, the sequence of executed steps using lines and arrows, and also connections between various systems.

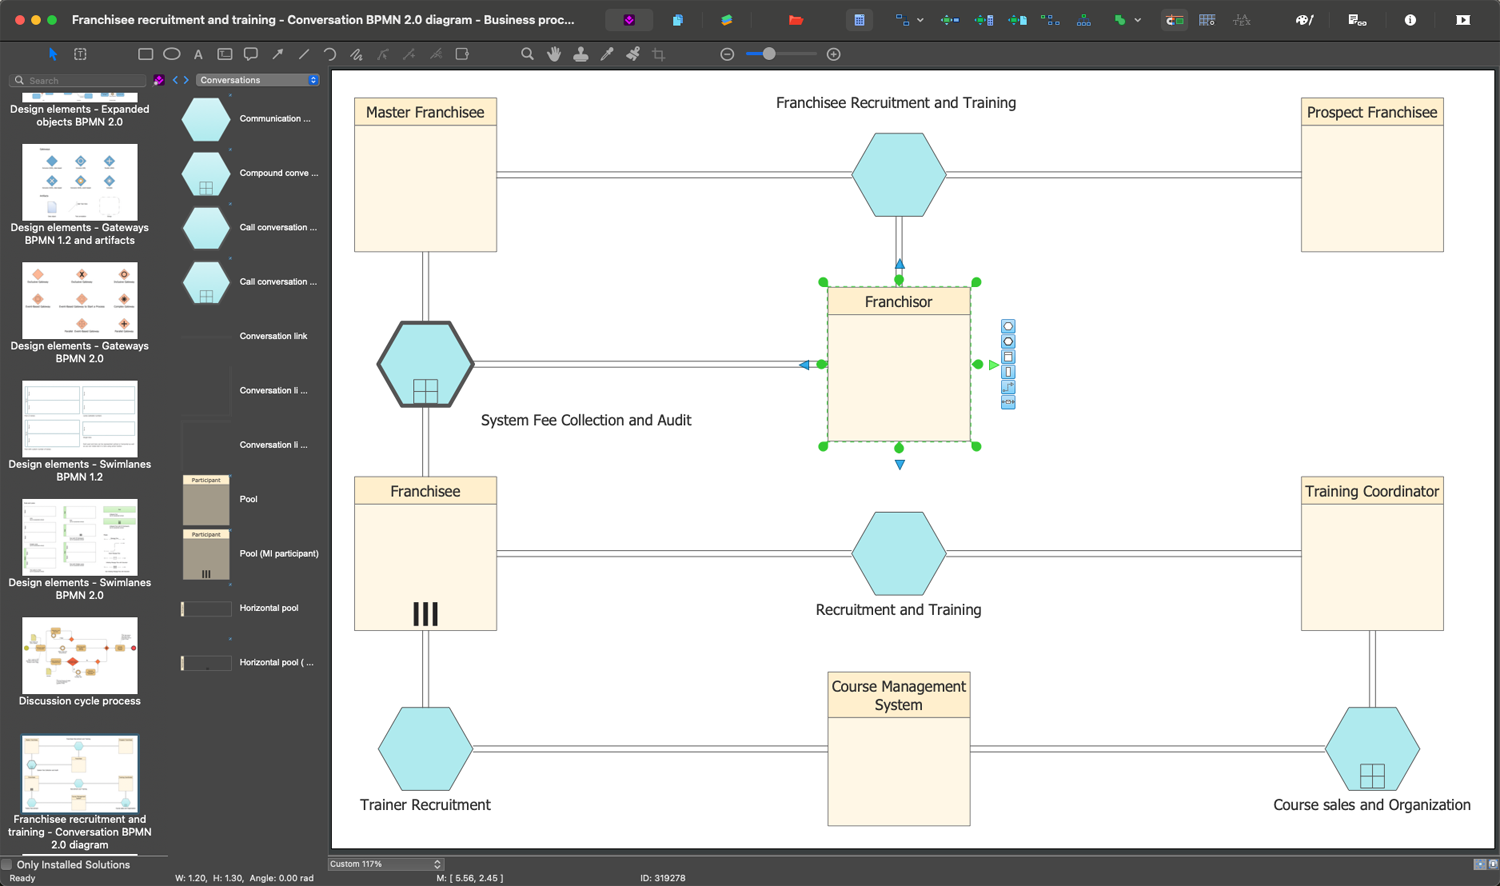
ConceptDraw DIAGRAM is a Mac OS compatible software for swiftly specifying the business processes based on BPMN 2.0. The Business Process Diagram solution contains pre-designed libraries and templates based on the BPMN 2.0 standard that allows to create of both simple and complex (nested) models of processes.

Pic.2. Business Process Modeling Solution
BPMN 2.0 diagram design elements and symbols
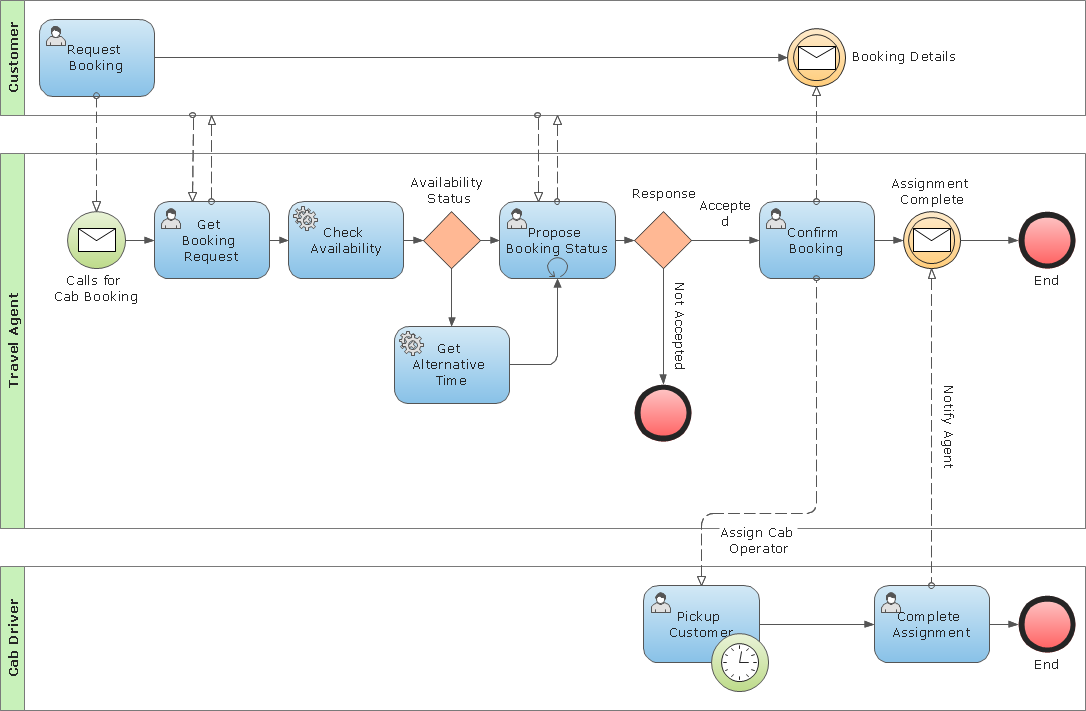
The aim of BPMN is assist in creating a diagram that is immediately understandable to all business stakeholders, with graphic elements that can be adapted to represent any form of function, decision, work or data flow. The symbols and structure it uses to do this can be divided into a number of categories:
- Flow objects — includes Events, which are parts of a process that happen automatically, denoted by a circle; Activities show work that needs to be done, shown as a round-cornered rectangle; Gateways show a splitting or merging of paths, using a diamond shape.
- Connecting objects — used to connect flow objects, either as Sequence Flow, which indicated the order of activities; Message Flow, a dashed line that shows interaction between organizational boundaries, shown on diagrams as 'Pools'; Association is a dotted line used to connect an 'Artifact' or text to an activity.
- Swim lanes — the widest possible overview of a process involving different organizations is known as a Pool. Different organizations each have their own Lane within the Pool, and are connected using Message Flow connecting objects.
- Artifacts — Artifacts are pieces of information added to certain Activity flow objects to giver better understanding to those viewing the process diagram. They can be data required or produces, extra activities, or simply explanatory text.
- Choreographies — These symbols allow the opportunity to show an activity or step that describes the behavior between business participants.
Business Process Modeling Examples and Templates
Business Process Management (BPM) enables organizations to tackle their most pressing and complex process automation and case management challenges from a single platform. Business and IT can easily collaborate and get work done, quickly and effectively.
Draw business process modeling diagrams in minutes. Start with browsing 15 examples, or 11 templates.
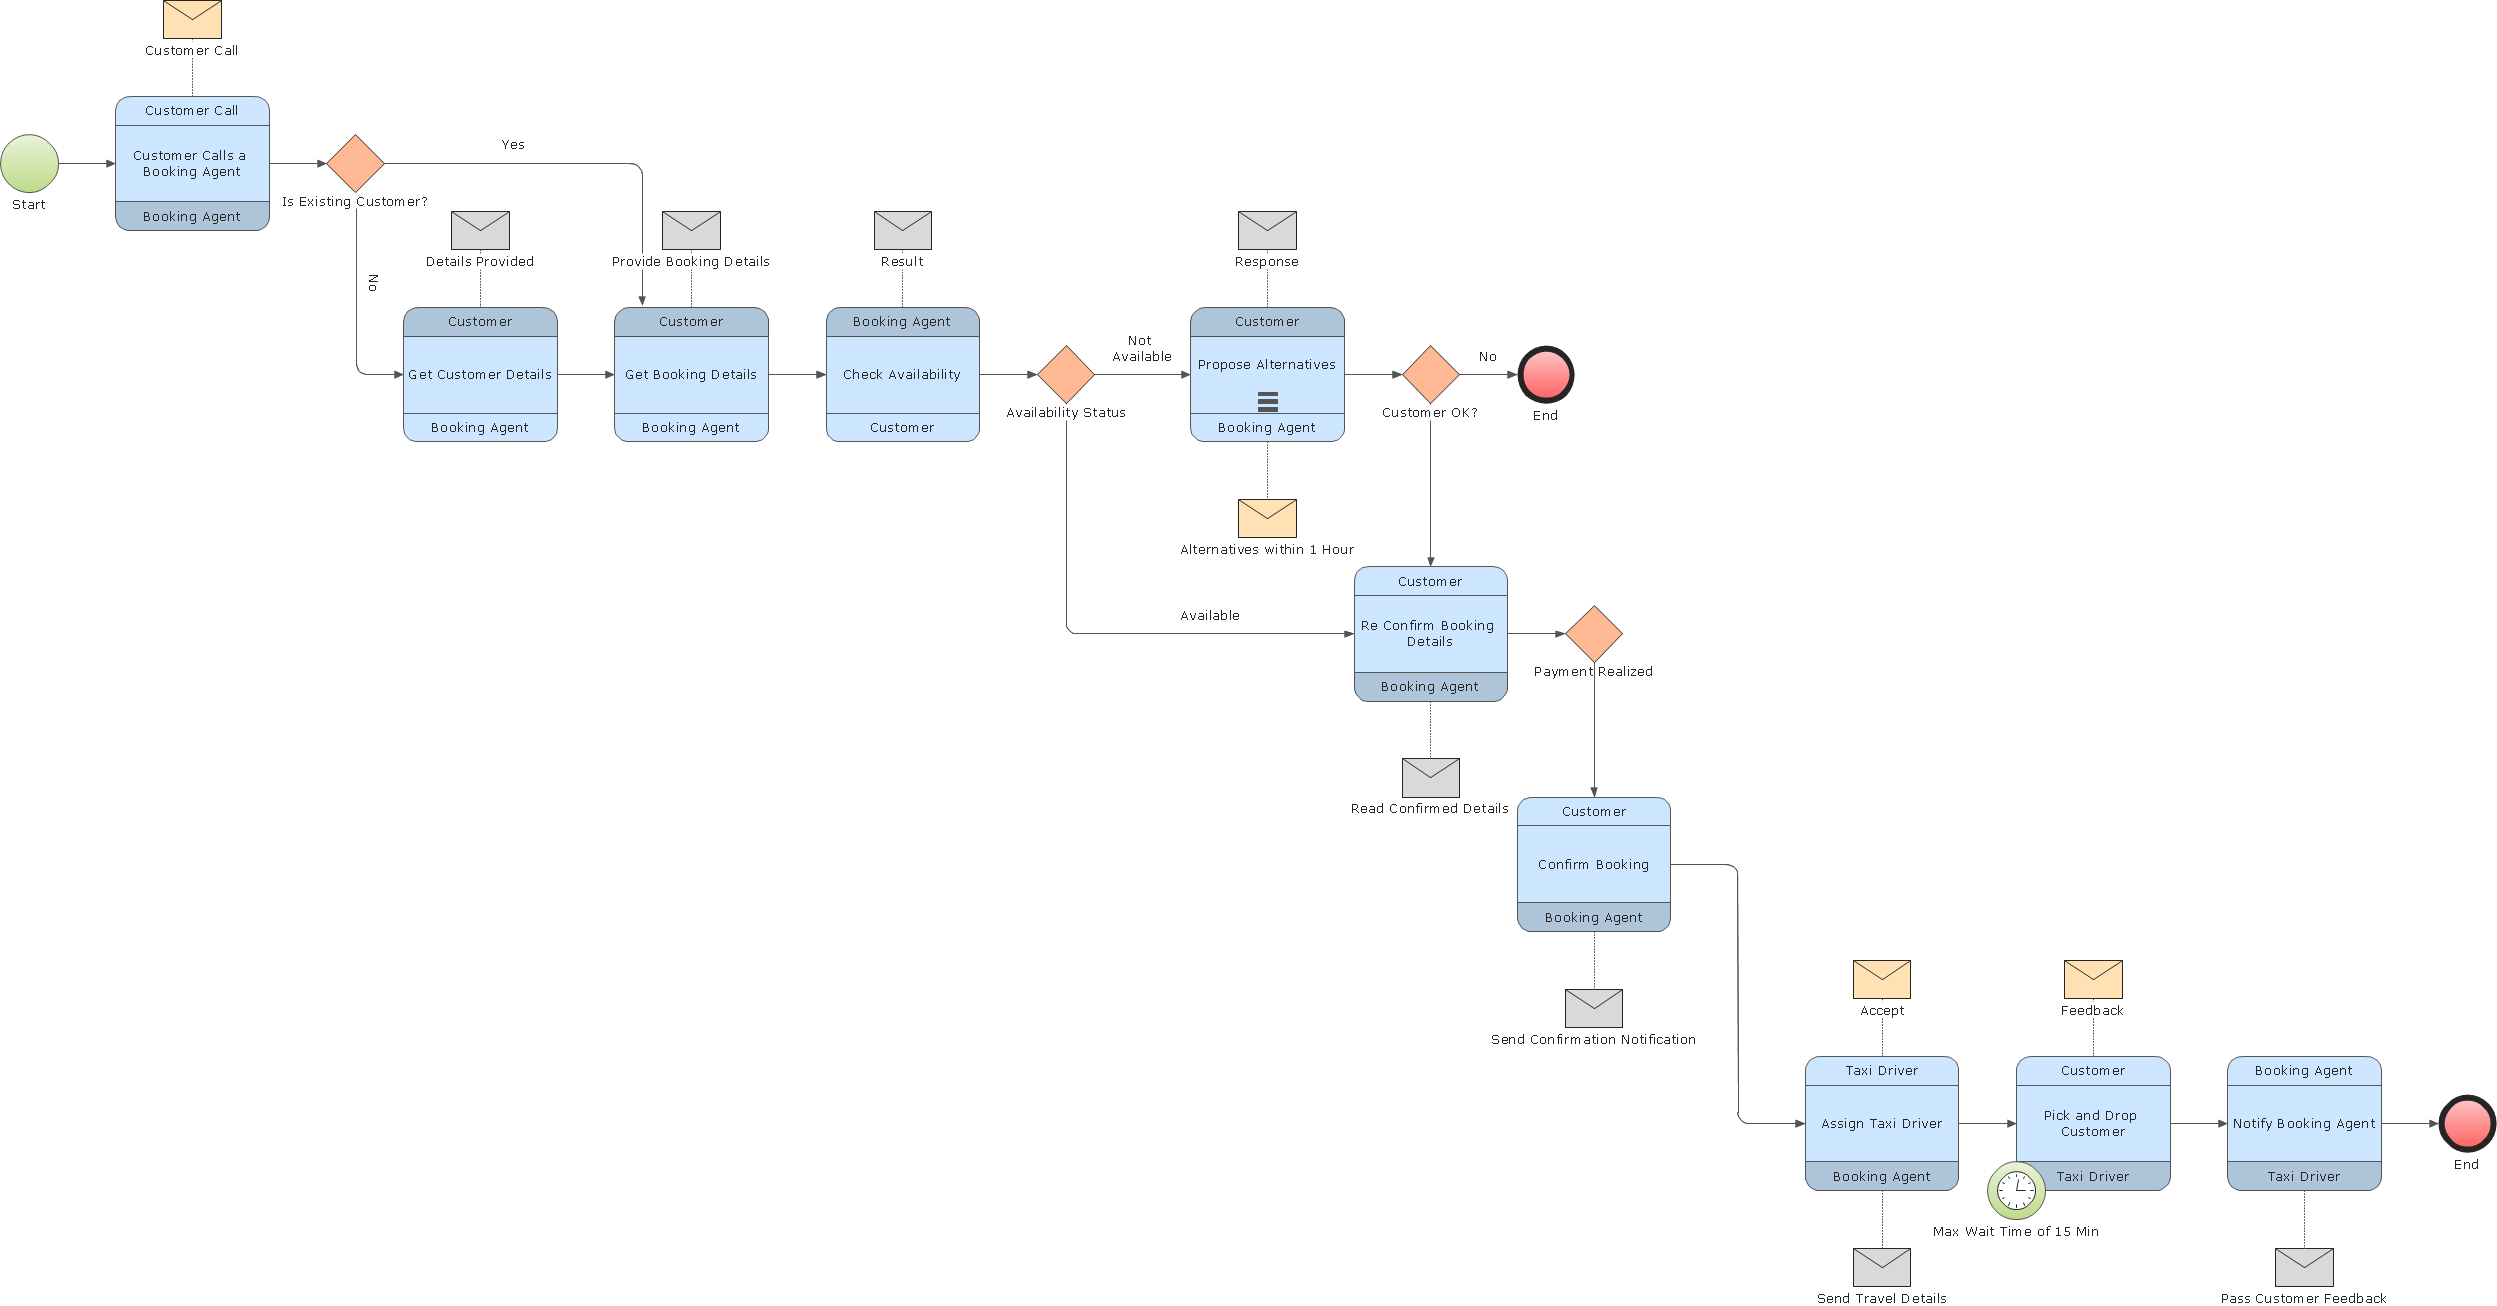
 Business Process Swim Lane Diagram Template
 Collaboration BPMN2.0