This financial flow chart example shows invoice payment process step-by-step.
TEN RELATED HOW TO's:
The Cloud Computing is the use of the software and hardware that includes the great number of computers connected over the communication network such as the Internet. The Cloud name comes from the usage the cloud symbol on the system diagrams as the abstraction for the complex network infrastructure. This term is used as a marketing metaphor for the Internet.
This example was created in ConceptDraw DIAGRAM using the Computer and Networks Area of ConceptDraw Solution Park and shows the Cloud Computing.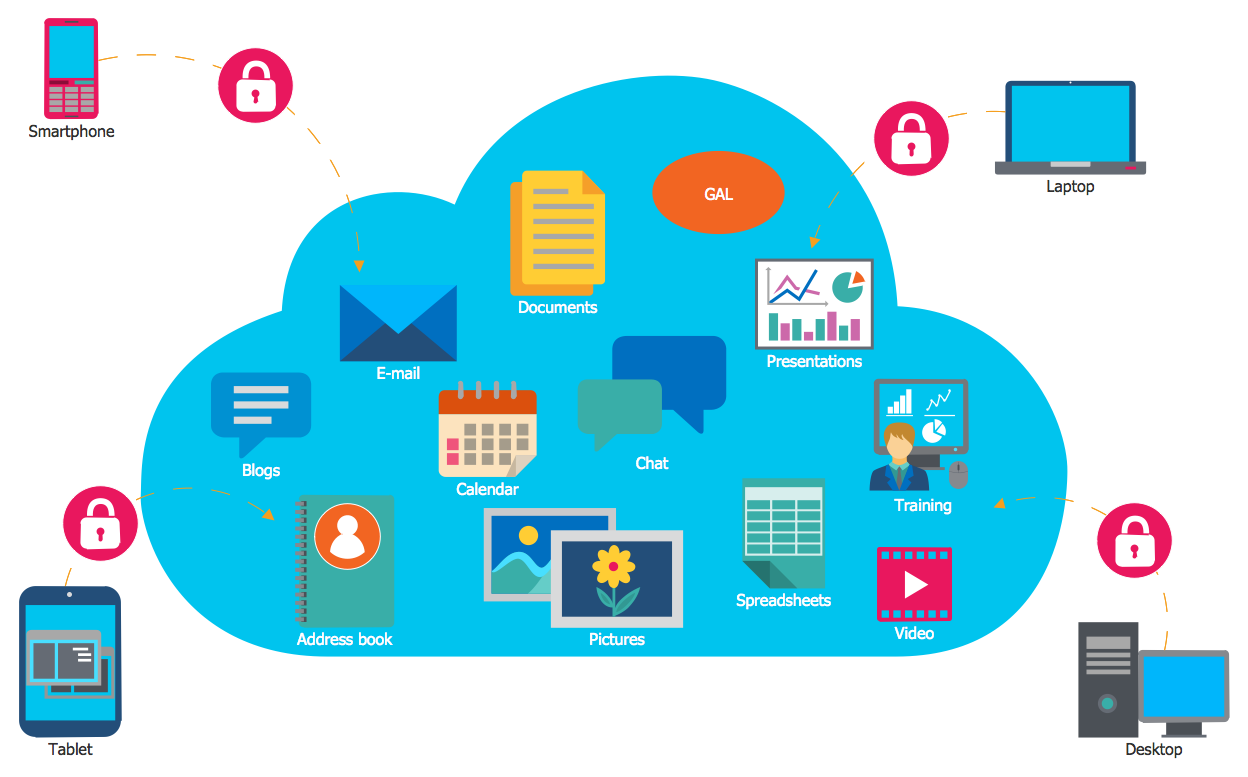
Picture: Cloud Computing
Related Solution:
The Total Quality Management Diagram solution helps you and your organization visualize business and industrial processes. Create Total Quality Management diagrams for business process with ConceptDraw software.
Picture: TQM Software — Build Professional TQM Diagrams
Related Solution:
Accounting is a cornerstone of any business, it’s basement. If you want to have a visual representation of your finance management, use audit flowchart symbols to document the money flow. Although some would say that accounting is boring, it is very a responsible duty.
The audit flowchart symbols is supplied with ConceptDraw Audit Flowcharts solution as a vector objects library. Together with Conceptdraw Drawing capabilities it forms the helpful tool for audit process planning and setting the steps of audit by designing audit flow charts. Audit Flow charts are used to organize fiscal information tracking process as well as in accounting, finance and investment management.
Picture: Audit Flowchart Symbols
Related Solution:
The Social Media Response solution provides the means to respond to social media mentions quickly and professionally. This tool keeps the entire team on the same page allowing you to realize your social media strategy, improve the quality of your answers, and minimize the time it takes to respond.
Picture: Manage Social Media Response Plan DFD
Related Solution:
Active Directory Diagrams visualize the detailed structures of the Microsoft Windows networks, Active Directory Domain topology, the Active Directory Site topology, the Organizational Units (OU), and the Exchange Server Organization.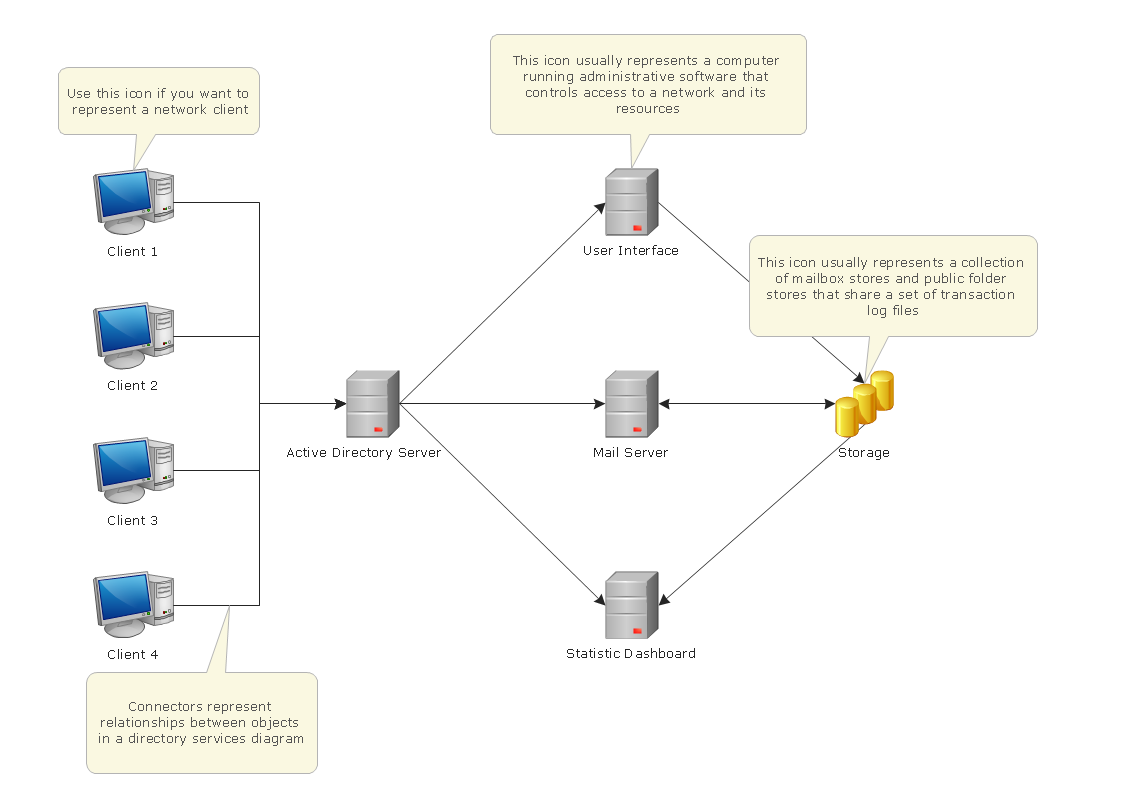
Picture: Active Directory Domain Services
ConceptDraw DIAGRAM is the professional business graphic software for drawing diagrams and charts with great visual appeal on Mac OS X.
Picture: The Best Drawing Program for Mac
Related Solution:
The Accounting flowchart shows how information flows from source documents through the accounting records. The are based on the accounting procedures or processes.
Picture: What process should be essentially adopted.Accounting Flowchart Example
Related Solution:
This sample shows the Flowchart that displays the architecture of SQL Exception Translation.
This sample was created in ConceptDraw DIAGRAM diagramming and vector drawing software using the Flowcharts solution from the Diagrams area of ConceptDraw Solution Park.
Picture: Sample Project Flowchart. Flowchart Examples
Related Solution:
A process flowchart is a picture of the separate steps of a process in sequential order.Use ConceptDraw DIAGRAM software and the vector stencils from object libraries are designed objects you can use adding to process flowcharts for the best result.
Picture: Create Process Flowcharts
Related Solution:
An orgchart shows how the responsibilities are divided between departments. It’s enough to have just one look on a proper organizational chart template to understand the idea and how it works. To understand how it’s made you should use a diagramming software.
This organizational diagram illustrates the possibilities of using ConceptDraw DIAGRAM to create orgcharts. This sample represents the common project management company. The chart shows the structure of devisions in the company, and the interaction between them. Communication between departments imply a certain structure affiliation and reporting. At the head of the company - President. This diagram was created using ConceptDraw solution for designing Organizational charts of any structure and complexity.
Picture: Organizational Chart Template
Related Solution:


