A full-featured project management solution with all the necessary functions right at your fingertips. Generates an extensive variety of reports on project and task statuses. Centralizes project information through embedded documents and hyperlinks. Unique Multiproject Dashboard manages multiple projects from a single file. Powerful integration with other ConceptDraw products makes project management easier than ever before.
Delivers a rich set of built-in functionalities and optional product extensions that support your daily workflow in time-saving and creative ways.
These videos provide a series of lessons that will enhance the understanding of all our users, from people just starting out with the software, through to expert users.
Separated into categories of Basic, Intermediate, and Advanced categories, the new instructional videos cover a huge breadth of topics. Users new to ConceptDraw PROJECT will find the Basic lessons an essential platform for familiarizing themselves with the ′s functions. Experienced users will benefit from the Intermediate and Advanced lessons, learning to take advantage of the program′s full capabilities and unlock its true potential.
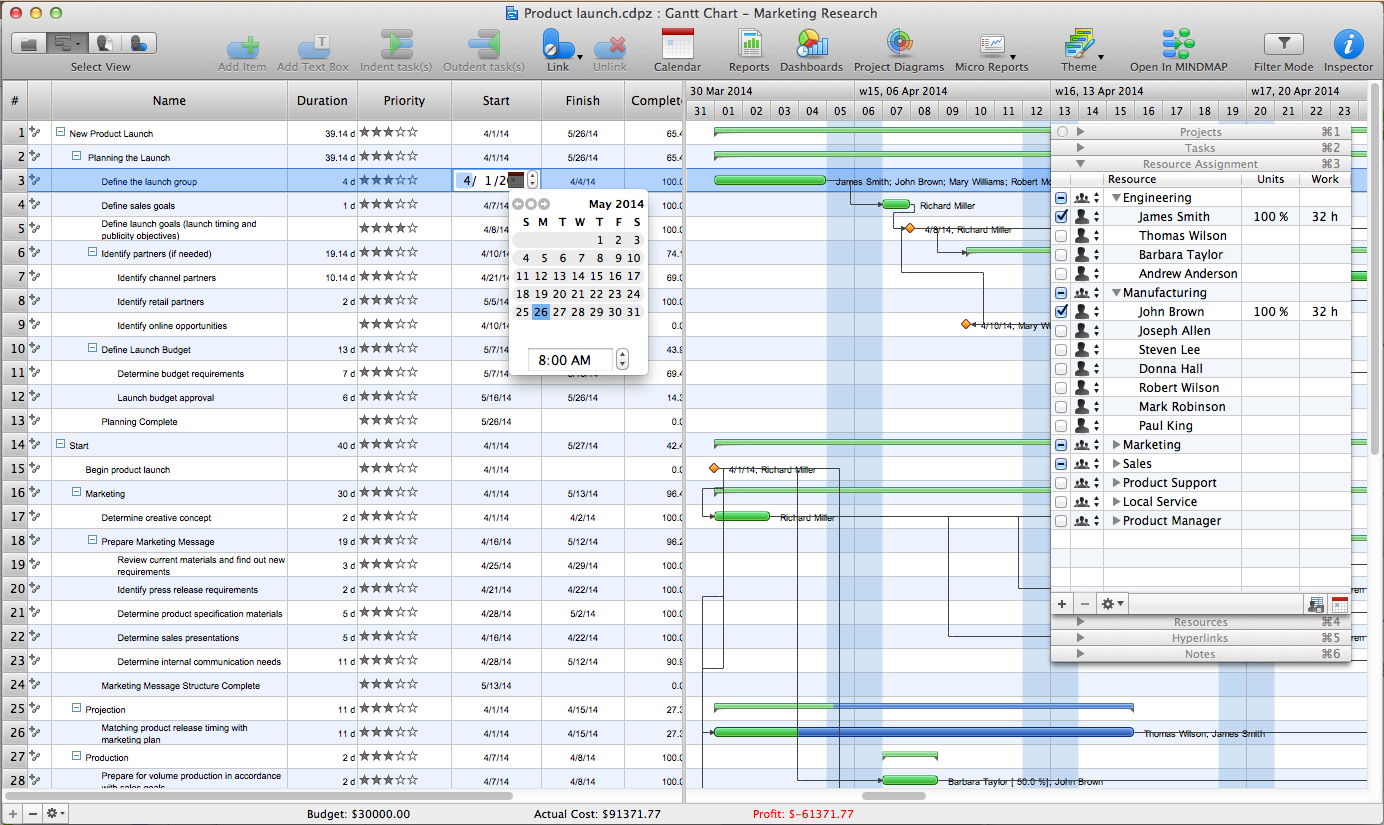
ConceptDraw PROJECT contains an extensive tool set to help project managers. The rich data visualization capability that is provided by ConceptDraw products helps you create project dashboards, one-click reports, multi-project views, Gantt charts, and resource views.
Let′s learn how to get maximum value using ConceptDraw PROJECT !
Here′s some feedback from a customer:
"The documentation behind ConceptDraw Office 2, both online and via the Help system is clear and comprehensive. Also, Odessa is developing a robust set of video tutorials for its website. These are particularly well done and helpful. ...I′ve learned over the years that some of the best software for the Mac comes from the shores of the Black Sea. My compliments to your entire team there."
Ric Getter,
Senior Editor,
MacDirectory Magazine
Now you know all of the tricks on assigning resources in ConceptDraw PROJECT. You can now better use these flexible management tools to realize your project’s goals efficiently.
Picture: Advanced Resource Assignment in ConceptDraw PROJECT
Big and complex projects sometimes need some simplification of plans and schedules. That's why Program Evaluation and Review Technique was invented and first implemented in 1958. You can create PERT diagrams effortlessly with ConceptDraw DIAGRAM and share them with your colleagues.
Program Evaluation Review Technique (PERT) is a method that is used to assess and analyze projects. PERT is a valuable tool for the project management practice. PERT gives an assessment and analysis of the time needed to the project completion. A PERT chart is a visual tool that delivers a graphical view of a project timeline. It is used to display the sequences and dependences of project tasks necessary to complete a project. ConceptDraw DIAGRAM delivers the possibility to build a PERT along with other diagrams applied to assist management process by using its Seven Management and Planning Tools solution.
Picture: Program Evaluation and Review Technique (PERT) with ConceptDraw DIAGRAM
ConceptDraw DIAGRAM diagramming and vector drawing software extended with Bar Graphs solution from the Graphs and Charts area of ConceptDraw Solution Park is ideal for drawing the Bar Charts fast and simply.
You need to draw Authority Matrix Diagram quick and easy? Design it with ConceptDraw DIAGRAM!
ConceptDraw DIAGRAM extended with Seven Management and Planning Tools solution from the Management Area is the best Authority Matrix Diagram Software.
Job duties in small companies are usually spread randomly among workers, causing lots of problems and misunderstanding. One of the ways to restore order in business processing is to create a cross-functional flowchart with swim lanes that would represent every step in production system. Another advantage of using swim lanes flowchart is that it represents not only processes, but people responsible for them.
Swim lane diagram is a kind of a process flow diagram. Its special feature is that it joins the features of process flow diagrams with organizational charts. Thus, a swim lane diagram display a participant of the business process in a conjunction with general flow of the business system. A swim lane diagram is looks similar to a swimming pool's lanes. Lanes can be horizontal and vertical. The lanes are pointed out relatively to resource name, which is assigned on implementation of the given part of the business process. ConceptDraw Business Process Mapping solution delivers the ability to design develop swim lanes flowcharts using the vector graphic objects of Swim Lanes library.
Flowcharts visualize a process or algorithm of program as step/operation blocks of various shapes connected with arrowed lines showed the process flow direction. They are used to visualize business or technical processes and software algorithms.
Conceptdraw DIAGRAM - feature-rich flowchart software. It will allow you to create professional looking flowcharts.
Every engineering project starts from a terms of reference document. The next stage of developing is a technical drawing, which requires using appropriate software. However, revisions and discussions about requirements are possible at any stage of development.
This technical drawing demonstrates a schematic flow diagram of pulp reclaiming. This diagram of magnetite pulp reclaiming is created using ConceptDraw Chemical and Process engineering solution, The solution delivers more than 460 vector graphic icons and connectors. Generally, it is intended for designing process and instrumentation diagrams (P&ID) for chemical and process engineering. block flow diagrams (BFD), process flow diagrams (PFD) for chemical industry.
In ConceptDraw DIAGRAM it really is sp simple to draw even the most complex cross-functional flowcharts. Use the RapidDraw technology and Cross-Functional libraries in ConceptDraw DIAGRAM for the best results.
Picture: How to Simplify Flow Charting — Cross-functional Flowchart