
This network diagram sample is created using ConceptDraw DIAGRAM diagramming and vector drawing software enhanced with Computer & Networks solution from ConceptDraw Solution Park.
Computer & Networks solution provides libraries of stencils for drawing network floor plan layouts, network communication plans, Cisco network diagrams, Active Directory diagrams, logical network diagrams, LAN and WAN diagrams.
TEN RELATED HOW TO's:
Home remodeling is something that many people face at one point or the other. The first part of any home remodeling is to create a new home plan. At first, it may seem a daunting and costly endeavor, but to take it on yourself, you just need to choose the right home remodeling software. Digital drawing software, such as ConceptDraw DIAGRAM , includes home plan examples to help you get started, as well as multiple advanced and powerful options, and an intuitive interface to go with them.
People who want to make changes in their houses planning have previously prepare a plan of rebuilding, of house, apartment or any other construction. If somebody desires to change anything in the interior design he also requires a plan, as it’s handy to see on the plan the coming result and then begin to implement it. All these tasks will be solved better with ConceptDraw DIAGRAM and its solution for Building Plans. You will design professional looking Home Plans quick and easy using the vector libraries, templates and samples, supplied with Solution.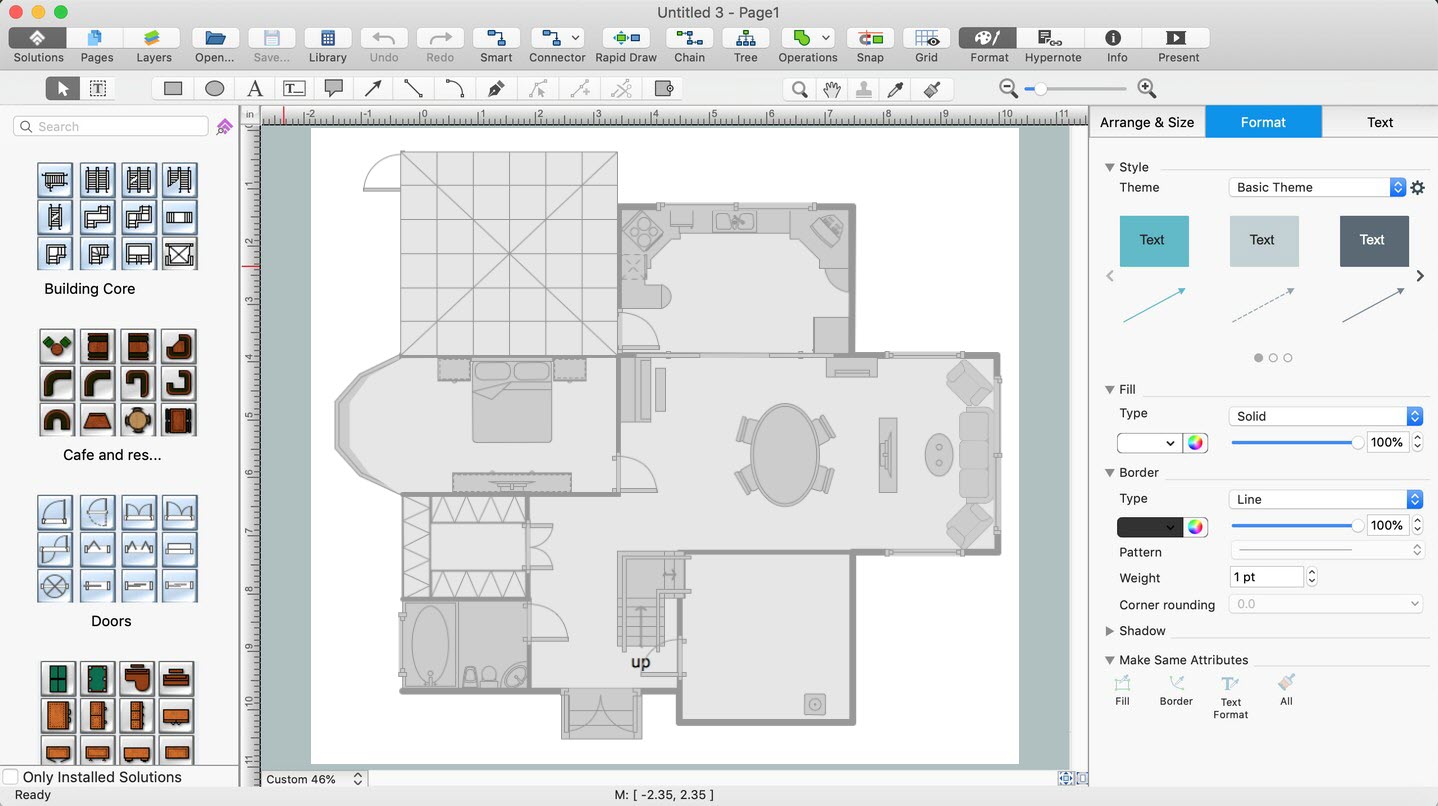
Picture: Home Remodeling Software. Home Plan Examples
Related Solution:
When studying computer science, it is important to have good training manuals. To understand how the networks and data links work, you will probably need a set of network diagram examples depicting all the possible interconnections between network devices. You can find them on Internet or try to create your own.
This example of a network topology diagram was made using ConceptDraw Computer and Network Diagrams solution. It represents a bus topology network diagram. A bus topology means that computers and peripherals in the network are connected to a mutual cable (backbone). This topology is often used for small networks. This diagram was designed using vector libraries of network equipment symbols. They also can be applied while creating various LAN and WAN diagrams.
Picture: Network Diagram Examples
ConceptDraw DIAGRAM is perfect for software designers and software developers who need to draw Computer and Network Diagrams._Win_Mac.png)
Picture: Network Diagramming Software for DesignComputer and Network Diagrams
ConceptDraw is rapid and powerful network diagram drawing software with rich examples, templates, design objects and stencils.
Picture: Draw Network Diagram based on Templates and Examples
Remote Networking - We explain the method most people use to connect to the Internet.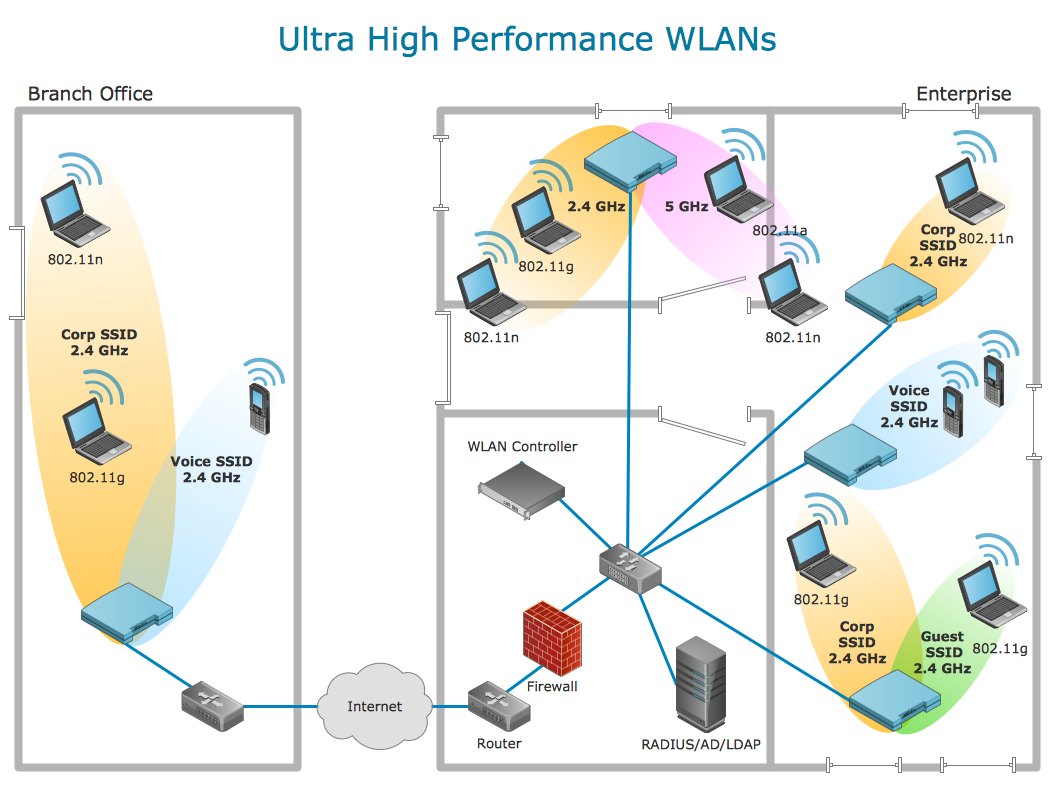
Picture: Using Remote Networking Diagrams
Drawing Network Protocols using ConceptDraw DIAGRAM stencils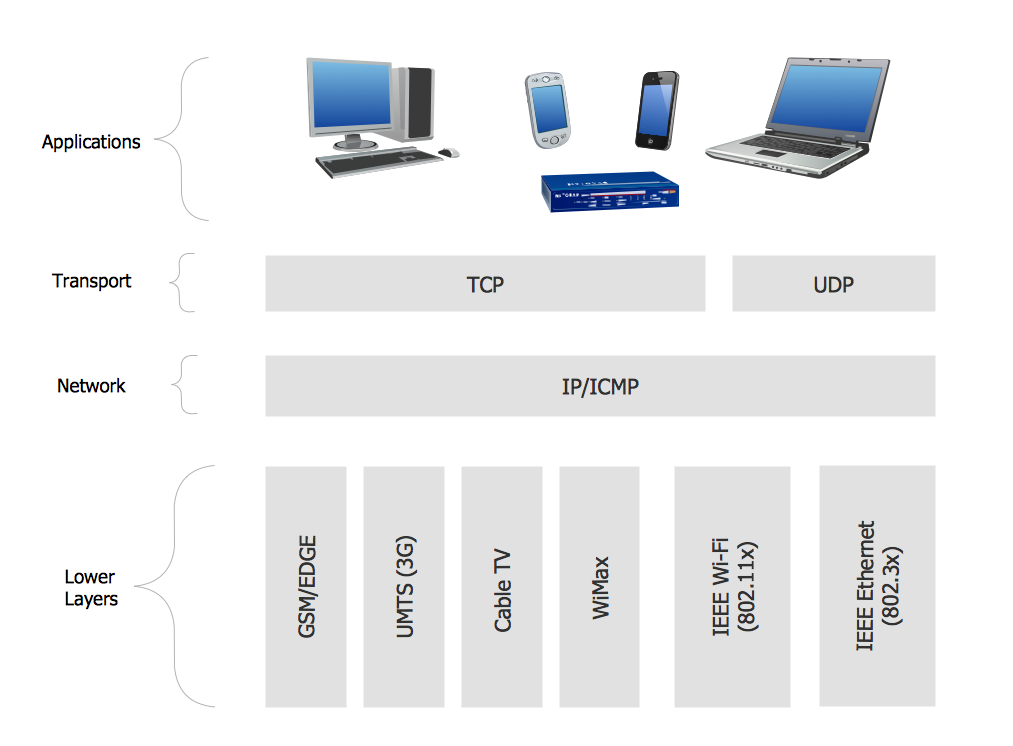
Picture: Network Protocols
It’s not easy to plan all the details of your landscape at once. Therefore, you can use a bubble diagram to create a draft of the future project. You can develop any bubble diagrams and use them in your landscape design project with ConceptDraw DIAGRAM and it’s predesigned templates.
This bubble diagram can be applied while initiating the development of garden and landscape design. The bubble diagrams used for this purpose are different from the classic bubble diagrams. Being used in landscape and garden design, they obtain the quite another understanding. Bubbles in this diagram visualize some captured areas, which define the general spaces of a future garden: lawn, flower garden, pool, built-up area, lighting, etc. The bubble diagram represents the landscape project without any special expenses on its creation. It is better to make such simple sketch before you drill down into detailed project and cost estimates.
Picture: Bubble diagrams in Landscape Design with ConceptDraw DIAGRAM
If you ever wanted to try any diagramming tools except of Visio, but were afraid to lose existing documents, there’s good news for you. One of the most striking features of ConceptDraw DIAGRAM is it’s perfect compatibility with MS Visio, which guarantees that you won’t depend on operating system anymore, because another ConceptDraw DIAGRAM feature is that it’s cross-platform tool. Don’t waste your time looking for other options, you’ve found the solution already!
Business professionals often utilize the MS Visio as a common tool for making various issues on business visualization. MS Visio is a strong software with good capacity to maintain complex business solutions. But there is no MS Visio for Apple OS X. This is a large invocation, and one would be pleased to recognize that ConceptDraw DIAGRAM is the ideal alternative to MS Visio. Primarily, because this software works natively on both Windows and Apple OS X platforms. if you have migrated from Windows to Mac, or need to communicate in a cross-platform conditions, you’ll search for MS Visio replacer. ConceptDraw DIAGRAM is the exclusive professional business diagramming application that runs on both Windows and Apple OS X. The opportunity exchange files between PC and Mac, as well as between ConceptDraw DIAGRAM and Visio is the significant advantage that permits you to display and to collaborate business information in effortless and cost-effective way.
Picture: ConceptDraw DIAGRAM Compatibility with MS Visio
ConceptDraw Network Diagram Software - Network design software for network drawings with abundant examples and templates.
Create computer network designs, diagrams and schematics using ConceptDraw.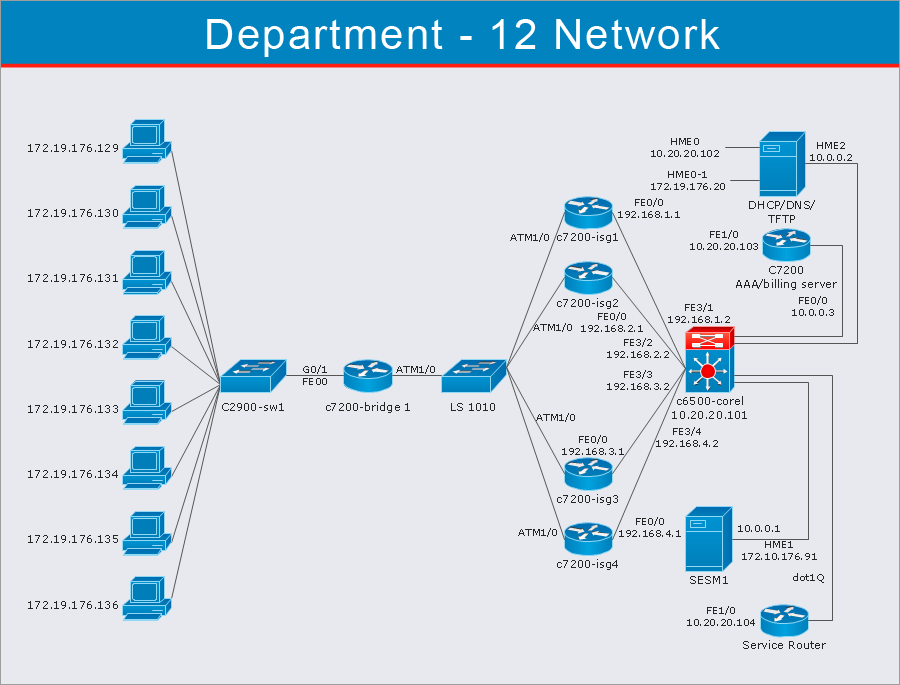
Picture: Network Diagram Software
Computer networks nowadays are spread all across the world. The large number of parameters, such as geographic scale or communication protocols, can divide networks. One of the most common types of networks is called local area network (LAN). It convenient to represent network examples by means of diagrams.
This local area network (LAN) diagram provides an easy way to see the way the devices in a local network are interacted. The diagram uses a library containing specific symbols to represent network equipment , media and the end-user devices such as computers (PC, mac, laptop) , network printer, hubs, server and finally a modem. There are two types of network topologies: physical and logical. The current diagram represents precisely a physical type of LAN topology because it refers to the physical layout of a local network equipment.
Picture:
What is a Local Area Network?
Examples of LAN Diagrams
Related Solution: