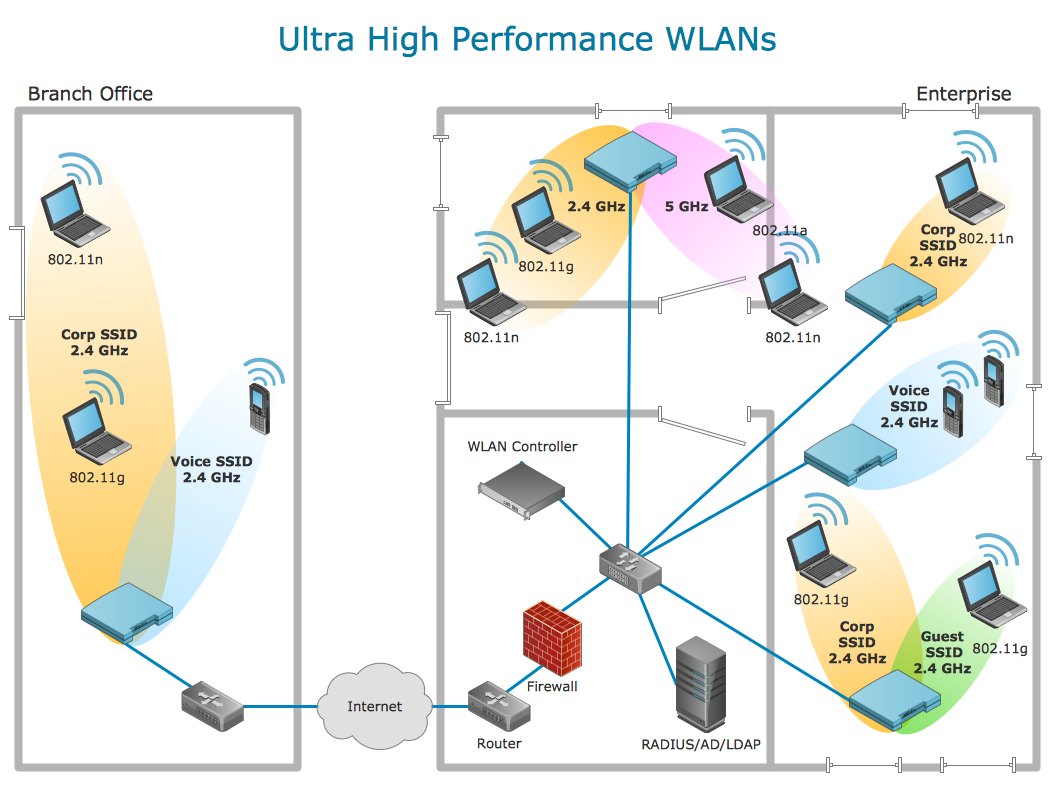
This ultra high performance WLAN network diagram sample is created using ConceptDraw DIAGRAM diagramming and vector drawing software enhanced with Computer & Networks solution from ConceptDraw Solution Park.
Computer & Networks solution provides examples, templates and libraries of symbols for drawing remote networking diagrams: LAN and WAN, topology or configuration design of the remote network access for users at remote offices.
TEN RELATED HOW TO's:
Network Security Architecture Diagram visually reflects the network's structure and construction, and all actions undertaken for ensuring the network security which can be executed with help of software resources and hardware devices. You dream to find powerful software for easy designing Network Security Architecture Diagram? We recommend to use ConceptDraw DIAGRAM extended with Network Security Diagrams Solution from the Computer and Networks Area of ConceptDraw Solution Park.
Picture: Network Security Architecture Diagram
Related Solution:
ConceptDraw DIAGRAM is perfect for software designers and software developers who need to draw Computer&Network Diagrams.
ConceptDraw has 1004 vector stencils in the 40 libraries that helps you to start using software for designing own Network Diagrams. You can use the appropriate stencils from Computer and Network Diagrams library with 56 objects..png)
Picture: Design Element: Computer and Networkfor Network Diagrams
Related Solution:
The VMware vNetwork Distributed Switch (vDS) is the new virtual switch (vSwitch) with vSphere 4 that extends the set of features of the VMware vNetwork Standard Switch (vSS). The VMware vSS is the base-level virtual networking alternative that extends the capabilities, configuration and appearance of the standard vSwitch in VMware ESX 3.5 to ESX 4.0 and vSphere 4.
This example was created in ConceptDraw DIAGRAM using the Computer and Networks Area of ConceptDraw Solution Park and shows the VMware vDS network diagram.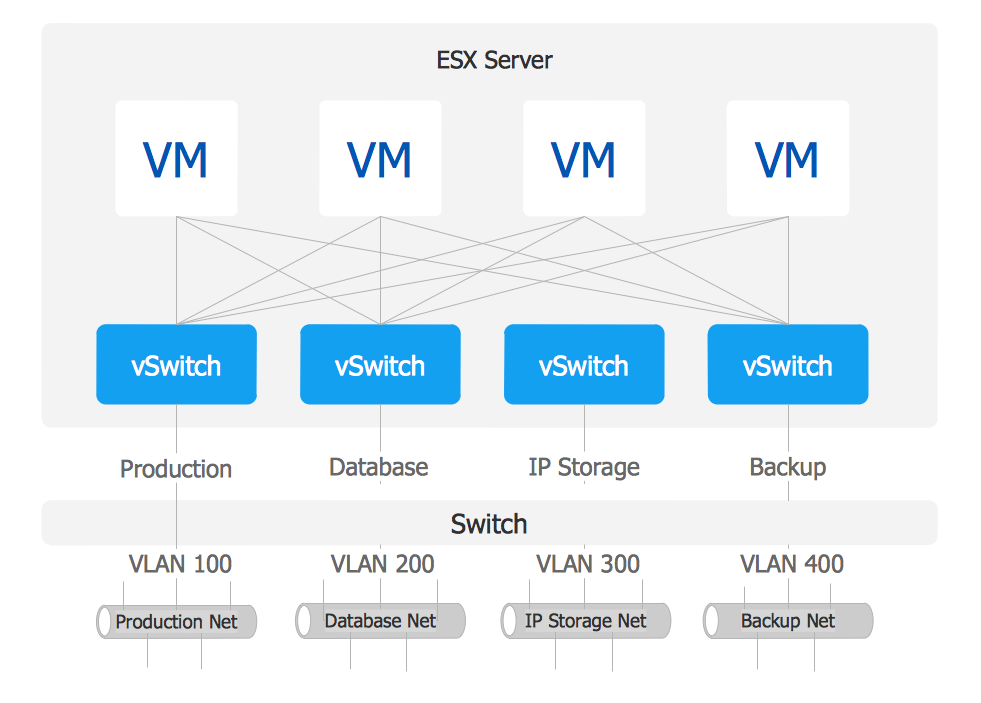
Picture: VMware vNetwork Distributied Switch (vDS). Computer and Network Examples
Related Solution:
This sample was created in ConceptDraw DIAGRAM diagramming and vector drawing software using the Computer and Networks solution from Computer and Networks area of ConceptDraw Solution Park.
This is example of the Toroidal network topology
Network topology is the topological structure of the computer network.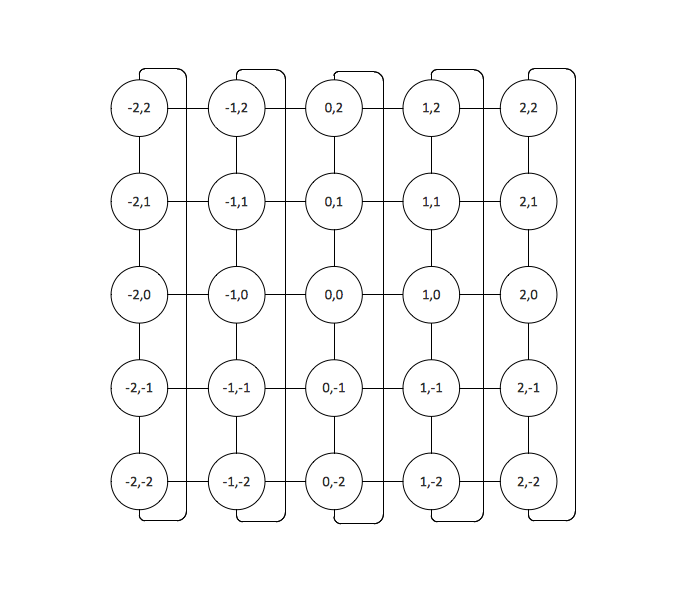
Picture: Toroidal Network Topology
Related Solution:
All computer networks differ by various params, and their size is one of them. As global area networks are the biggest, personal area (PAN) networks are the smallest. Personal computers, smartphones and other devices that have possibility to connect to Internet form a personal network.
This diagram was created using ConceptDraw Computer Network Diagrams to represent a typical components of Personal area network. A personal area network (PAN) is the connection of IT devices around an individual person. This sample of personal area network involves a notebook, a personal digital assistant (PDA), and a portable printer. Commonly a PAN contains such wireless devices as mouse, keyboard, smartphone and tablet. A wireless connection is typical for a PAN.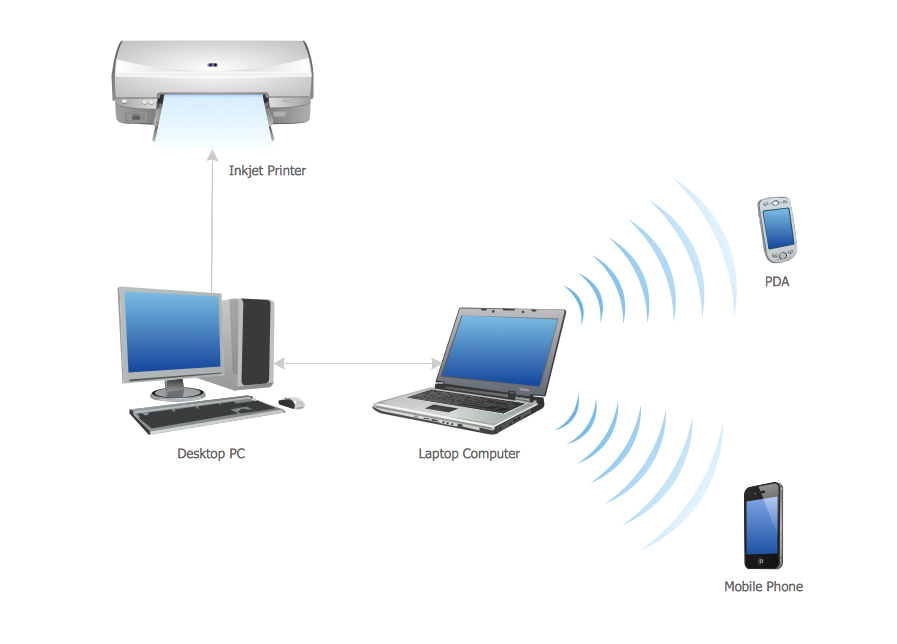
Picture: Personal area (PAN) networks. Computer and Network Examples
Related Solution:
Any business process consists from a number of tasks carrying out the certain business goal. It is useful to diagram business processes to ensure that they are as foolproof, logical and sequential as possible. This business process diagram describes a typical booking process flow by the example of a cab booking process. It can be used as a roadmap for any booking system implementation. Diagramming a business process allows you to look at the entire project and take into account all types of possible scenarios. Business process diagram helps you investigate and clarify the process thoroughly so that you can find out how it can be improved. Business process diagram supports team communications by ensuring that each process element is clear and everyone in the team is on the same page.
Sometimes your company brings you less profit than you expect it to be, and it’s difficult to reveal the causes. Maybe it’s time to learn new technologies, because business diagram are easily developed by means of special software, so you won’t make any extra effort. In return, you will increase your productivity and get more done in a less time.
Picture: Business Diagram Software
Related Solutions:
Studying informatics demands knowledge in the area of computer networks as well. The most famous world network, Internet, is an example of wide area network (WAN) topology that connects devices spread on any distance. Unlike other smaller networks that are limited to a building or to a campus, WAN is almost limitless.
This WAN (wide area network) diagram was created in ConceptDraw DIAGRAM. It shows a telecommunication network that covers a large geographical area connecting several settlements. This type of networks is commonly used by business and government institutions. Using the WANs enables them quickly communicate information between remote geographical points. To reproduce this network diagram, you will need the means, provided by ConceptDraw Computer and Network Diagrams solution.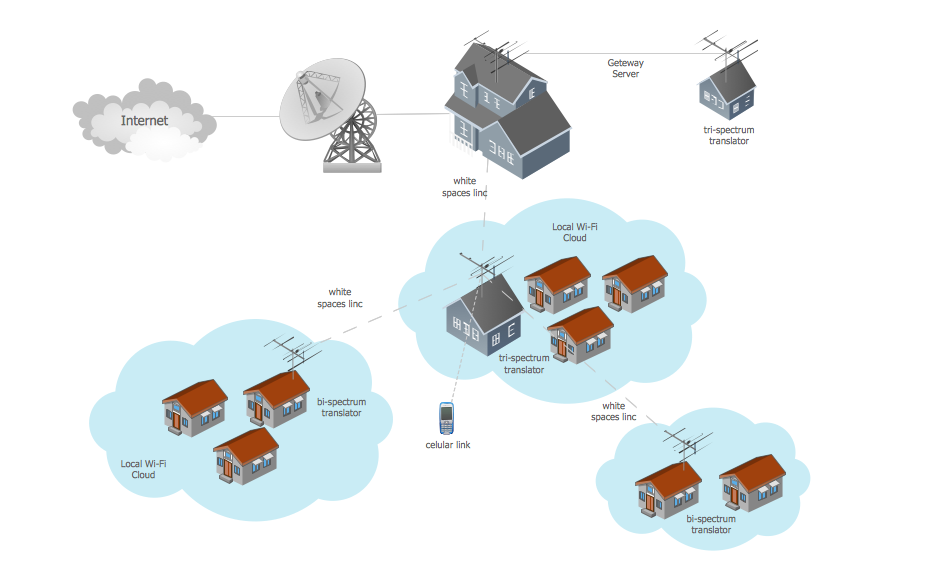
Picture: Wide area network (WAN) topology. Computer and Network Examples
Related Solution:
The ConceptDraw Wireless Networks solution helps users to quickly transit from an idea to the implementation of a both wired and wireless computer networks.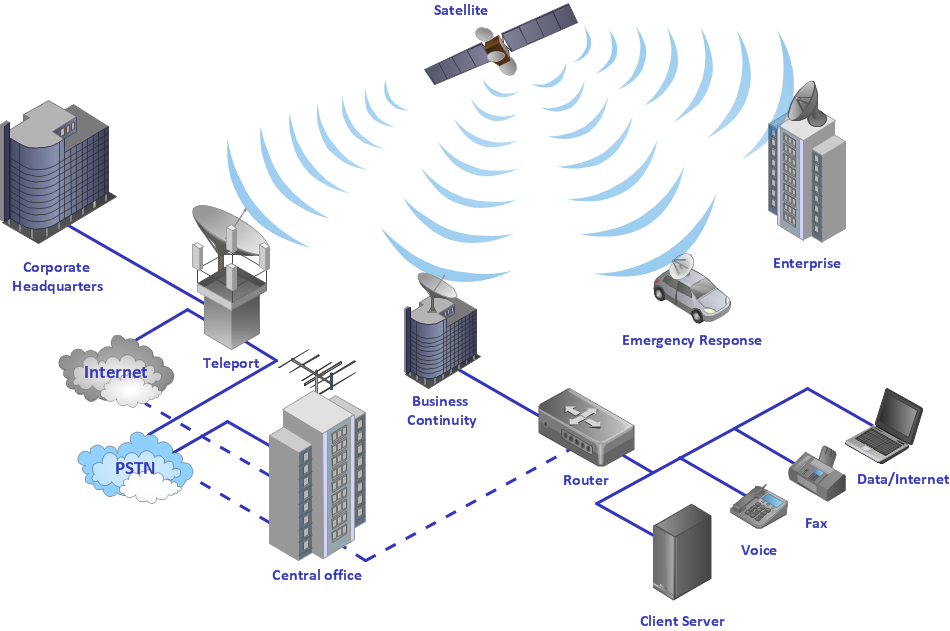
Picture: Using Both Wired and Wireless Connections
Related Solution:
ConceptDraw DIAGRAM diagramming and vector drawing software extended with Security and Access Plans Solution from the Building Plans Area of ConceptDraw Solution Park is a powerful software for fast and easy drawing professional looking Physical Security Plan.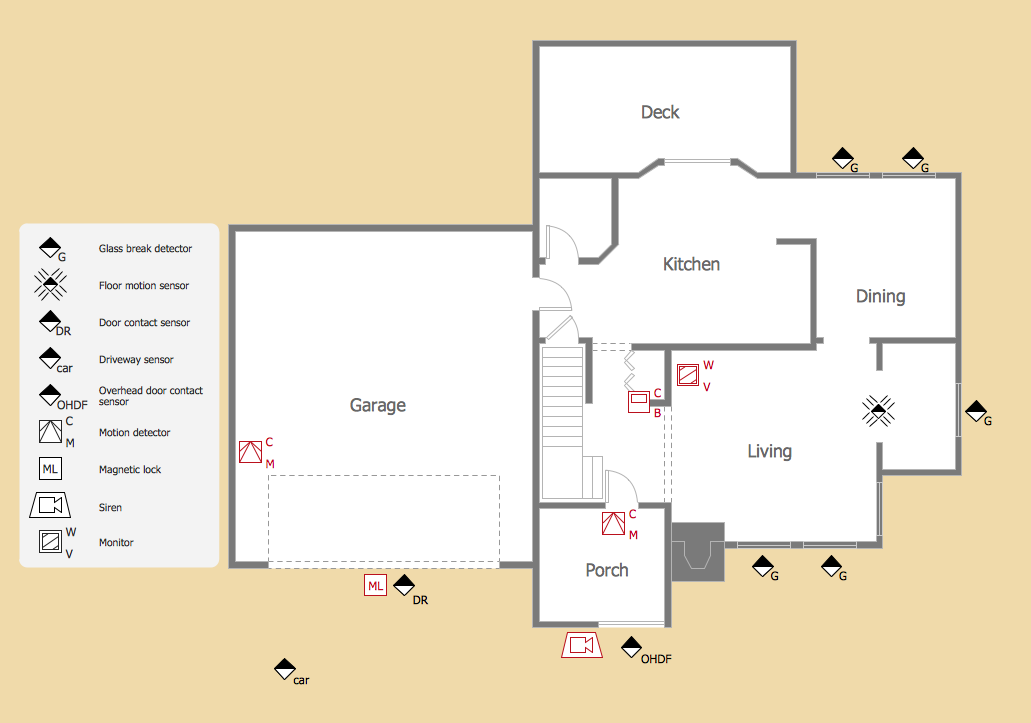
Picture: Physical Security Plan
Related Solution:
Activity on Node Network Diagramming Tool - Activity Network and Project Evaluation and Review Technique, or PERT, charts are a way of documenting and analyzing the tasks in a project.
This sample shows the Activity on node network diagramming method. It was created in ConceptDraw DIAGRAM diagramming and vector drawing software using the Seven Management and Planning Tools solution from the Management area of ConceptDraw Solution Park.
Picture: Activity on Node Network Diagramming Tool
Related Solution: