Example 1. Cloud Computing Architecture
Cloud Computing Diagrams Solution provides 4 libraries containing 492 vector objects specially developed by professionals for ConceptDraw DIAGRAM users. Click previews below to enlarge them.
Thanks to these libraries of predesigned objects, you can design your Architecture diagrams and Cloud Computing Architecture diagrams of any complexity in a few clicks.

Example 2. Cloud Computing Diagrams Solution in ConceptDraw STORE
The Cloud Computing Diagrams Solution contains also variety of helpful Cloud Computing examples and samples which are available for viewing and editing from ConceptDraw STORE.

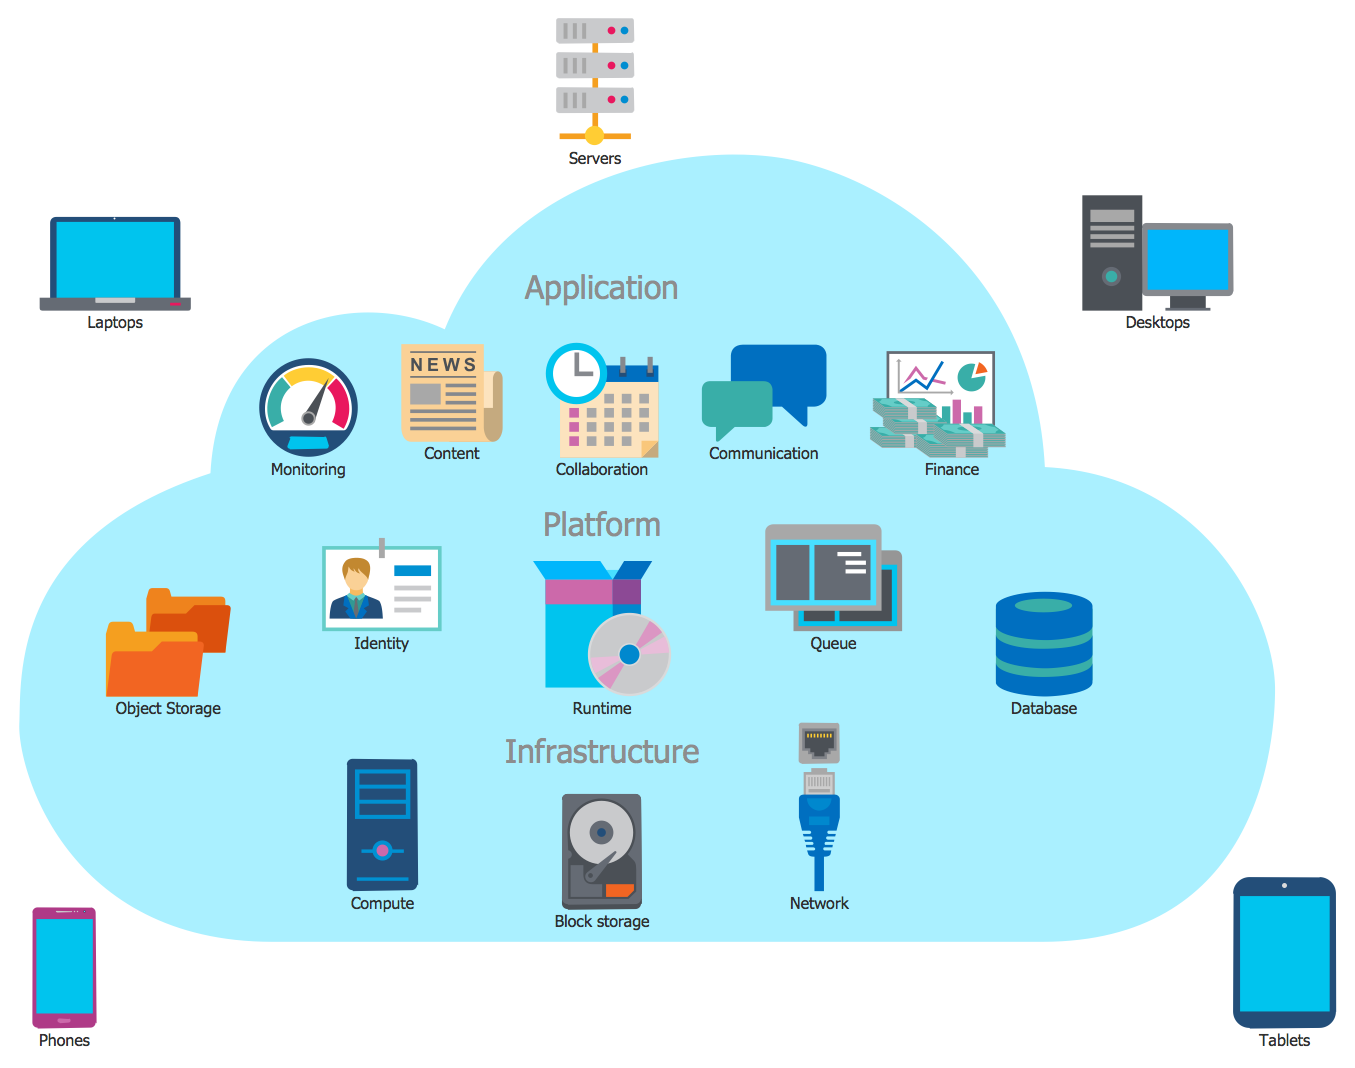
Example 3. Cloud Computing Diagram - SmartCloud Model
The diagrams you see on this page were created in ConceptDraw DIAGRAM using the tools of Cloud Computing Diagrams Solution for ConceptDraw Solution Park. An experienced user spent 5-15 minutes creating every of these samples.
Use the Cloud Computing Diagrams Solution for ConceptDraw DIAGRAM software to create your own professional looking Cloud Computing Architecture diagrams and schemes quick, easy and effective, and then successfully use them in your work activity.
All source documents are vector graphic documents. They are available for reviewing, modifying, or converting to a variety of formats (PDF file, MS PowerPoint, MS Visio, and many other graphic formats) from the ConceptDraw STORE. The Cloud Computing Diagrams Solution is available for all ConceptDraw DIAGRAM users.
TEN RELATED HOW TO's:
A flowchart is a powerful tool for examining processes. It helps improving processes a lot, as it becomes much easier to communicate between involved people, to identify potential problems and to optimize workflow. There are flowcharts of different shapes, sizes and types of flowchart vary from quite basic process flowcharts to complex program flowcharts. Nevertheless, all these diagrams use the same set of special symbols like arrows to connect blocks, parallelogram to show data receiving or rectangles for showing process steps.
Basic flowcharts are used to represent a simple process algorithm. A basic flowchart notation consists of rectangles (business processes), arrows (the flow of information, documents, etc.). The same notation is used in items such as the "decision", which allow you to do the branching. To indicate the start of the entire business process and its termination can be used the "Terminator" element. The advantages of Basic Flowchart are simplicity and clarity. With it you can quickly describe the business process steps. Creating of Basic Flowchart does not require any special knowledge, as easily understand by employees with different levels of education and IQ.
Picture: Types of Flowchart: Comprehensive Overview
Related Solution:
ConceptDraw DIAGRAM is a powerful intelligent vector graphics engine that can be used to create basic diagrams including flowcharts, charts, workflows, flowcharts, organizational charts, business diagram, learn business diagrams, flow diagrams.
Picture: The Best Mac Software for Diagramming or Drawing
Related Solution:
ConceptDraw DIAGRAM extended with Bar Graphs solution from Graphs and Charts area of ConceptDraw Solution Park is ideal software for quick and simple drawing bar chart of any complexity graph.
Picture: Bar Chart
Related Solution:
One of the three main constituents of any enterprise is the Control and Information Architecture. The rest two are Production facilities and People and Organization.
Picture: Control and Information Architecture Diagrams (CIAD) with ConceptDraw DIAGRAM
If you are just a beginner in drawing flowcharts, it may seem that a sheet of paper and a pen are just enough. However, at the time you would want to share your results, diagramming applications would suite you better. it’s very easy to create diagrams that way and to discover new kinds of flowcharts.
The huge collection of sample ConceptDraw diagrams, charts, illustrations and other types of business drawings includes a wide range of business themes. A huge number of graphic images of ConceptDraw documents is divides on business application areas according to business-oriented solutions for which they were made.Here is a short visual list of samples of flowcharts, process diagrams, UML models, management charts, computer network diagrams, maps, infographics, illustrations, etc. In short, each ConceptDraw solution is accompanied with at least ten samples representing some particular examples of the application of the given chart.
Picture: Applications
ConceptDraw DIAGRAM diagramming and vector drawing software enhanced with Network Security Diagrams Solution from the Computer and Networks Area of ConceptDraw Solution Park is the best for effective design professional, colorful and attractive Network Security Diagram of any complexity and degree of detailing.
Picture: Network Security Diagram
Related Solution:
How should diagramming software work? The answer is - Fast and easy.
Tree- mode drawing works like that. Just select objects in your drawing and press Tree or Chain button to connect all of them just in one click.
Your diagram looks professional and it took only a moment to draw.
Picture: ConceptDraw Arrows10 Technology
Timeline is a type of diagram which illustrates the series of events in a chronological order on a linear timescale. How to make a timeline? It is convenient to use a modern powerful software. ConceptDraw DIAGRAM diagramming and vector drawing software extended with Timeline Diagrams solution from the Management area is exactly what you need.
Picture: How to Make a Timeline
Related Solution:
ConceptDraw DIAGRAM diagramming and vector drawing software extended with Physics solution from the Science and Education area is the best for creating: physics diagrams, pictures which describe various physical facts and experiments, illustrations of various electrical, mechanical and optic processes, of any complexity quick and easy.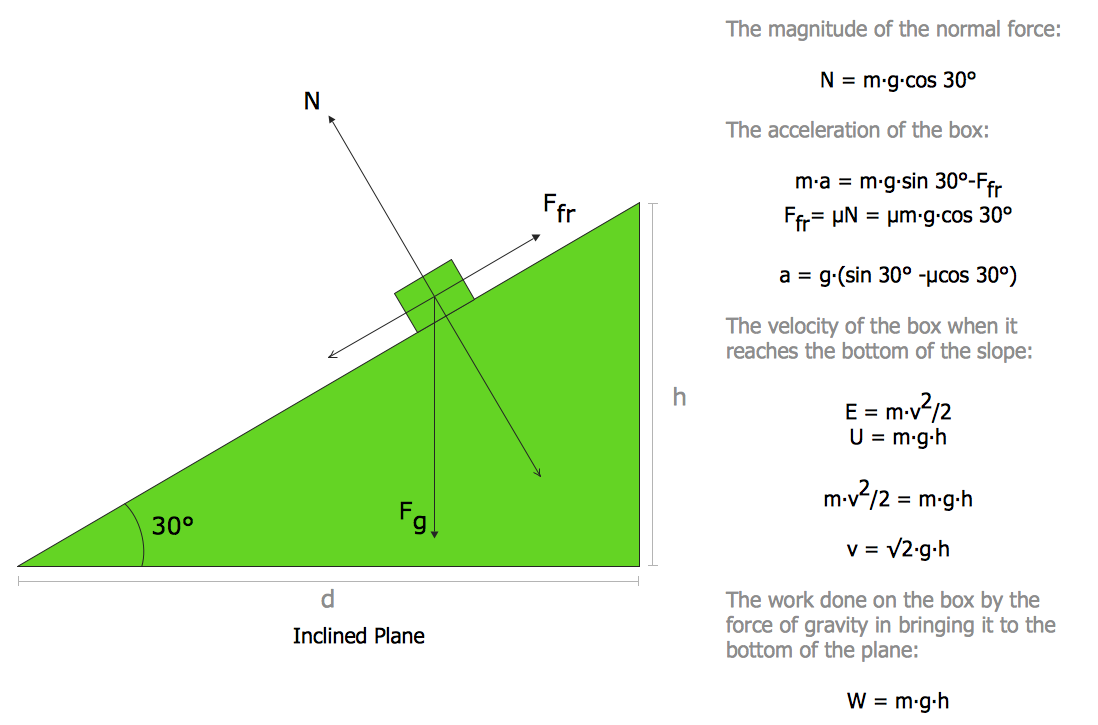
Picture: Physics Diagrams
Related Solution:
Use Case Diagrams technology. An effective management of changes is significantly facilitated by way of definition and documenting of business-requirements.
Picture: IDEF9 Standard


