
Example 1. Architecture Diagrams
Cloud Computing Diagrams Solution provides large set of powerful drawing tools, predesigned samples and examples, and 4 libraries:
- Cloud Clipart
- Cloud Round Icons
- Cloud Shapes
- Cloud Connectors
which include numerous collection of clipart, icons and connectors - altogether 492 ready-to-use vector objects for Architecture diagrams design.

Example 2. Cloud Computing Symbols
Follow the next few steps to design any Architecture Diagram in ConceptDraw DIAGRAM
- Click and drag desired objects from the libraries to your document, or double-click to add the object to the middle of ConceptDraw document.
- Arrange the objects and connect them with connectors objects from the Cloud Connectors library.
- Add the text and make color changes, if needed.

Example 3. Cloud Marketing Diagram
The diagrams you see on this page were created in ConceptDraw DIAGRAM using the tools of Cloud Computing Diagrams Solution for ConceptDraw Solution Park. An experienced user spent 5-10 minutes creating every of these samples, all they are available for use from ConceptDraw STORE.
Use the Cloud Computing Diagrams Solution for ConceptDraw DIAGRAM software to create your own professional looking Architecture diagrams and Cloud Computing Architecture diagrams quick, easy and effective.
All source documents are vector graphic documents. They are available for reviewing, modifying, or converting to a variety of formats (PDF file, MS PowerPoint, MS Visio, and many other graphic formats) from the ConceptDraw STORE. The Cloud Computing Diagrams Solution is available for all ConceptDraw DIAGRAM users.
TEN RELATED HOW TO's:
ConceptDraw offers you a number of ready-made organizational chart templates which you can use in your drawing. They are grouped in topical sets as organizational chart template files.
Use the Organizational Charts Solution for ConceptDraw DIAGRAM to create your own Organizational Charts of any complexity quick, easy and effective.
The Organizational Charts designed with ConceptDraw DIAGRAM are vector graphic documents and are available for reviewing, modifying, converting to a variety of formats (image, HTML, PDF file, MS PowerPoint Presentation, Adobe Flash or MS Visio XML), printing and send via e-mail in one moment.
Picture: Organizational Chart Templates
Related Solution:
ConceptDraw DIAGRAM is the professional business graphic software for drawing diagrams and charts with great visual appeal on Mac OS X.
Picture: The Best Drawing Program for Mac
Related Solution:
ConceptDraw lets you express your professional accomplishments in a simple, but compelling personal infographics and visualizations.
Picture: Tools for Creating Infographics and Visualizations
Use ConceptDraw DIAGRAM software as a powerful audit application. 🔸 Create professional Audit Workflow Diagrams and Audit Process Flowcharts to ✔️ plan and implement audit process, ✔️ enhance financial transparency, ✔️ improve financial reporting, ✔️ streamline operations, ✔️ improve business efficiency, ✔️ identify risks and issues, ✔️ prevent financial fraud, ✔️ track progress, ✔️ enhance trust
Picture: Understanding the Audit Process: A Comprehensive Guide. Audit Process Flowchart
Related Solution:
Analysis is very important part for every business, as it helps to understand the weakness and to see the opportunities, and SWOT is one of the most effective tools. To illustrate the multifunctionality of this tool, let’s imagine a SWOT sample in area of computers networking, which can be carried out to realize the pros and cons of some equipment, for example. Even a network topology or a administer can be a subject for this analysis.
This SWOT analysis matrix illustrate the sample of using this useful technique for comprehension of Strengths and Weaknesses, and for determining the Opportunities open to business and the Threats it encounters. Used in a business scope, it will help to create a perspective niche in the market for particular business. The ConceptDraw SWOT and TOWS Analysis solution gives a lot of templates of both SWOT and TOWS matrices that allow managers and marketers create custom diagrams to perform SWOT or TOWS analysis in context of a particular business.
Picture: SWOT Sample in Computers
Sentence a grammatical unit of several words, and provides a narrative, question, comment, etc. It begins with a capital letter and ends with proper punctuation. Sentence diagramming allows you to visually present the sentence part function, which helps you build right sentences. Language Learning solution offers the Sentence Diagrams Library with set of vector stencils for drawing various Sentence Diagrams, for visualizing grammatical structures that will assist you in language learning and construction of grammatically correct sentences. ConceptDraw DIAGRAM diagramming software extended with Language Learning solution from the Science and Education area provides the powerful sentence diagraming tools.
Picture: Sentence Diagrammer
Related Solution:
What is organizational charts and why your business need them? How to use business process diagram software? Explore how advanced organization chart software transforms the way companies ✔️ visualize, ✔️ communicate, and ✔️ streamline their organizational hierarchies
Picture:
What is an Organizational Chart and how it works?
Organization Chart Software
Related Solution:
An architectural design is a technical drawing of a building. Creating of the architectural design is the important part in the architecture and building. It is a way for the architects to represent their ideas and concepts, to develop the design idea to the concrete proposal. It' very convenient for architects to create the architectural design using the computer software.
СonceptDraw DIAGRAM is a powerful CAD drawing software. Using the Floor Plans Solution from the Building Plans area of ConceptDraw Solution Park you can create professional looking architectural designs quick, easy and effective.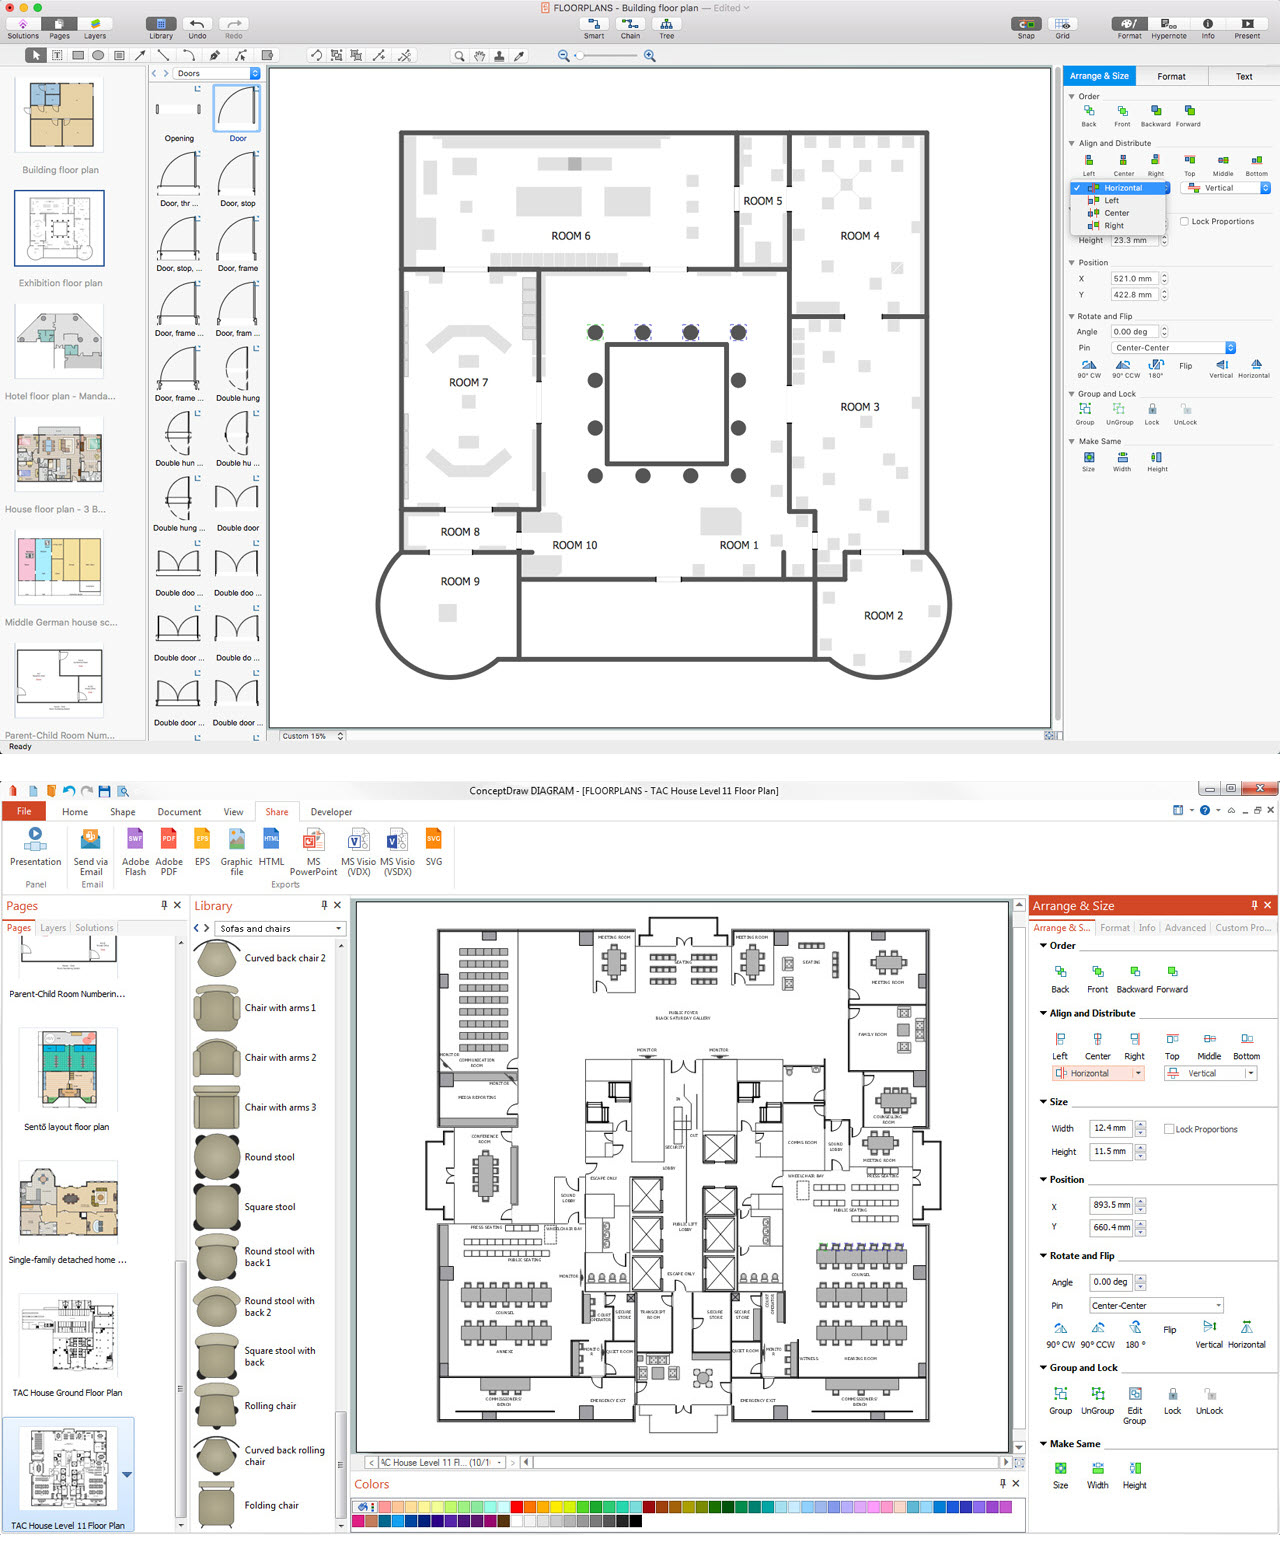
Picture: CAD Drawing Software for Architectural Designs
Related Solution:
No need for any special drawing skills to create professional looking diagrams outside of your knowledge base. ConceptDraw DIAGRAM takes care of the technical details, allowing you to focus on your job, not the drawing..png)
Picture: Create Professional Looking Diagrams
Biology solution offers 3 libraries of ready-to-use predesigned biology symbols and vector clipart to make your biology drawing and biology illustration making fast and easy: Carbohydrate Metabolism Library, Biochemistry of Metabolism Library, Citric Acid Cycle (TCA Cycle) Library.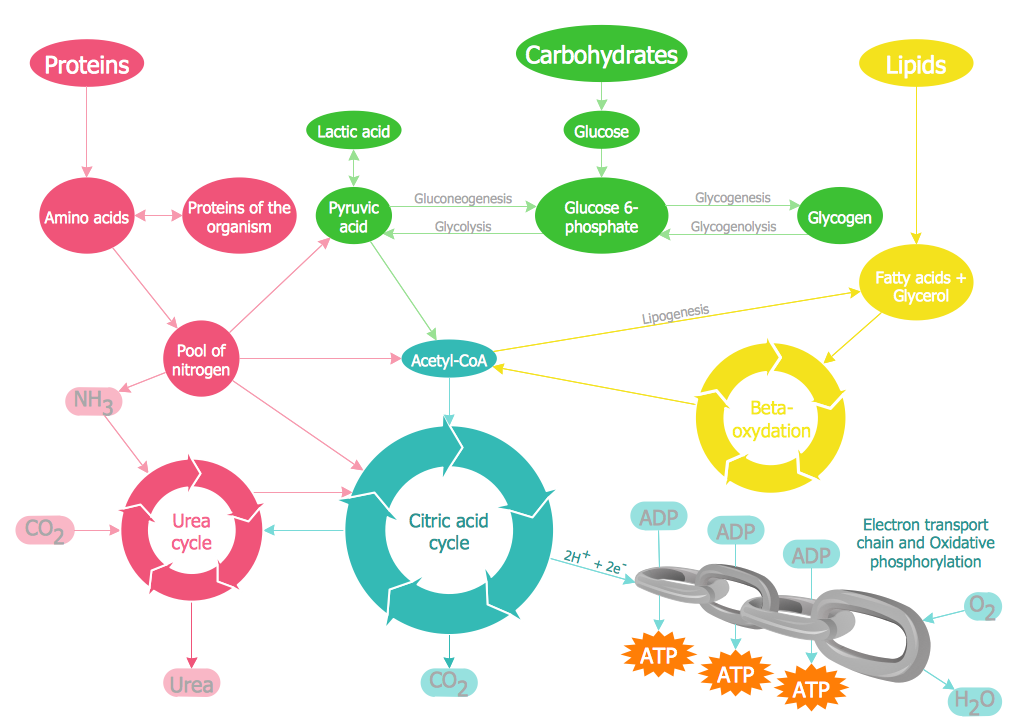
Picture: Biology Illustration
Related Solution:

