
Example 1. Sample Project Flowchart. The architecture of Exception Translation
This example was redesigned from the Wikimedia Commons file: JSET_Overview.jpg. [commons.wikimedia.org]
This sample shows the Flowchart that displays the architecture of SQL Exception Translation.
“There are mechanisms in which you can translate a SQL exception to the corresponding business exceptions. This is known as SQL Exception Translation. jSET - The SQL Exception Translator is one such tool. Currently this tool is Java-based.” [from Wikipedia]
You can see on this Flowchart the geometric figures that represent the steps of the process and are connected with arrows that show the sequence of the actions. The Flowcharts diagrams are widely used for designing, documenting, analyzing and managing the complex processes and programs in various fields such as science, business, engineering, architecture, manufacturing, administration, etc.
Using the ready-to-use predesigned objects, samples and templates from the Flowcharts Solution for ConceptDraw DIAGRAM you can create your own professional looking Flowchart Diagrams quick and easy.
The Flowcharts produced with ConceptDraw DIAGRAM are vector graphic documents and are available for reviewing, modifying, and converting to a variety of formats (image, HTML, PDF file, MS PowerPoint Presentation, Adobe Flash or MS Visio).
See also Samples:
TEN RELATED HOW TO's:
ConceptDraw DIAGRAM diagramming and vector drawing software offers the Marketing Diagrams Solution from the Marketing Area with extensive drawing tools, predesigned vector shapes, templates and samples for fast and easy drawing marketing charts and diagrams, marketing schemes and flow charts, various marketing illustrations, etc.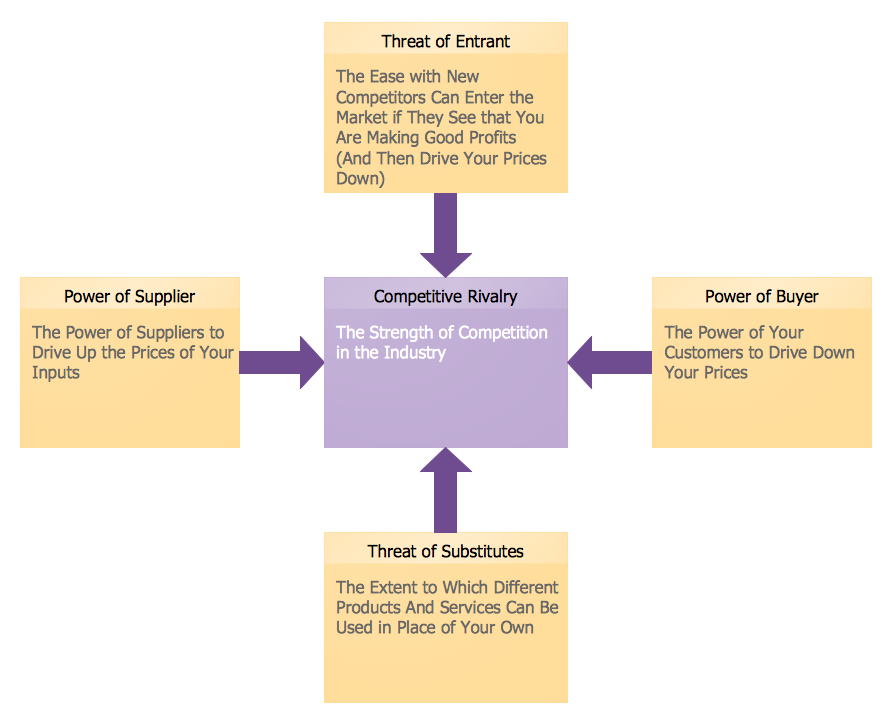
Picture: Marketing Charts
Related Solution:
Big and complex projects sometimes need some simplification of plans and schedules. That's why Program Evaluation and Review Technique was invented and first implemented in 1958. You can create PERT diagrams effortlessly with ConceptDraw DIAGRAM and share them with your colleagues.
Program Evaluation Review Technique (PERT) is a method that is used to assess and analyze projects. PERT is a valuable tool for the project management practice. PERT gives an assessment and analysis of the time needed to the project completion. A PERT chart is a visual tool that delivers a graphical view of a project timeline. It is used to display the sequences and dependences of project tasks necessary to complete a project. ConceptDraw DIAGRAM delivers the possibility to build a PERT along with other diagrams applied to assist management process by using its Seven Management and Planning Tools solution.
Picture: Program Evaluation and Review Technique (PERT) with ConceptDraw DIAGRAM
Related Solution:
ConceptDraw PROJECT’s powerful reporting engine lets you generate a set of tabular reports with just one click, or visualize your project as Radial Tasks Structures, Work Breakdown Structures and Resource Calendars. It also provides you with dynamic Project Dashboards.
Picture: How to Report Task's Execution with Gantt Chart
This sample shows the Flowchart that displays the process of the achievement the consensus, in other words solving for the acceptable solution.
This Flowchart has start point. The rectangles on it represent the steps of the process and are connected with arrows that show the sequence of the actions. The diamonds with yes/no shows the decisions. The Flowcharts are widely used in marketing, business, analytics, government, politics, engineering, architecture, science, manufacturing, administration, etc.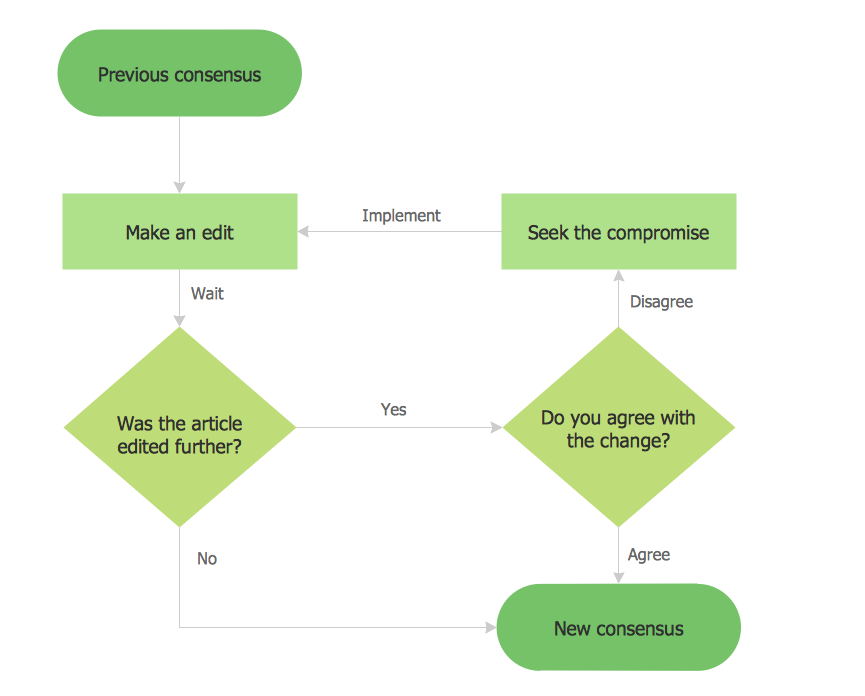
Picture: Example Basic Flowchart. Flowchart Examples
Related Solution:
This sample shows the Flowchart of the testing the work of the lamp and decision making about what to do to lamp will work.
Picture: Samples of Flowchart
Related Solution:
All Gantt charts were made using ConceptDraw PROJECT. ConceptDraw PROJECT works both on Windows and Mac OS X. It allows to schedule a voluntary number of projects in a single Workspace document and lets easily share tasks and resources among them. ConceptDraw PROJECT shares files among Windows and Mac OS X.
Picture: Gantt chart examples
Project progress on web: delivering project status to remote teams and stakeholders via Skype.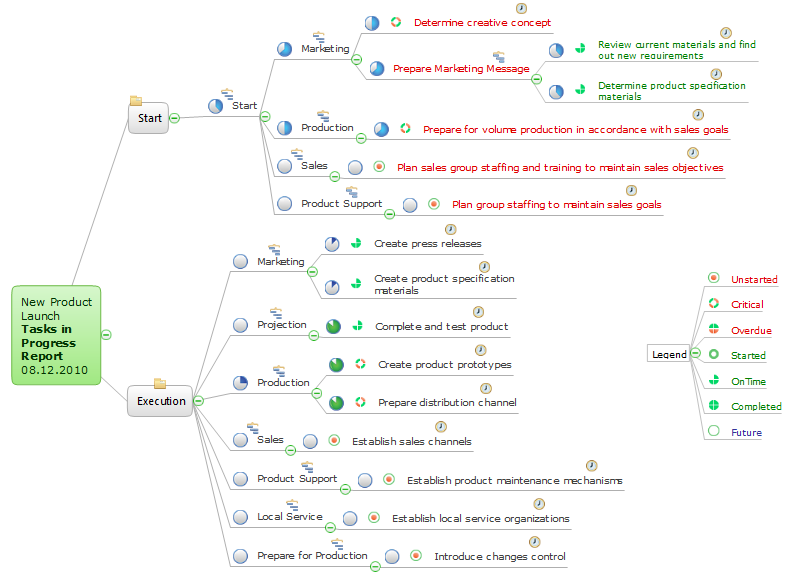
Picture: How To Show Project Progress Peport on Web
Related Solution:
Create your own flow charts of computer or network system account processing using the ConceptDraw DIAGRAM.
Picture:
Account Flowchart
Flowchart Examples
Related Solution:
This sample shows the concept of working of the transport company and is used by transport companies, carriers at the transportation of various goods.
Picture: UML Class Diagram Example for GoodsTransportation System
Related Solution:
Create bar graphs for visualizing economics problem solving and financial data comparison using the ConceptDraw DIAGRAM diagramming and vector drawing software extended with the Bar Graphs Solution from the Graphs and Charts area of ConceptDraw Solition Park.
Picture: Bar Diagrams for Problem Solving.Create economics and financial bar charts with Bar Graphs Solution
Related Solution: