CAD Drawing Software for Making Mechanic Diagram and Electrical Diagram Architectural Designs
CAD (Computer-aided design) software is used for improvement the quality of design and the productivity of the designer, for creating the database for manufacturing. Computer-aided design is used in many fields: in mechanical and industrial design, in designing electronic systems and electrical diagrams for architectural design, in automotive, aerospace, shipbuilding industries.
Design and manage household or business electrical systems using these libraries. Map out anything from ambient lighting to audio systems to switch layouts.

Pic 1. Electrical Symbols (6 stencil libraries containing 334 vector objects)
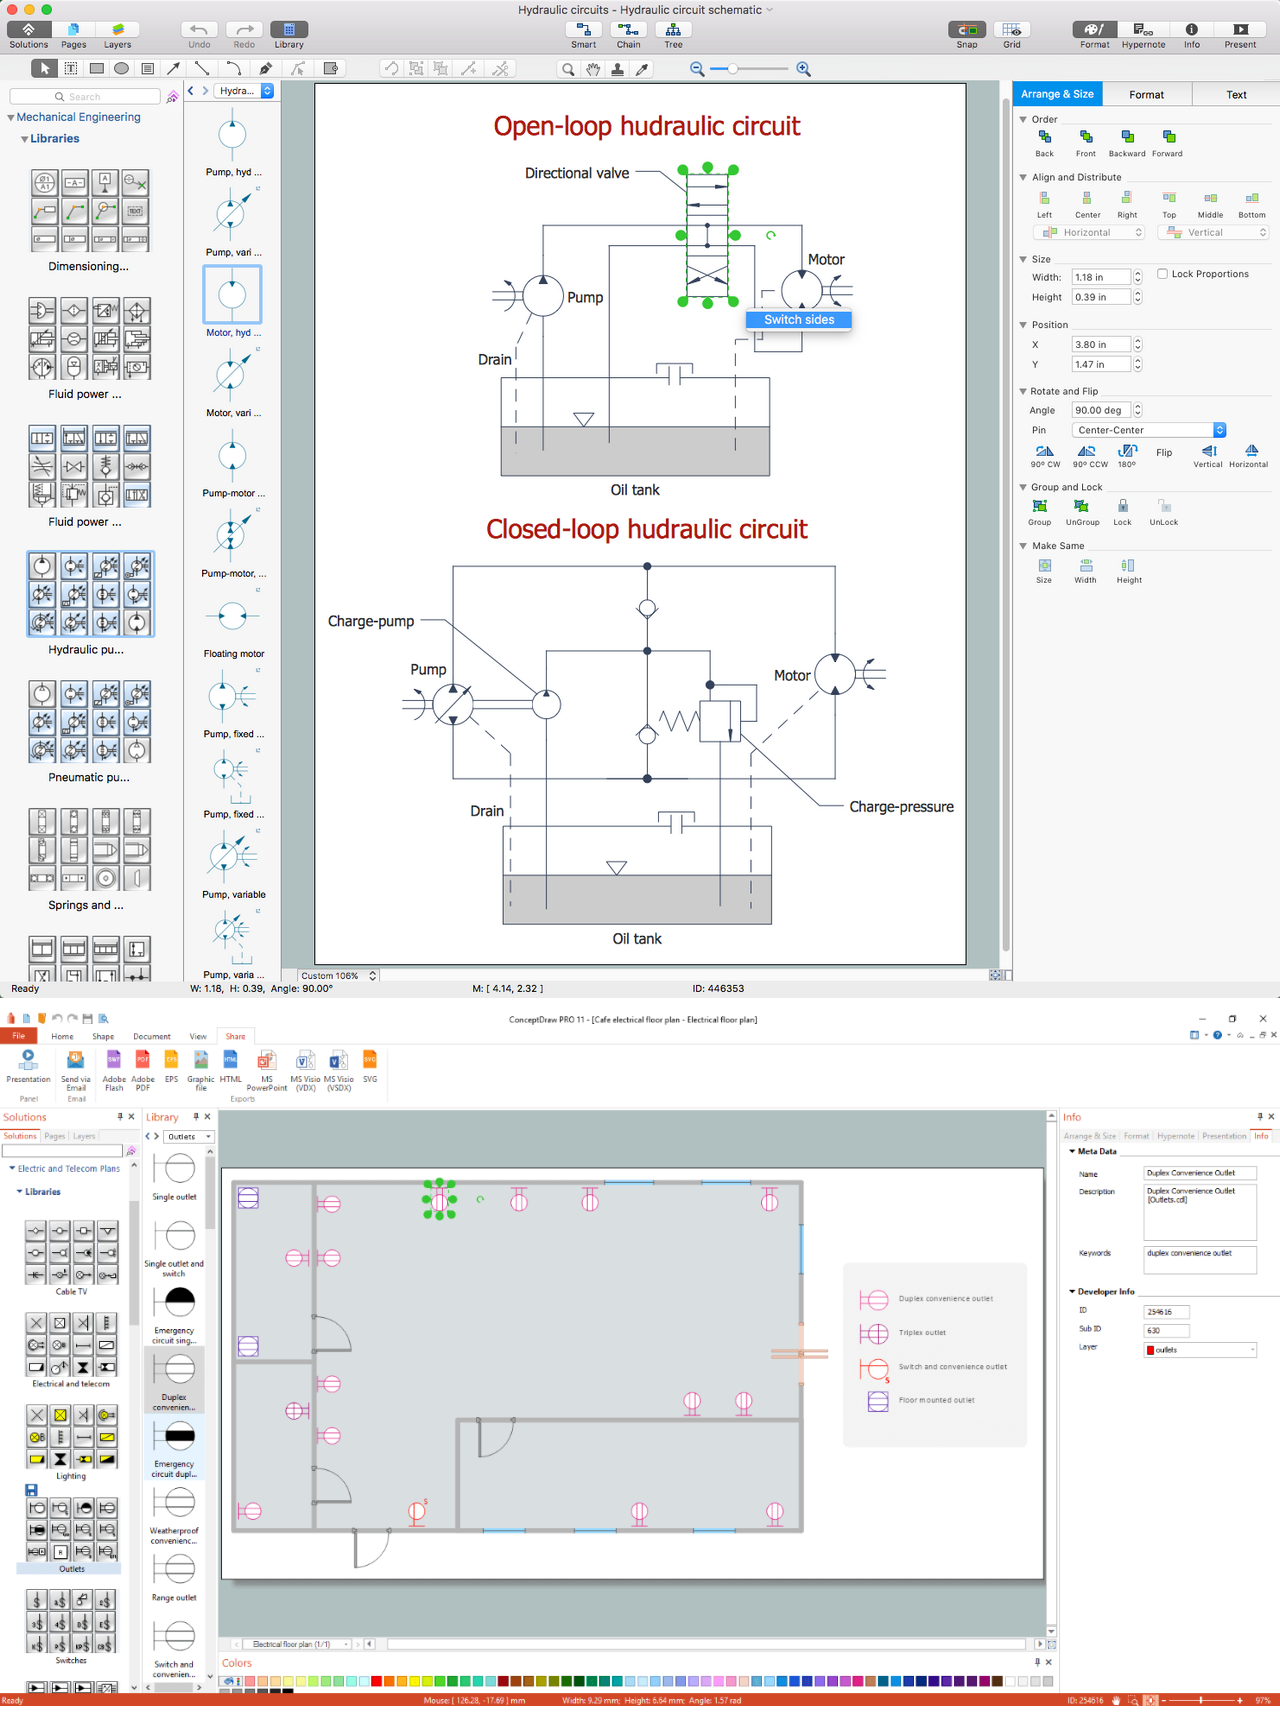
Use these libraries to create professional mechanical engineering documents, with elements relating to valve assembly, pumps and motors, dimensioning and tolerance, bearings, and welding.

Pic 2. Mechanical Symbols (9 stencil libraries containing 602 objects)
СonceptDraw DIAGRAM is powerful CAD drawing software. Using the libraries with vector objects, templates and samples you can create professional mechanic and electrical diagrams for architectural design quick, easy and effective.
Pic 3. ConceptDraw DIAGRAM software for making mechanic and electrical diagrams for architectural design
The mechanic and electrical diagrams of any complexity created with ConceptDraw DIAGRAM are vector graphic documents and are available for reviewing, modifying, and converting to a variety of formats (image, HTML, PDF file, MS PowerPoint Presentation, Adobe Flash or MS Visio).
NINE RELATED HOW TO's:
Bubble diagrams solution extends ConceptDraw DIAGRAM software with templates, Using ConceptDraw Connectors, you can create a bubble chart in moments.
Using ConceptDraw you will be able to create a bubble chart from the ready ConceptDraw library objects or make your own objects. The created diagram can represent ideas organization, in brainstorming processes, by teachers for explaining difficult ideas or for presentations.
Picture: How To Create a Bubble Chart
Related Solution:
The Building Plans area of ConceptDraw Solution Park includes a set of solutions of Interior Design. The Interior Design solutions for ConceptDraw DIAGRAM allow you simply and quickly create the professional looking Building Plans that will help you to design, redesign your room, flat, home, office, cafe or any other building. Having the ready plan of the rooms you can easy rearrange the furniture, interior objects on the plan and see the future result at once.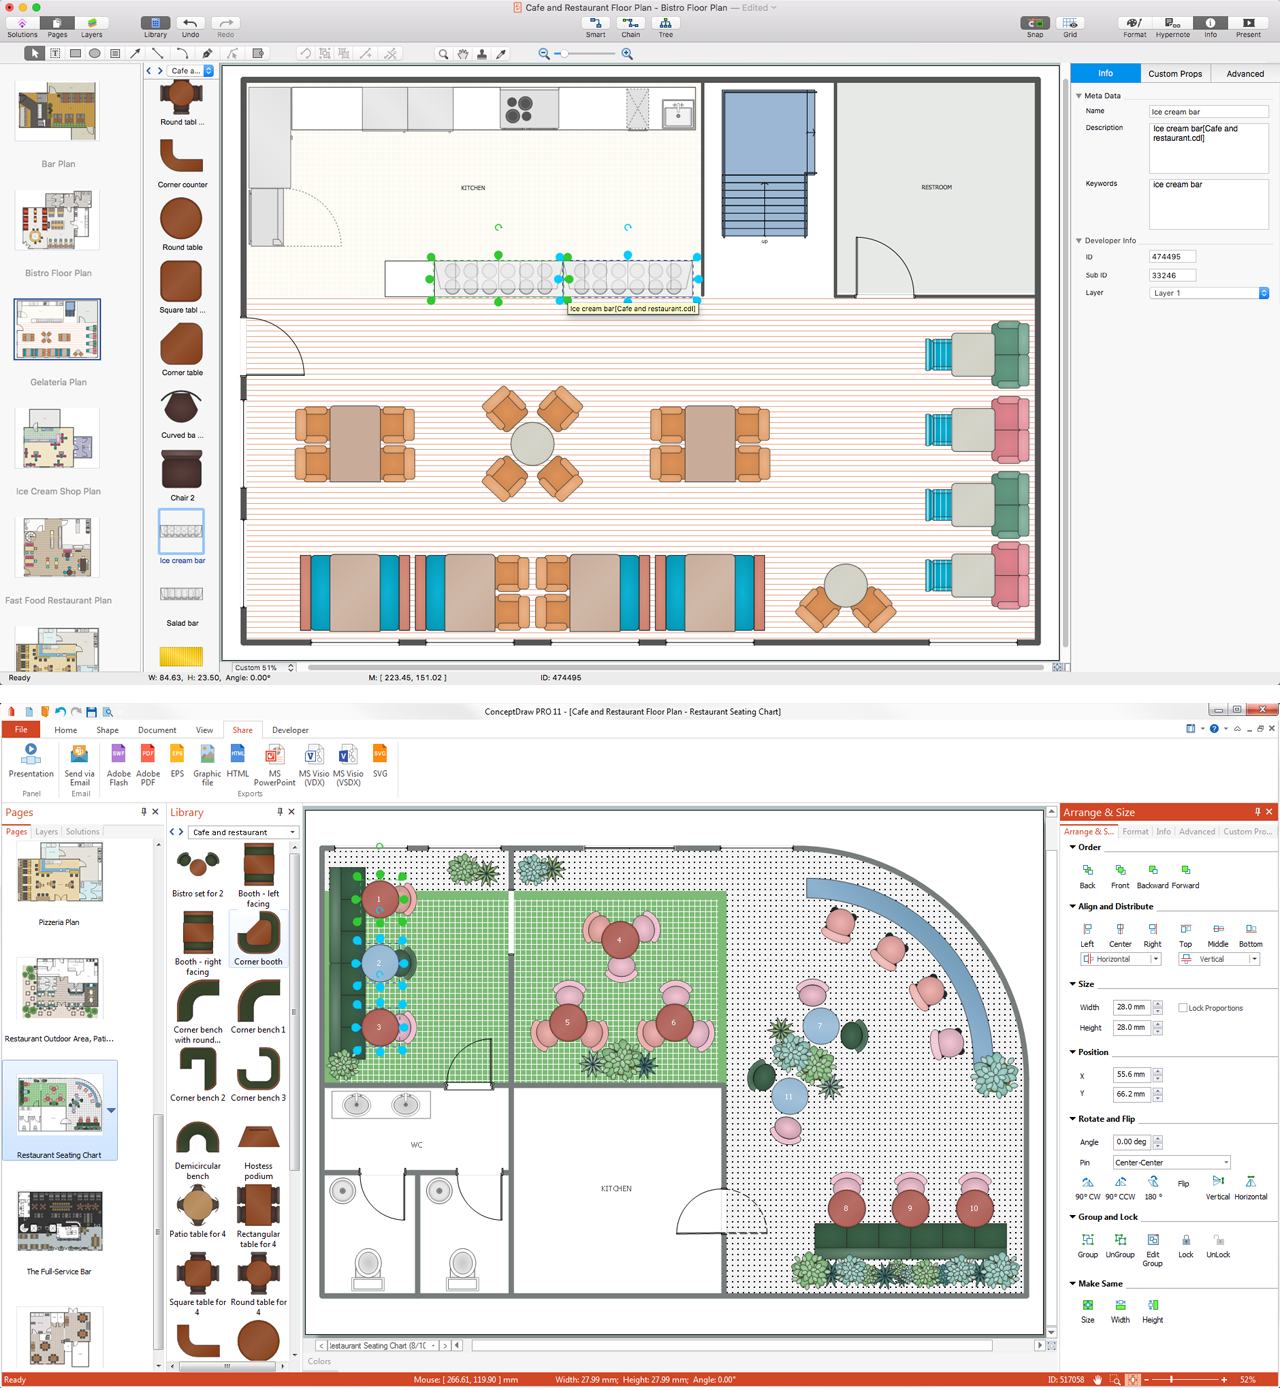
Picture: Interior Design Software. Building Plan Examples
Related Solution:
It’s a challenge for any administer to set a brand new corporate network. Talking about network parameters, we should mention that network layout is important for network efficiency and reliability. After the budget is accepted, you need to make a network topology draft.
The diagram of computer network layout is a tool of IT specialists and corresponding departments of diversified organizations. Also the responsibilities of any network or system administrator include making network layout diagrams, since they are important piece of any network documentation package. ConceptDraw solution for networking and diagramming offers more than 1000 vector object, composed into the 40 libraries that are designed to to getting started with making professional network layout diagrams.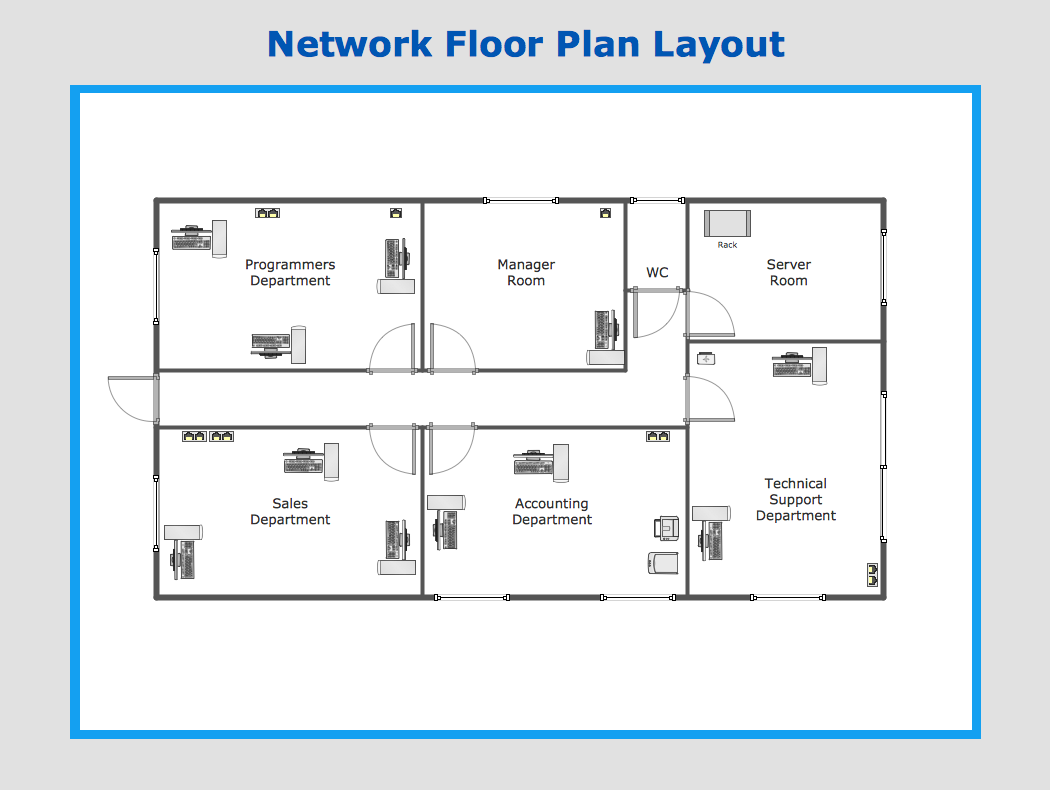
Picture: Network Layout
Creating a detailed network plan can cause a lot of headache to an unexperienced user. And it is worth mentioning that ConceptDraw DIAGRAM is a decent tool for creating a network diagram, a tool that is easy-to-use. To get an accurate diagram use the vector shapes from the special libraries that represent workstations, network appliances, wiring systems and connect them with smart-connectors, just as simple as that.
This communication network diagram displays the way different components of a computer network communicate with each other. When representing network information, such as depicting all the equipment in a large network, it is helpful to make visual representation. Network diagram provides an easy way to show the way the connections between an equipment in a large network. This diagram of a communication network depicts a network composed of three sub-networks. It uses a network equipment symbols to represent the different devices that make up a network communication including routers, Ethernet devices and end-point equipment.
Picture: ConceptDraw DIAGRAM Network Diagram Tool
Related Solution:
Netflow is a network protocol used for accounting the IP network traffic. It was developed by Cisco Systems. Now it is actually the industrial standard, it is supported by many devices. There are several versions of the protocol, but the most common are the versions 5 and 9.
This diagram was created in ConceptDraw DIAGRAM using the Computer and Networks Area of ConceptDraw Solution Park and shows the Netflow architecture.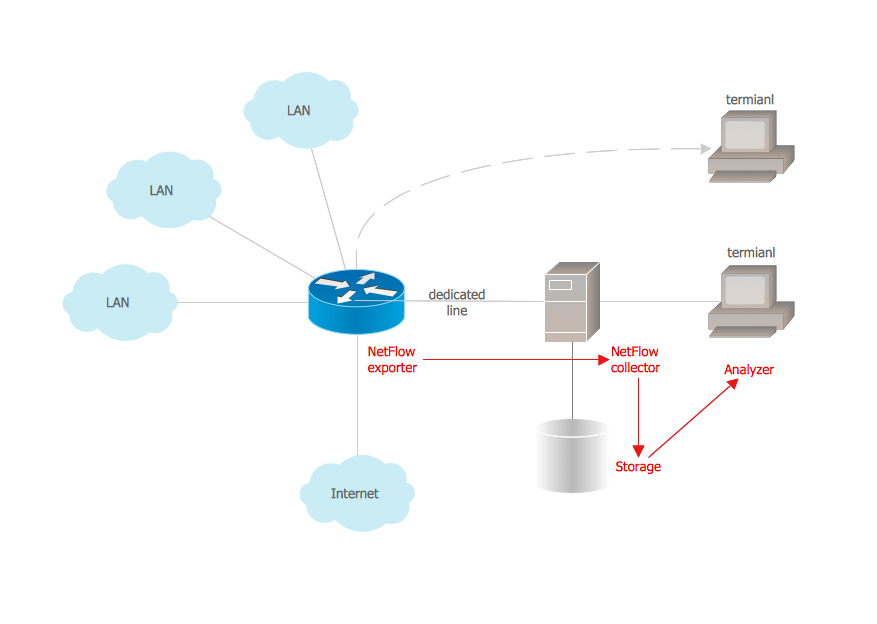
Picture: Netflow architecture. Computer and Network Examples
Related Solution:
Plumbing systems are very important for any manufacture, and it's a good practice to have a clear scheme of that system. To create one, you should use a piping and instrumentation diagram software with a possibility to save files in vector format, so you can print them without quality loss. ConceptDraw DIAGRAM is a great tool for creating diagrams, and you don't need to be very experienced to use it efficiently.
This example of Piping and Instrumentation Diagram (P&ID) depicts a scheme that illustrates the physical sequence and functional communications of piping, instrumentation and plumbing equipment components of a typical food trailer.
Seeking to avoid health troubles in a mobile food service , the plumbing demands for food trailers must be considered accurately. This P&ID shows all of piping including a basic set of piping system components along with multiple sinks, extra water heaters and other elements to meet health guidelines.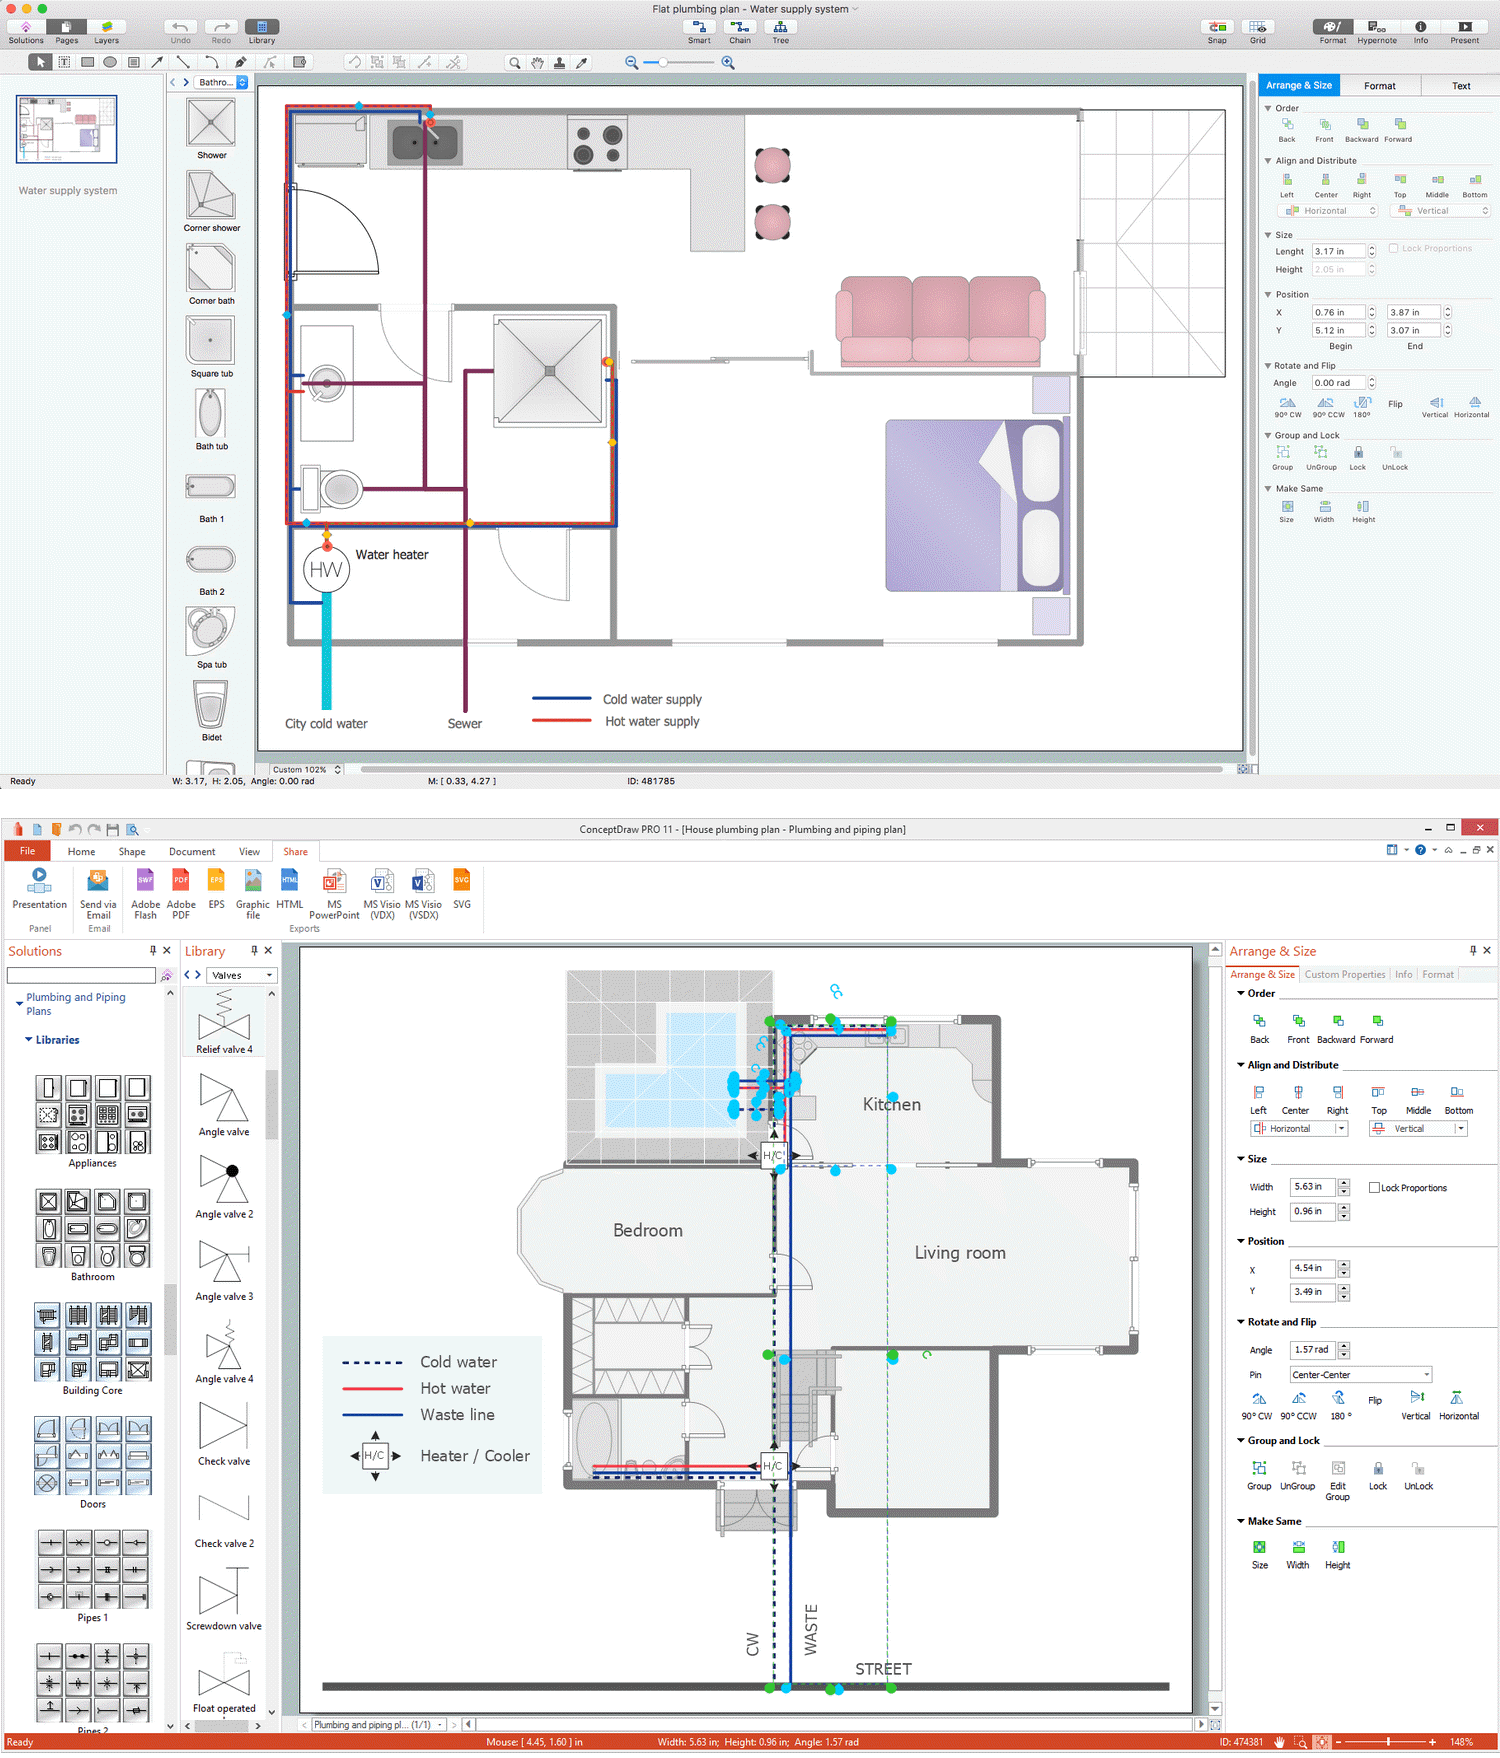
Picture: Piping and Instrumentation Diagram Software
Related Solution:
Electronic components have two or more electrical terminals (or leads) aside from antennas which may only have one terminal. These leads connect to create an electronic circuit with a particular function (for example an amplifier, radio receiver, or oscillator). Basic electronic components may be packaged discretely, as arrays or networks of like components, or integrated inside of packages such as semiconductor integrated circuits, hybrid integrated circuits, or thick film devices.
26 libraries of the Electrical Engineering Solution of ConceptDraw DIAGRAM make your electrical diagramming simple, efficient, and effective. You can simply and quickly drop the ready-to-use objects from libraries into your document to create the electrical diagram.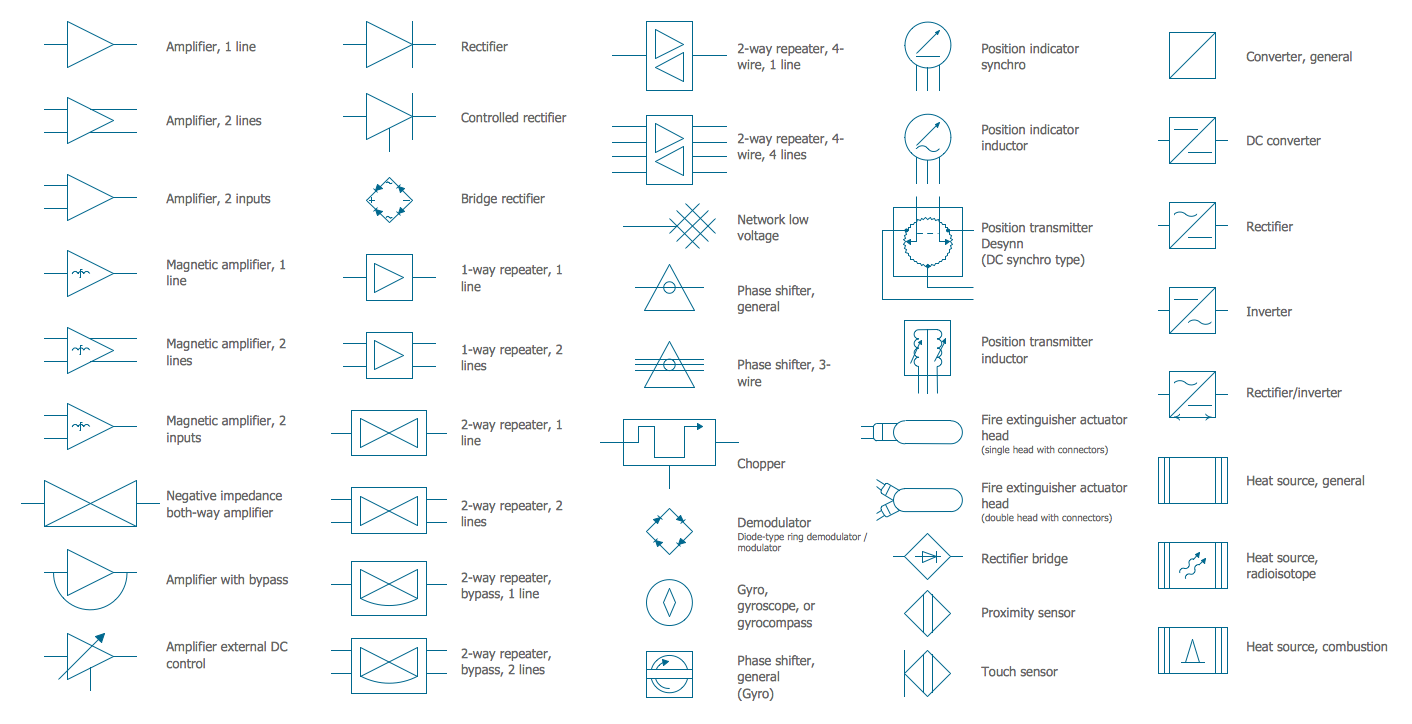
Picture: Electrical Symbols — Composite Assemblies
Related Solution:
Decision Making - ConceptDraw OFFICE suite provides visual tools that are given support on the stage of the decision making.
The Seven Management and Planning Tools is a set for such diagrams: Affinity Diagram, Relations Diagram, Prioritization Matrix, Root Cause Tree Diagram, Involvement Matrix, PERT Chart, Risk Diagram (PDPC).
Picture: Decision Making
This sample was created in ConceptDraw DIAGRAM diagramming and vector drawing software using the Flowcharts solution from the Diagrams area of ConceptDraw Solution Park.
This sample shows the Flowchart that displays the procedures of 2PP (two-party preferred) voting and counting the voters. The two-party-preferred vote is the result of the elections that was distributed to the final two parties.
Picture: Basic Flowchart Images. Flowchart Examples
Related Solution:

