Diagramming software for Amazon Web Service
diagrams, charts and schemes
ConceptDraw DIAGRAM is universal diagramming software extended with ConceptDraw Solution Park’s solution for AWS Architecture diagramming.
Here are few screens to convey the idea of what kind of diagramming tools and icons set provided with ConceptDraw. This is professional tool for general system design and architecture, the AWS diagramming is part of it.
The whole set of ConceptDraw tools can be used much wider for system design and visualization in daily work of system architect. ConceptDraw software is mac and pc compatible. To learn more about ConceptDraw Solution Park please visit intros and video tutorials for each specific solution. How to draw diagrams - this is boxes and arrows, smart connectors which flows around objects and keeps wires always connected, libraries of special signs, symbols and icons, styles and themes.
Plus, extentions from ConceptDraw Solution Park: growing collection of solutions for system design and architectures using all standarts.
ConceptDraw software is mac and pc compatible.
TEN RELATED HOW TO's:
Data base diagrams describes inter-related data and tables. It describes roles and relationships, internal and external dependencies, data exchange conventions and structures of knowledge domain.
ConceptDraw Software provides number of data-base chart libraries including major 49 vector symbols. Use these DFD flowchart symbol libraries to design data-base structure and models, use it to design data base process-oriented models, or simple data-oriented models. The are special drawing tools for making data flowcharts, data process diagrams, structured analysis diagrams, and information flow diagrams.
Picture: Database Flowchart Symbols
Related Solution:
Business graphic applications show a special knowledge representations and include many features for creating schematic pictures. These graphic tools are known as flowchart maker or flowchart maker software.
Picture: Flowchart Maker
Related Solution:
The purchasing process follows very specific guidelines and includes a purchasing cycle flowchart and receiving process flow chart. Common key elements of purchasing process.
It is important to know how purchasing processes work and how each operation is done.
Picture: Purchase Process Flow Chart,Receiving Process Flow Chart,Accounting Flowchart Example.
Related Solution:
There are many ways to describe a database structure. One of the most usual is to draw an entity relationship diagram (ERD) using a Crow’s Foot notation to represent database elements. If you don’t want to draw it on paper, you should use an appropriate software.
An entity-relationship (ER) diagram is used to show the structure of a business database. ERD represents data as objects (entities) that are connected with standard relationships symbols which Illustrate an association between entities. ERD, there is a wide range of ERD notations used by data bases architects for reflecting the relationships between the data entities. According to the crow’s foot notation relationships are drawn as single labeled lines designating a certain kinds of relationship. Crow foot notation is a most frequently used ERD standard, because of improved readability of diagrams, with a more accurate use of space on the page._Win_Mac.png)
Picture: Entity Relationship Diagram - ERD - Software for Design Crows Foot ER Diagrams
Related Solution:
The kitchen is one of the important places of the house, and so the kitchen planning is a very responsible moment. The kitchen must be comfortable, convenient, harmonious and aesthetic.
ConceptDraw DIAGRAM vector drawing software offers the Floor Plans Solution from the Building Plans area of ConceptDraw Solution Park to help you create professional looking Kitchen Plans of any complexity.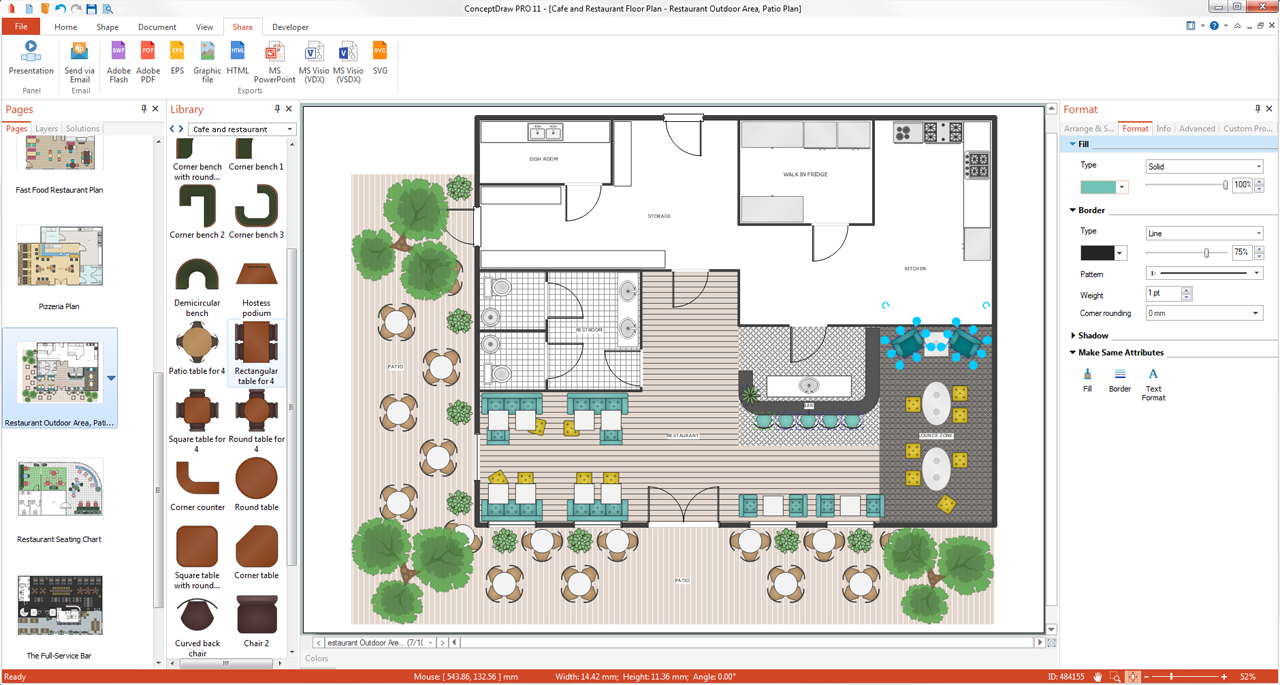
Picture: Kitchen Planning Software
Related Solution:
ConceptDraw DIAGRAM contains spatial infographics samples, map templates to be filled in, and libraries of vector stencils for main design elements of spatial infographics.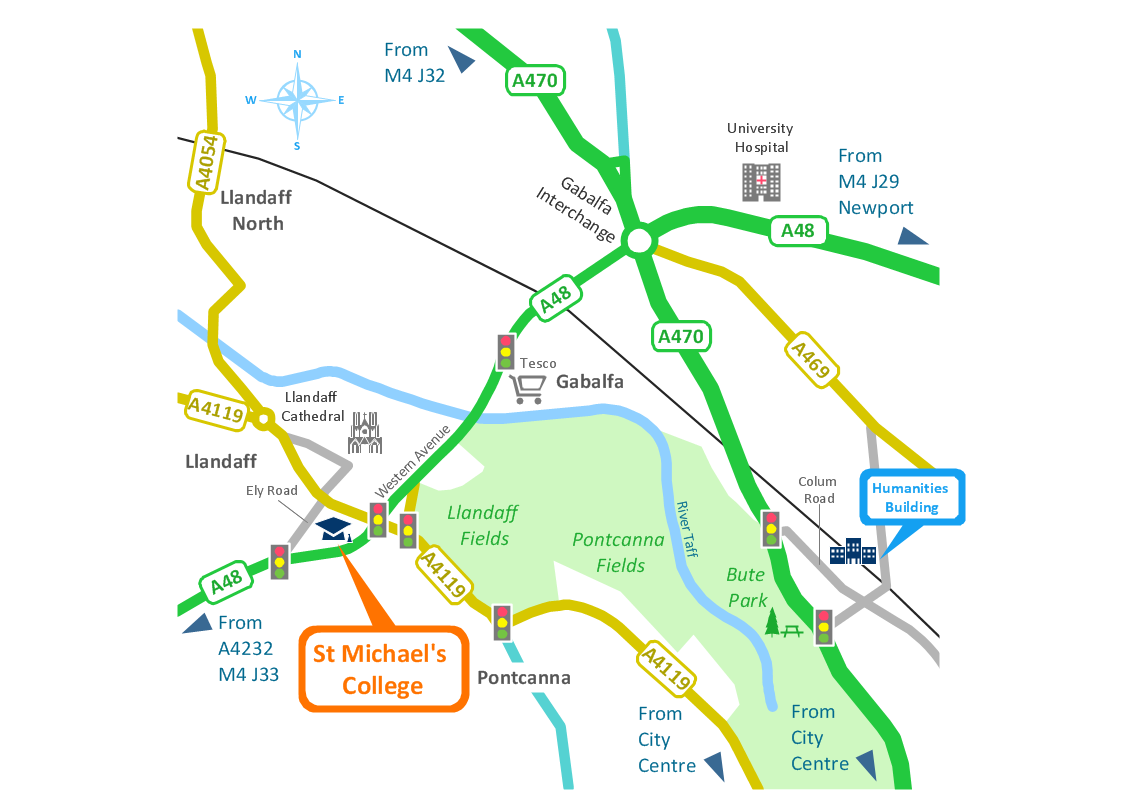
Picture: Brilliant Examples of Infographics Map, Transport, Road
Any business process consists from a number of tasks carrying out the certain business goal. It is useful to diagram business processes to ensure that they are as foolproof, logical and sequential as possible. This business process diagram describes a typical booking process flow by the example of a cab booking process. It can be used as a roadmap for any booking system implementation. Diagramming a business process allows you to look at the entire project and take into account all types of possible scenarios. Business process diagram helps you investigate and clarify the process thoroughly so that you can find out how it can be improved. Business process diagram supports team communications by ensuring that each process element is clear and everyone in the team is on the same page.
Sometimes your company brings you less profit than you expect it to be, and it’s difficult to reveal the causes. Maybe it’s time to learn new technologies, because business diagram are easily developed by means of special software, so you won’t make any extra effort. In return, you will increase your productivity and get more done in a less time.
Picture: Business Diagram Software
Related Solutions:
ConceptDraw DIAGRAM enhanced with Audit Flowcharts solution from the Finance and Accounting area of ConceptDraw Solution Park is a powerful diagramming and vector drawing software for designing professional looking Chart Audit of any complexity.
Chart Audit is incredibly convenient for representing important information about audit process and audit planning process. It also helps auditors to define the problem areas and to elaborate the ways of their solving and effectiveness improvement.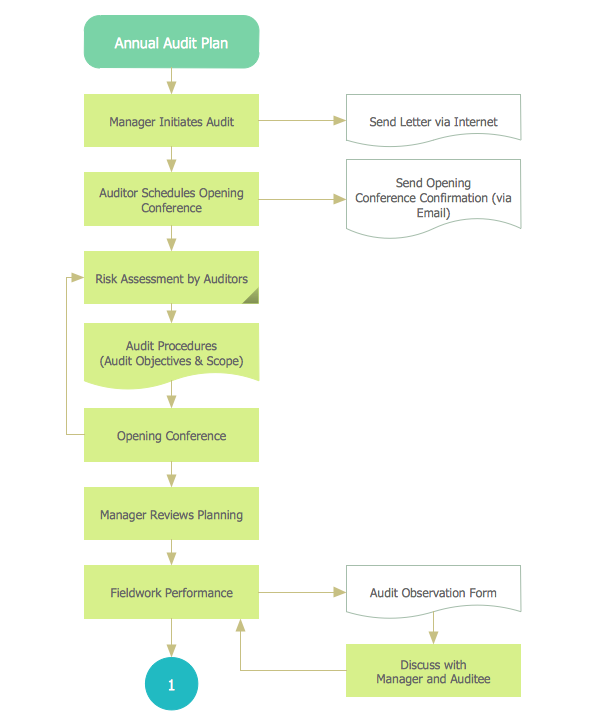
Picture: Chart Audit
Related Solution:
ConceptDraw DIAGRAM diagramming and vector drawing software extended with Flowcharts Solution from the 'Diagrams' area of ConceptDraw Solution Park is a powerful tool for drawing Flow Charts of any complexity you need. Irrespective of whether you want to draw a Simple Flow Chart or large complex Flow Diagram, you estimate to do it without efforts thanks to the extensive drawing tools of Flowcharts solution, there are professional flowchart symbols and basic flowchart symbols. This sample shows the Gravitational Search Algorithm (GSA) that is the optimization algorithm.
Picture: Simple Flow Chart
Related Solution:
IT world is extremely rational and logical. So what can be more precise than Software Diagrams to rate the results of work? Visual statistics is the best way to understand the data.
This figure demonstrates the data flow diagram (DFD), which was created to describe the electronic system of custom purchase. This is the process of buying using electronic bar code scanning system. Such systems are used in large stores. The cashier scans the bar code, the system outputs the data on the price of the goods and carries out a purchase process. This DFD utilizes the Gane/Sarson notation. To create it The ConceptDraw DFD solution has been applied.
Picture: Software Diagrams
ConceptDraw
DIAGRAM 18