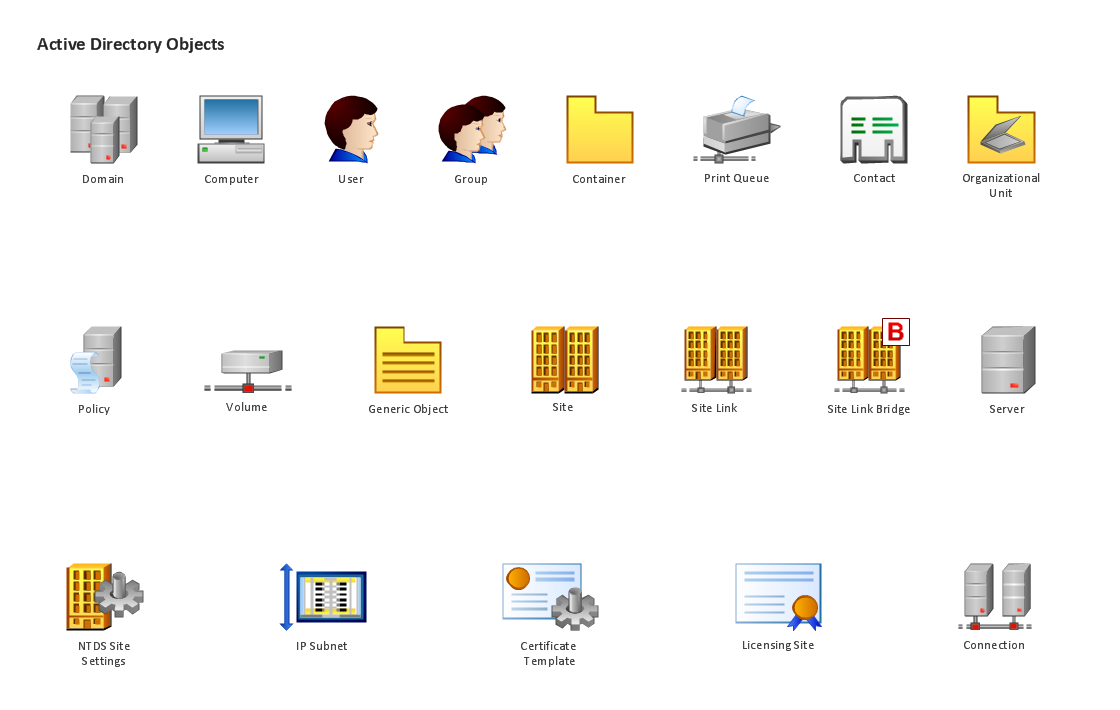
Pic.1. Design Elements — Active Directory (macintosh, windows)
for Network Diagrams
ConceptDraw solution Computer and Networks provides 4 libraries of vector stencils for drawing the Active Directory network diagrams: Active Directory Objects, Active Directory Sites and Services, Exchange Objects and LDAP Objects.
Use these libraries of design elements to draw network diagrams of Microsoft Windows networks, Active Directory Domain topology, Active Directory Site topology, Organizational Units (OU), Exchange Server Organization.
TEN RELATED HOW TO's:
Cisco Network Diagrams solution from the Computer and Networks area of ConceptDraw Solution Park provides 14 libraries with 450 ready-to-use predesigned vector objects that can be used for quickly and easily drawing the professional Cisco Network Diagrams.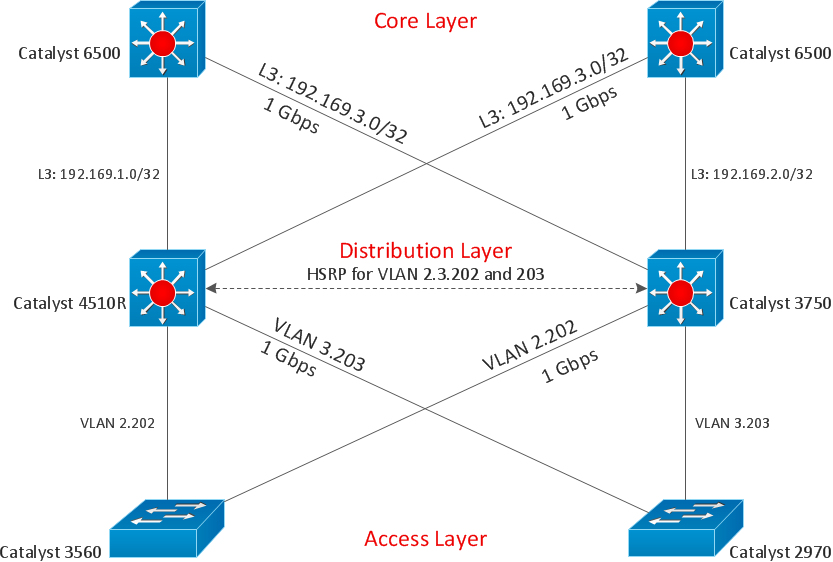
Picture: Cisco Design
Related Solution:
ConceptDraw DIAGRAM is perfect for software designers and software developers who need to draw Computer and Network Diagrams._Win_Mac.png)
Picture: Network Diagramming Software for DesignComputer and Network Diagrams
Special libraries of highly detailed, accurate shapes and computer graphics, servers, hubs, switches, printers, mainframes, face plates, routers etc.
Picture: Network Printer
A flowchart is a powerful tool for examining processes. It helps improving processes a lot, as it becomes much easier to communicate between involved people, to identify potential problems and to optimize workflow. There are flowcharts of different shapes, sizes and types of flowchart vary from quite basic process flowcharts to complex program flowcharts. Nevertheless, all these diagrams use the same set of special symbols like arrows to connect blocks, parallelogram to show data receiving or rectangles for showing process steps.
Basic flowcharts are used to represent a simple process algorithm. A basic flowchart notation consists of rectangles (business processes), arrows (the flow of information, documents, etc.). The same notation is used in items such as the "decision", which allow you to do the branching. To indicate the start of the entire business process and its termination can be used the "Terminator" element. The advantages of Basic Flowchart are simplicity and clarity. With it you can quickly describe the business process steps. Creating of Basic Flowchart does not require any special knowledge, as easily understand by employees with different levels of education and IQ.
Picture: Types of Flowchart: Comprehensive Overview
Related Solution:
A network diagram is used to depict the topology of a computer network or, talking more broadly, any telecommunications network in general. In order for a computer network diagram to be understandable, clearly identifiable icons must be used for each network appliance. Cisco network templates, also called Network Topology Icons, is a brand of symbols developed and used by Cisco. Since Cisco Systems is the largest networking company in the world, it's list of networking symbols is widely recognized and exhaustive.
The diagram of the ISG network topology diagram illustrates the Cisco Intelligent Services Gateway. Since Cicso company offers service providers a possibility to provide control of state and resources in a broadband network, network architects and engineers need some facilities to create ISG topology diagrams.This Cisco ISG network diagram was created in ConceptDraw DIAGRAM using its solution for Cisco network diagrams. The vector library of this solution comprises over 500 icons of Cisco hardware and accessories. They can be used to design LAN, WAN, ISG and other Cisco equipped network diagrams.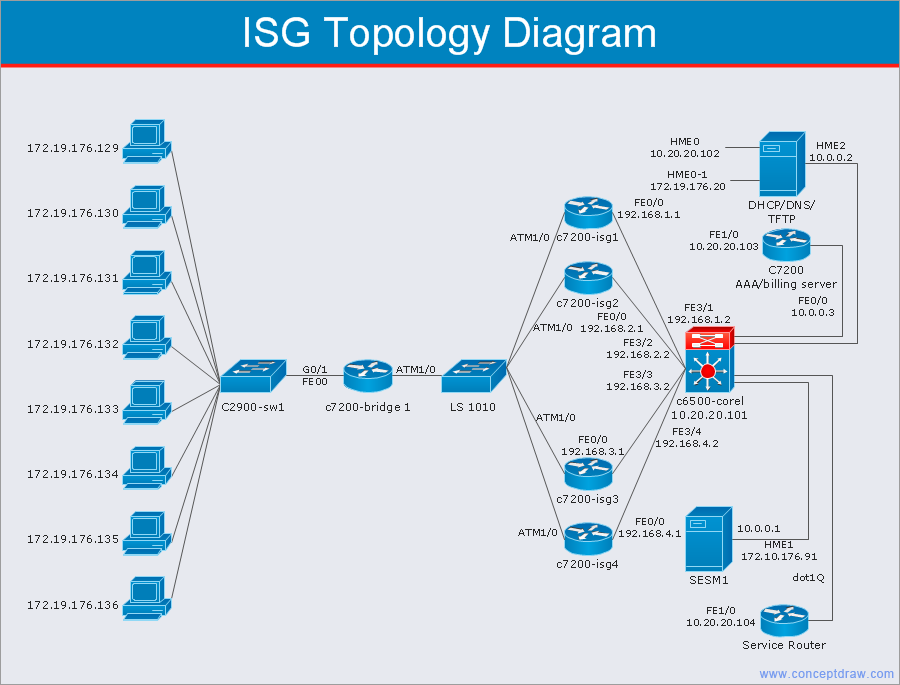
Picture: Cisco Network Templates
Related Solution:
Wireless networking is useful visual tool for identification of all required equipment, and calculation the cost of creating or updating wireless computer networks. ConceptDraw DIAGRAM extended with Wireless Networks Solution from the Computer and Networks Area is the best wireless network diagramming software.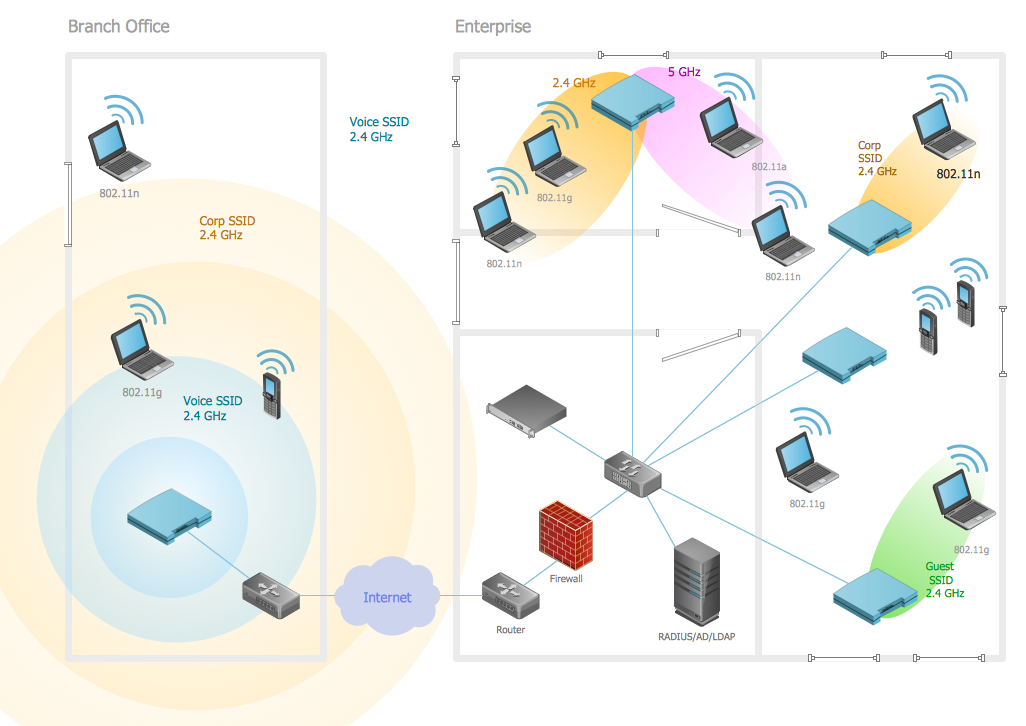
Picture: Wireless Networking
Related Solution:
If you are an advanced diagramming software user, you might use it daily. Traversing the Internet in searching of alternative to MS Visio for MAC and PC, you can fulfill all your requirements with ConceptDraw DIAGRAM. Don’t hesitate to transfer your documents to another operating system.
When looking for a smart and simple tool for business diagrams as alternative to MS Visio for Apple OS X platform, ConceptDraw DIAGRAM certainly is the best choice. Making many kinds of business charts, numerous technical drawings is what ConcepDraw DIAGRAM is the best. One can easy create any diagram and complete it perfectly and quickly. The big collection of vector object libraries, templates and samples, make it the best Microsoft Visio alternative: ConceptDraw DIAGRAM is simpler to use, less expensive, and supports project management and mind mapping methods.
Picture:
In Searching of Alternative to MS Visio for Mac and PC
with ConceptDraw DIAGRAM
Designing your own house sounds exciting at the beginning, but as the time passes, the more you realize there are stumbling blocks. To aid yourself, discover how to use house design software, and develop floor plans, landscape layouts or furniture arrangement plans easily. You can start from altering templates, and you won’t even notice how your designing skills would improve rapidly.
This private country house and landscape plan was created using ConceptDraw Floor Plans solution. Its power set of libraries containing near 700 vector graphic elements enhanced with handy templates is designed, so that an ordinary people can create professional floor plans. Using the stuff, provided by this solution, you can effortlessly design a plan of house, rooms and even backyard layout and landscape. This will save your time and money.This sample plan represents a detailed plan of the private ownership. It defines the apartments layout, the appointment arrangement and even possible location of plants in the garden.
Picture: How To use House Design Software
Related Solution:
It’s a challenge for any administer to set a brand new corporate network. Talking about network parameters, we should mention that network layout is important for network efficiency and reliability. After the budget is accepted, you need to make a network topology draft.
The diagram of computer network layout is a tool of IT specialists and corresponding departments of diversified organizations. Also the responsibilities of any network or system administrator include making network layout diagrams, since they are important piece of any network documentation package. ConceptDraw solution for networking and diagramming offers more than 1000 vector object, composed into the 40 libraries that are designed to to getting started with making professional network layout diagrams.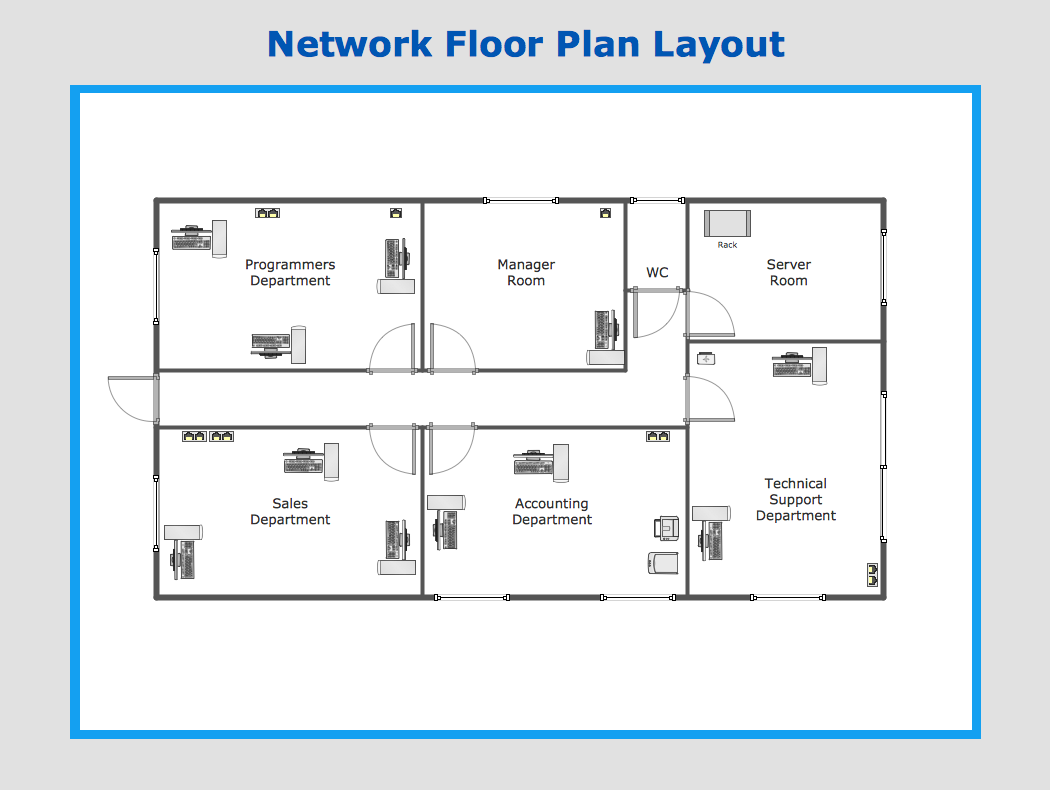
Picture: Network Layout
It's no secret that there is a list of skills that every average system administrator should have. And it's important to be able to manage domains via active directory technologies. The best way to keep all the details in mind is to draw a diagram representing users, groups and domains.
This diagram represents an Active Directory Services (Active Directory Domain Services). It can be helpful for system and network administrators to organize a network physical and logical elements (domains, data bases, servers, network equipment, end-user computers etc.) into a secure and logical structure. The logical structure of Active Directory is a hierarchical organization of all network components. The data that is stored in Active Directory comes from some diverse sources. The Active Directory diagram created using ConceptDraw Active Directory Diagram solution. It shows allocating group policies and functions assigned to end users. It helps to plan, manage and maintain the certain user access scenario.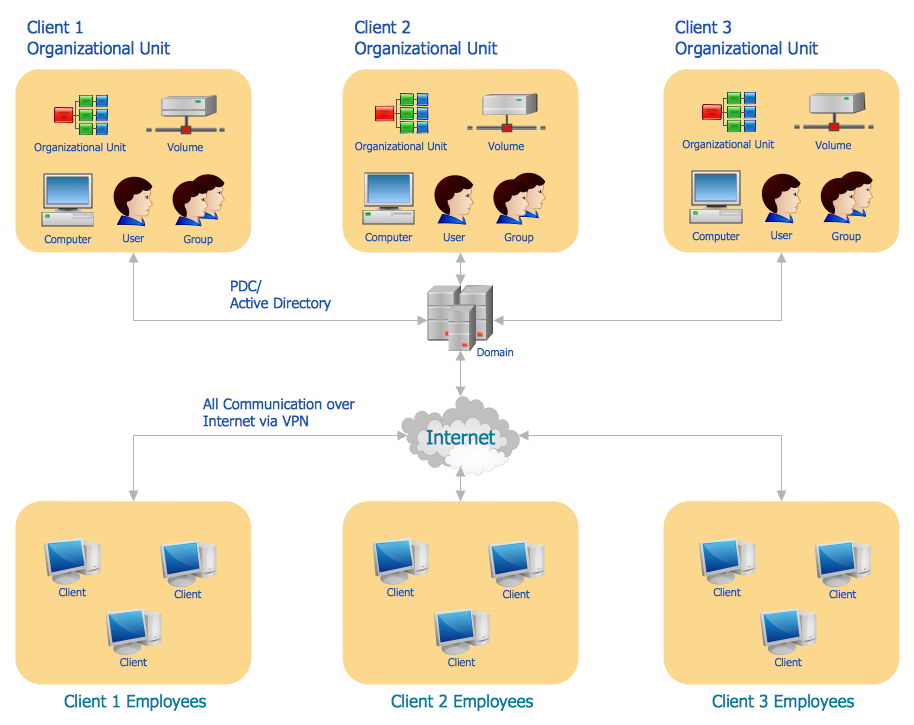
Picture: Active Directory Diagram
Related Solution: