Made with
ConceptDraw
DIAGRAM 18

Introduction to Cloud Computing Architecture

The Cloud Computing Architecture is a broad and comprehensive modern concept, which includes the possibility to use the cloud to store large amounts of various data and applications, and providing them on demand, it is also the use of storage internet applications, as for example e-mails, it is the seamless access to powerful hardware, servers, storage and software technologies offered by datacenters without embedding significant investment to own infrastructure, software and hardware.

The clouds are classified by location and by offered services. By location they can be:

  • Private - cloud which is build and exclusively used by a single organization.
  • Public - cloud hosted by cloud service providers.
  • Hybrid - combines both public and private cloud models.

As for the offered services, the clouds can be:

  • Infrastructure as a service (IaaS) - which offer the storage and database hosting;
  • Platform as a service (PaaS) - which offer a development platform;
  • Software as a service (SaaS) - which offer a complete ready-to-use application.

The best way to visualize the introduction to Cloud computing architecture is to create diagrams and schematics representing what is a cloud computing and how it works. For their design, we recommend to use a powerful ConceptDraw DIAGRAM diagramming and vector drawing software supplied with Cloud Computing Diagrams solution from the Computers and Network area of ConceptDraw Solution Park.

Introduction to Cloud Computing Architecture *

Example 1. Introduction to Cloud Computing Architecture - Cloud Computing Stack

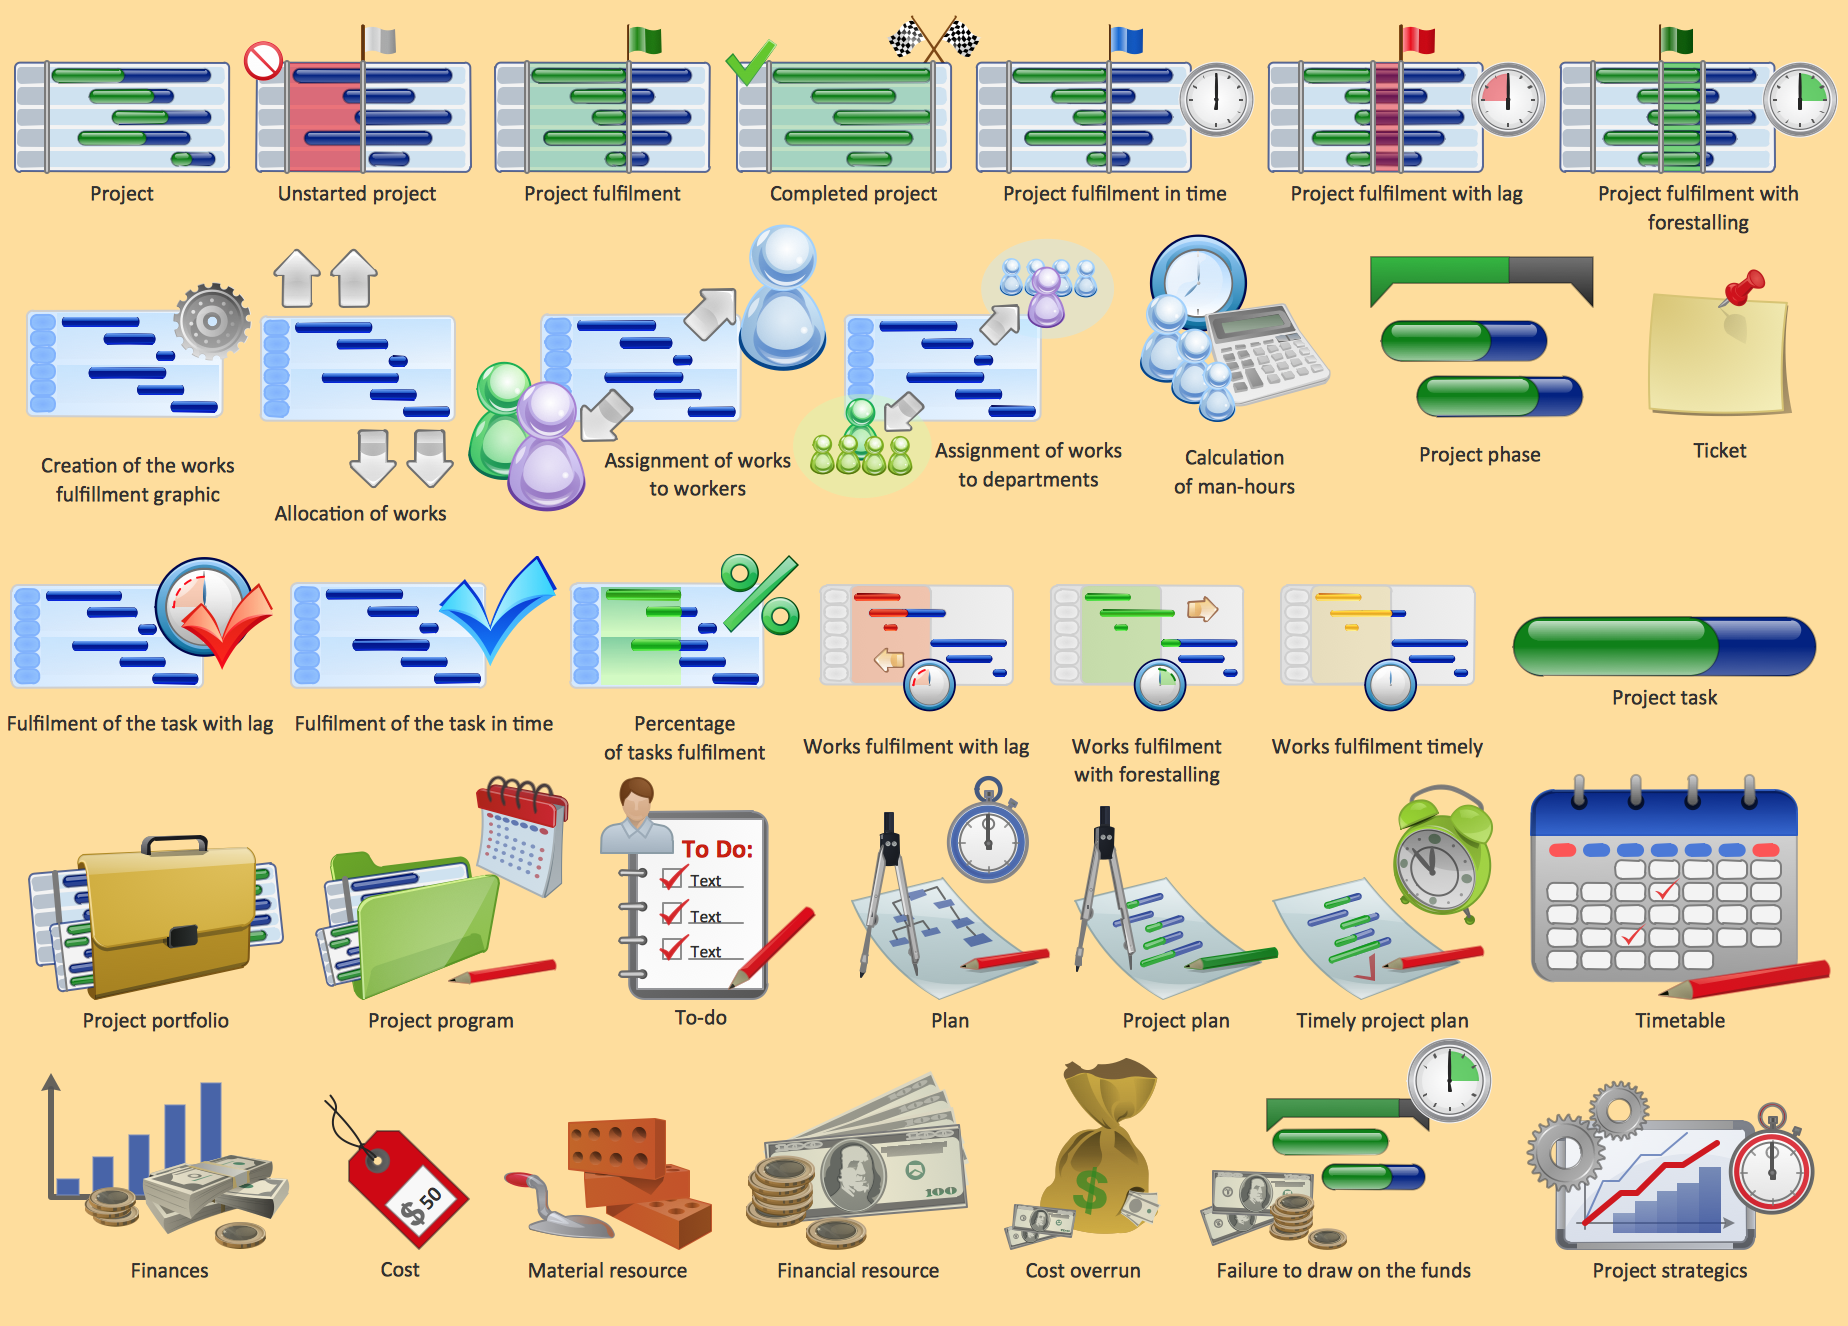
Cloud Computing Diagrams Solution provides for your choice wide variety of useful drawing tools, 4 libraries with a number of various ready-to-use vector icons, objects and colorful clipart, and also collection of professionally designed samples and examples which can become a beautiful source of inspiration for you.

Cloud Computing Types

Example 2. Cloud Computing Types

All libraries objects are vector, so you can resize them without loss of quality, change their color to make your diagrams and charts more interesting, bright and attractive.

All samples are available at your disposal at ConceptDraw STORE, you can apply them as is, or open in ConceptDraw DIAGRAM to change some details and then successfully use them at your work and science activity.

Cloud Computing Architecture

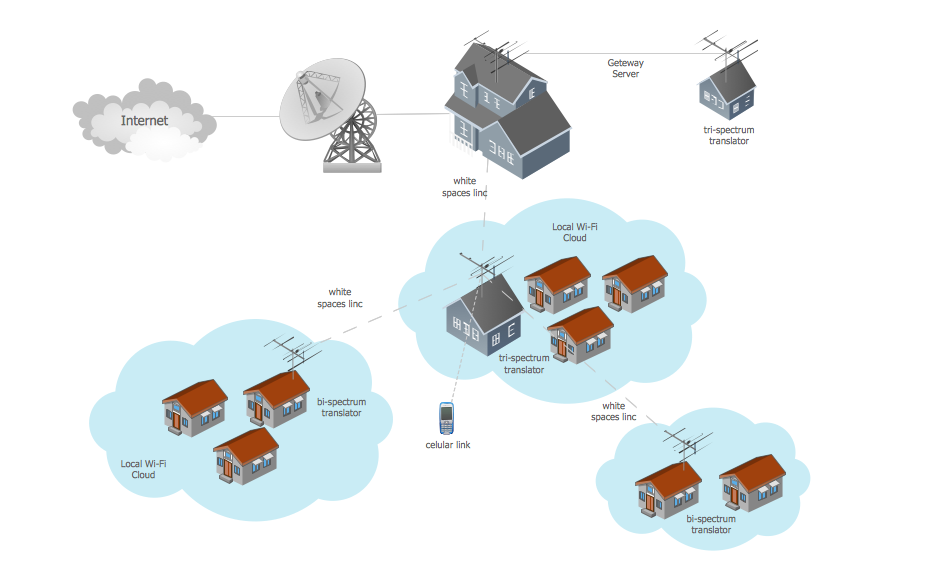
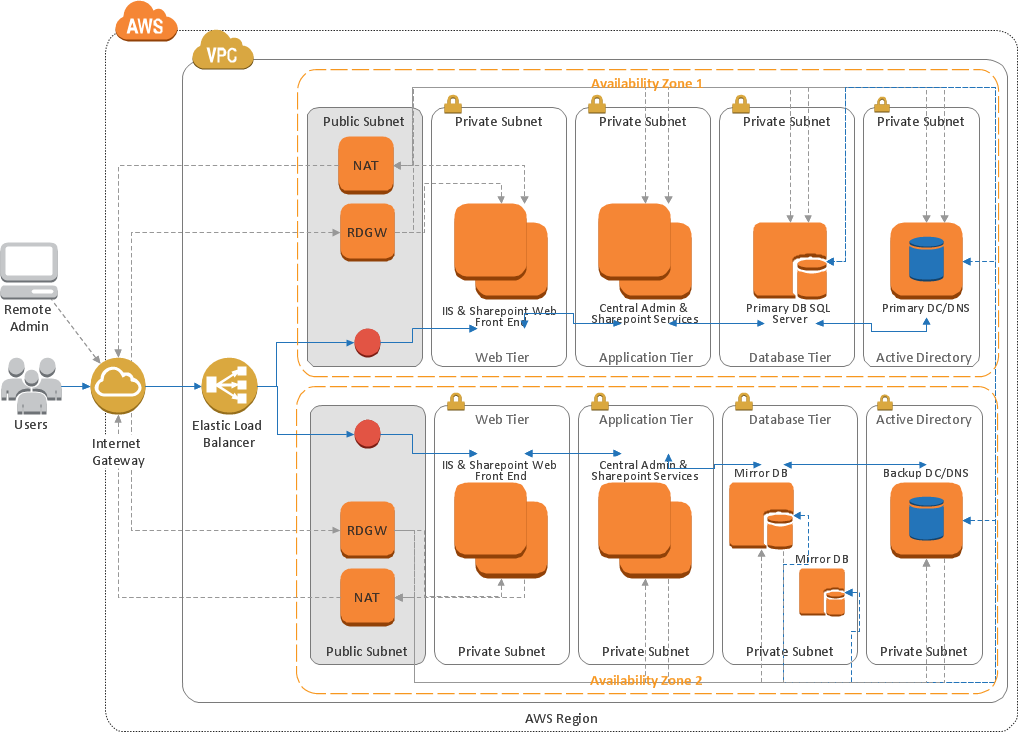
Example 3. Cloud Computing Architecture

The diagrams you see on this page were created in ConceptDraw DIAGRAM software using the tools of Cloud Computing Diagrams Solution for ConceptDraw Solution Park. They are the good introduction to Cloud computing architecture. An experienced user spent 5-10 minutes creating each of them.

Use the Cloud Computing Diagrams Solution for ConceptDraw DIAGRAM software to create your own professional looking Cloud Computing Architecture diagrams and schemes quick, easy and effective.

All source documents are vector graphic documents. They are available for reviewing, modifying, or converting to a variety of formats (PDF file, MS PowerPoint, MS Visio, and many other graphic formats) from the ConceptDraw STORE. The Cloud Computing Diagrams Solution is available for all ConceptDraw DIAGRAM users.


TEN RELATED HOW TO's:
The Bubble Map is a popular tool for visualization a data set which is widely used in economics, medicine, software engineering, architecture, and many other fields. Each bubble on the Bubble Map is characterized by coordinates, color and size. ConceptDraw DIAGRAM diagramming and vector drawing software extended with Business Diagrams Solution from the Management Area is a powerful Bubble Map Maker.Bubble Map Maker *
Picture: Bubble Map Maker
Related Solution:
No need for any special drawing skills to create professional looking diagrams outside of your knowledge base. ConceptDraw DIAGRAM takes care of the technical details, allowing you to focus on your job, not the drawing.Create Professional Looking Diagrams *
Picture: Create Professional Looking Diagrams
Want to create Diagrams for Amazon Web Services architecture? ConceptDraw Solution Park with AWS architecture Solution will help you!How To create Diagrams for Amazon Web Services architecture *
Picture: How To create Diagrams for Amazon Web Services architecture
Network Topology in communication networks, a topology is a usually schematic description of the arrangement of a network, including its nodes and connecting lines. There are two ways of defining network geometry: the physical topology and the logical topology. Network Topology Mapper offers extensive drawing tools professional-looking network diagrams quickly and easily allowing you to clearly represent and communicate network architecture, topology, and design to engineers, stakeholders and end-users.Network Topology Mapper *
Picture: Network Topology Mapper
Related Solution:
Use Case Diagrams technology. IDEF4 standard implies not only graphical presentation but the additional information about diagrams of heredity, methods systematization and types which are contained in specifications.IDEF4 Standard *
Picture: IDEF4 Standard
An event-driven process chain diagram is a flowchart used in business process analysis. It evolved from Architecture of Integrated Information Systems (ARIS) and utilised in the business process improvement and analysis. It is also used to facilitate enterprise resource planning. An EPC diagram is a complex flowchart that shows different business processes through various workflows. The workflows are seen as functions and events that are connected by different teams or people, as well as tasks that allow business processes to be executed. ConceptDraw DIAGRAM is a software for making EPC diagrams that allows managers visually present business process models for making decisions for business.How to Draw EPC Diagram Quickly *
Picture: How to Draw EPC Diagram Quickly
Related Solution:
Using diagrams, you can visualize the flow of the information or build a detailed data structure. There's no need to have a degree in software and database design with ConceptDraw DIAGRAM , because this software has all the tools needed in developing models and diagrams. Project planning, designing and prototyping was never so easy. This UML diagrams can be used to visualize a model of the data base development process. A UML diagram shows a graphical view of a structure of software system: components and relationships. Using Unified Modeling Language helps to depict logical and physical elements of a data base, visually represent requirements and sub-systems. UML diagrams allows developers to organize and predict critical issues, as well as collaborate data base information.Software and Database Design with ConceptDraw DIAGRAM  *
Picture: Software and Database Design with ConceptDraw DIAGRAM
Related Solution:
The ConceptDraw vector stencils library Cisco LAN contains symbols for drawing the computer local area network diagrams.Cisco LAN. <br>Cisco icons, shapes, stencils and symbols *
Picture: Cisco LAN. Cisco icons, shapes, stencils and symbols
Related Solution:
When you prepare professional-looking presentation, you need to use ConceptDraw MINDMAP software for the amazing result.Create Captivating Presentations Easily
Picture: Create Captivating Presentations Easily
Related Solution:
Accounting is a cornerstone of any business, it’s basement. If you want to have a visual representation of your finance management, use audit flowchart symbols to document the money flow. Although some would say that accounting is boring, it is very a responsible duty. The audit flowchart symbols is supplied with ConceptDraw Audit Flowcharts solution as a vector objects library. Together with Conceptdraw Drawing capabilities it forms the helpful tool for audit process planning and setting the steps of audit by designing audit flow charts. Audit Flow charts are used to organize fiscal information tracking process as well as in accounting, finance and investment management.Audit Flowchart Symbols
Picture: Audit Flowchart Symbols
Related Solution:
ConceptDraw
DIAGRAM 18