How To Create Emergency Plans and Fire Evacuation
Emergency Plan software
Emergency plan is the one you need for using in case of the need of evacuation and using ConceptDraw DIAGRAM software allows to draw Evacuation plans, Home Emergency plans, Office Emergency plans, Fire safety diagrams, Fire Emergency plans, Fire Evacuation plans, Business Emergency plans and many other plans and schemes, as well as charts, flowcharts, diagrams in any needed field of activity and so to apply them at work, for your own use and to recommend to all of your colleagues, business partners and, of course, your friends as it is a unique and very smart sophisticated software.
You can create quick custom
- Evacuation plans
- Home Emergency plans
- Office Emergency plans
- Fire safety diagrams
- Fire Emergency plans
- Fire Evacuation plans
- Business Emergency plans
with our Evacuation Plan software.
Find over 10000 stencils in our numerous libraries and use any of them to make the truly good looking and also very professional plans, including the emergency ones.
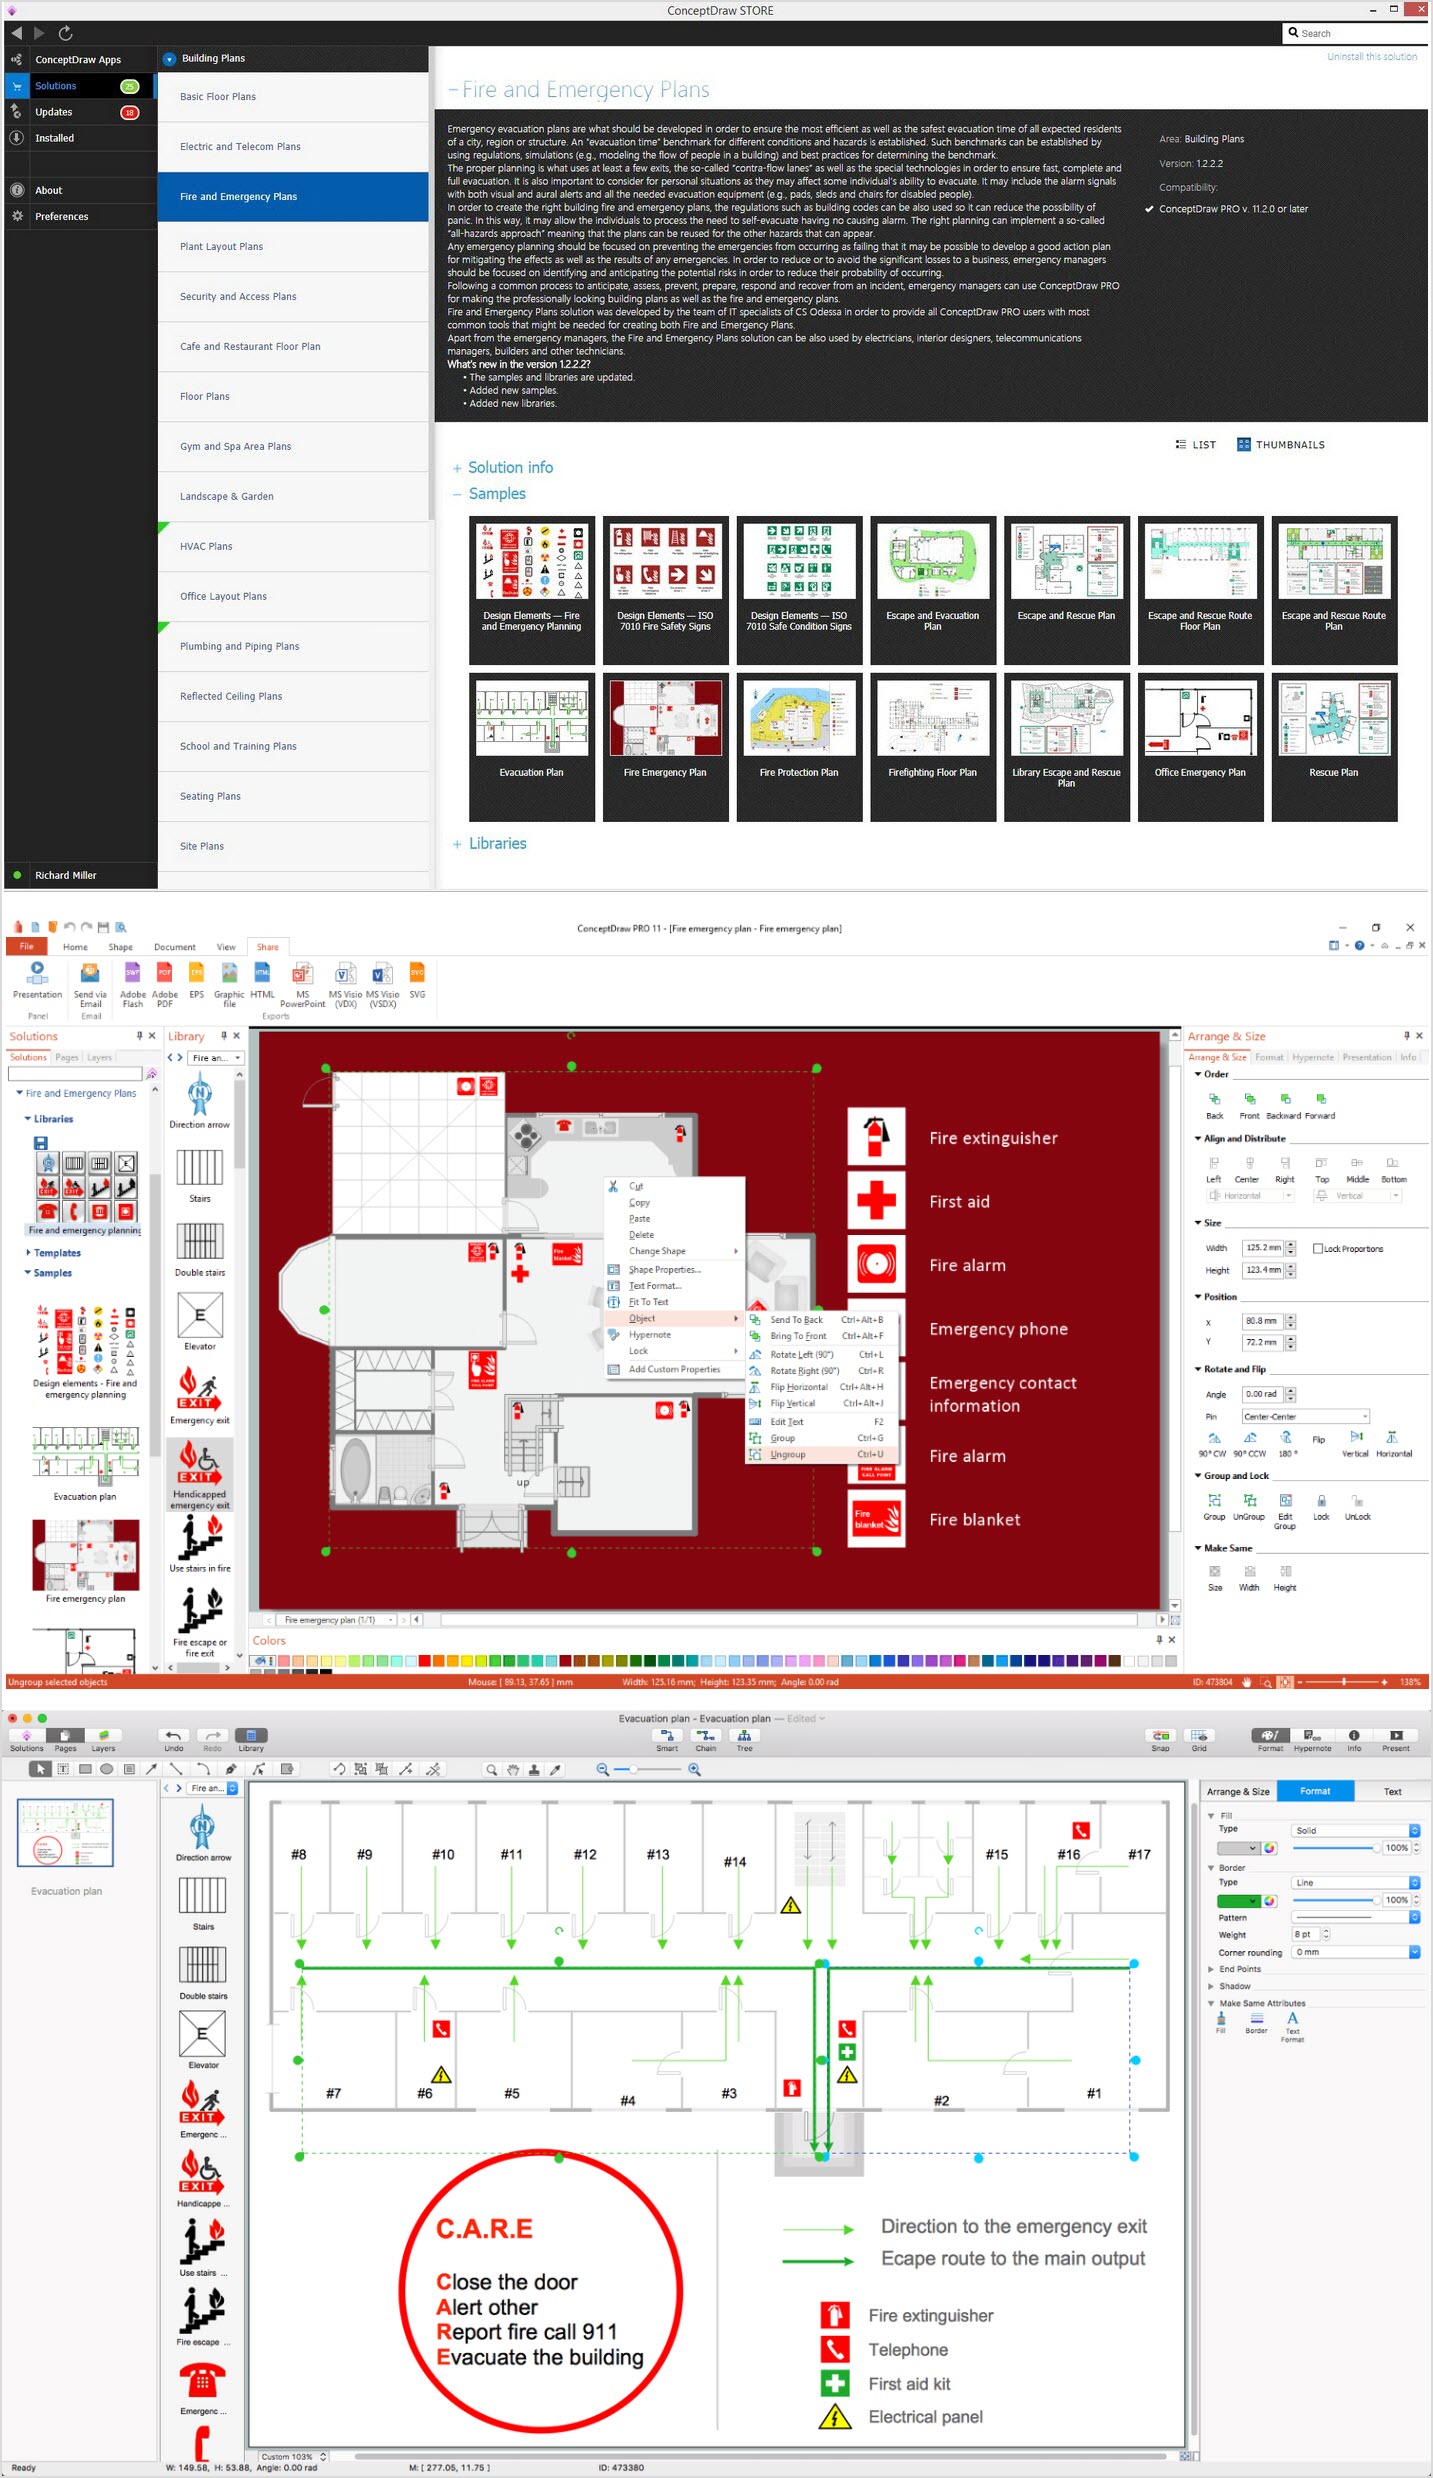
Fire Emergency Evacuation Plan Example
Fire escape plan is used in hospitals, hotels, business centers, etc.
This sample is drawn using ConceptDraw diagramming and vector drawing software enhanced with Building Plans solution from ConceptDraw Solution Park.
Read more about Home and Landscape design
TEN RELATED HOW TO's:
ConceptDraw DIAGRAM is perfect for software designers and software developers who need to draw Computer&Network Diagrams.
ConceptDraw has 1004 vector stencils in the 40 libraries that helps you to start using software for designing own Network Diagrams. You can use the appropriate stencils from Computer and Network Diagrams library with 56 objects..png)
Picture: Design Element: Computer and Networkfor Network Diagrams
Related Solution:
Mechanical design is a labour-intensive process. To facilitate the task of Mechanical Engineering Diagrams creating, ConceptDraw DIAGRAM diagramming and vector drawing software was extended with Mechanical Engineering solution from the Engineering area. Now, ConceptDraw DIAGRAM is a powerful Mechanical Design Software.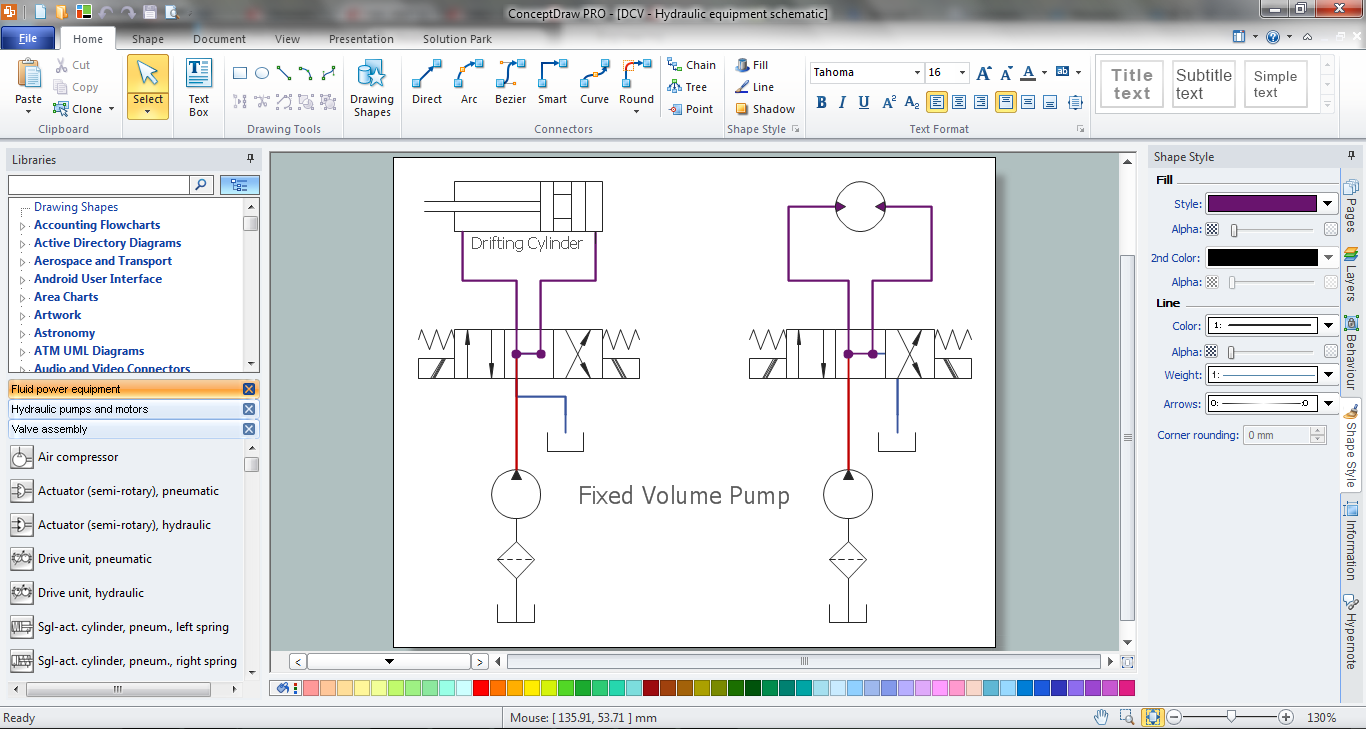
Picture: Mechanical Design Software
Related Solution:
This method of problem analysis is widely used in IT, manufacture industries and chemical engineering. If you want to take a fresh look on your problem, you can draw a fishbone diagram with ConceptDraw DIAGRAM software, which supports both MAC OS and Windows. You can see and download fishbone diagram samples and templates in ConceptDraw Solution Park.
This Fishbone (Ishikawa) diagram can be applied as template for performing the cause and effect analysis of a service industry problems. It can help to determine factors causing problems. Causes in this diagram are categorized according to the 4S’s principle that means Surroundings, Suppliers, Systems and Skills. Grouping causes allows to reveal main interactions between different events. This diagram was made using ConceptDraw Fishbone diagrams solution. It can help to reveal the causes effected a complicated issue. Of course it can be used together with other methods of approaching to the problem solving.
Picture: Draw Fishbone Diagram on MAC Software
Related Solution:
Planning a water supply system is one of the stages of developing a building drawing. Although materials are constantly improved, design elements for plumbing haven't changed sufficiently for decades. This is due to necessity of maintaining very old systems.
The plan and schematic drawing of plumbing equipment, water pipe junctions and, kitchen facilities a is a rather significant element of a building plan. The suite of 4 vector libraries supplied with ConceptDraw solution for Plumbing and Piping Planning includes near 130 vector images of pipes, boilers, water pipe junctions, tanks and other plumbing devices, helpful when creating plumbing and piping plans, and blueprints of sewerage or water supply systems.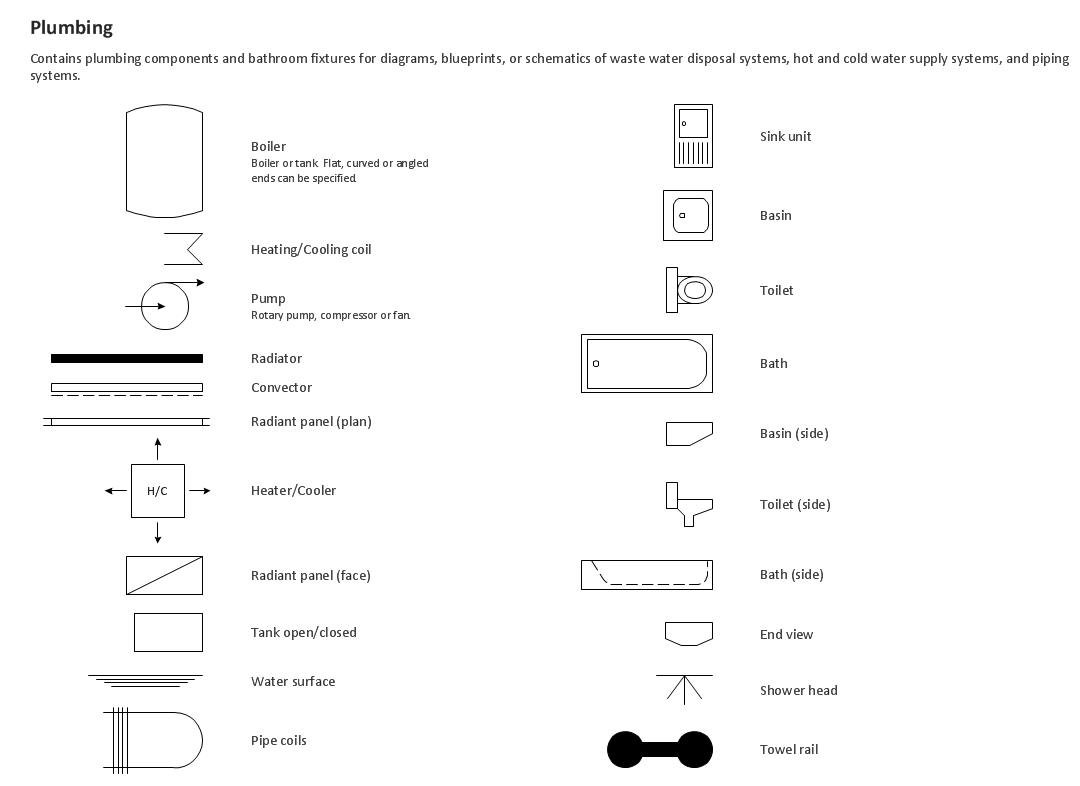
Picture: Building Drawing. Design Element — Plumbing
Related Solution:
The Building Plans area of ConceptDraw Solution Park includes a set of solutions of Interior Design. The Interior Design solutions for ConceptDraw DIAGRAM allow you simply and quickly create the professional looking Building Plans that will help you to design, redesign your room, flat, home, office, cafe or any other building. Having the ready plan of the rooms you can easy rearrange the furniture, interior objects on the plan and see the future result at once.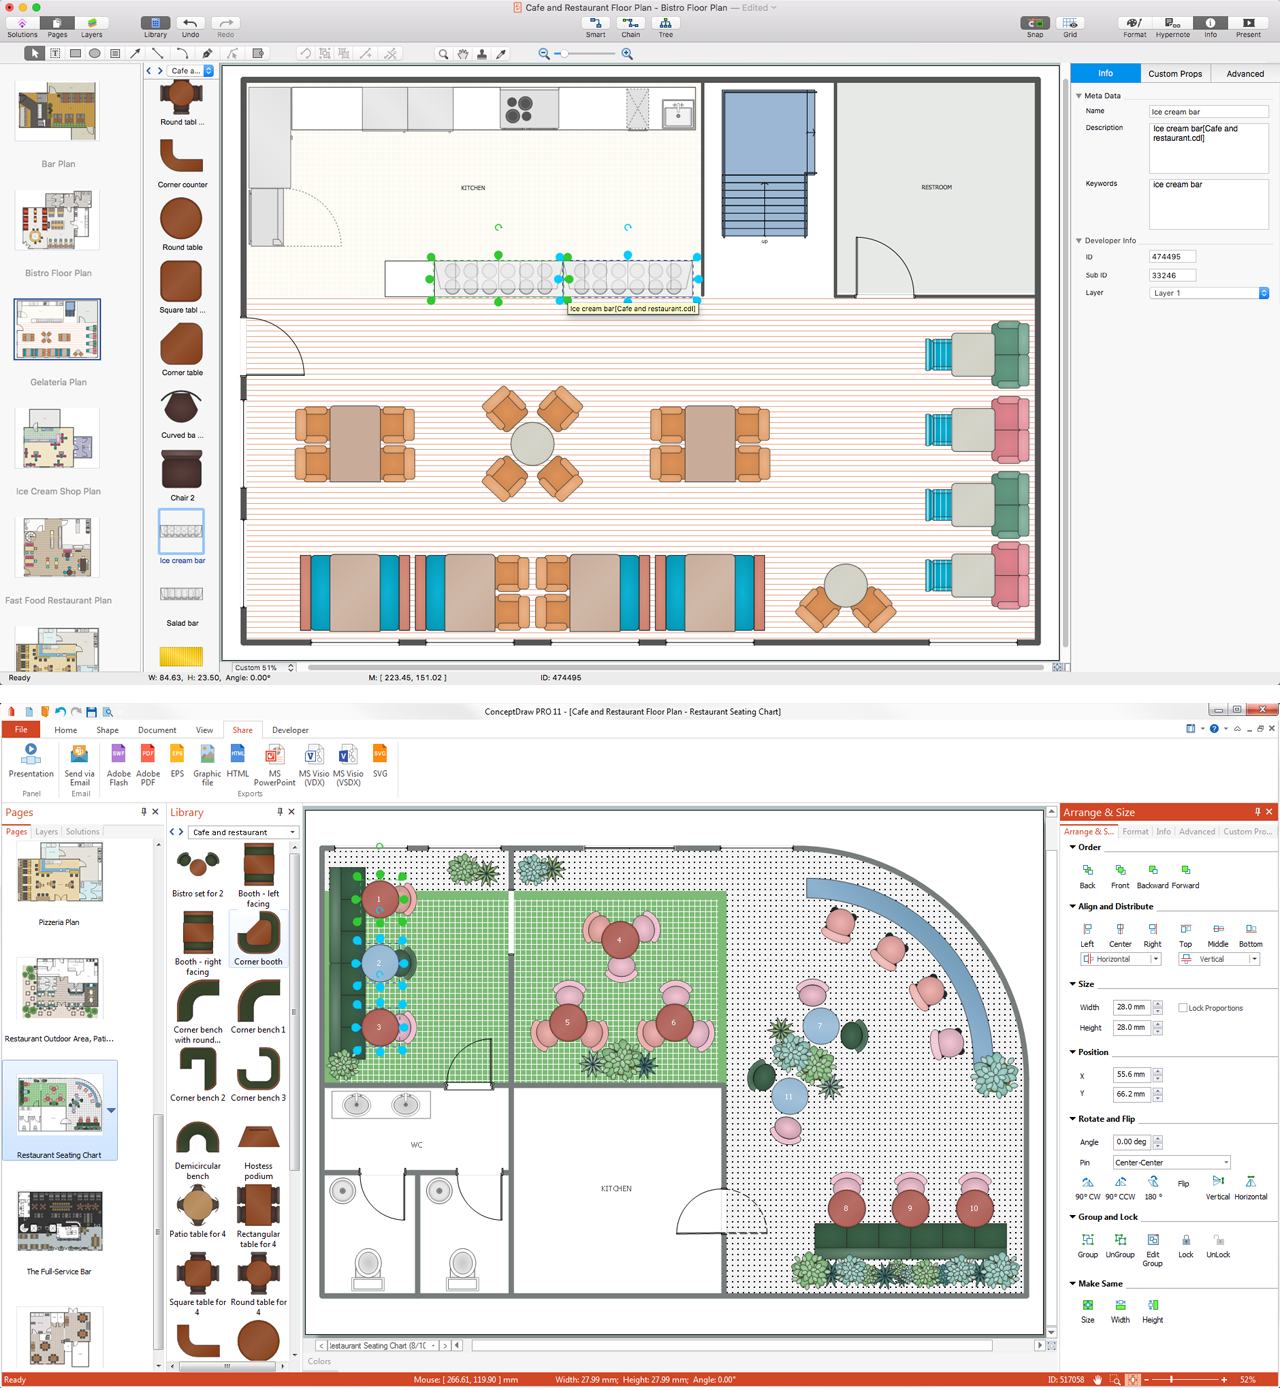
Picture: Interior Design Software. Building Plan Examples
Related Solution:
ConceptDraw DIAGRAM is a vector-based network diagramming software. Now it has powerful tools to draw 3D Network Diagrams.
Use more than 2 000 pre-designed 3D network elements for customizing your network diagrams. Computer & Networks solution allows you for design 3D LAN and WAN, schematic and wiring drawings.
Picture: 3D Network Diagram Software
Related Solution:
A flowchart is a powerful tool for examining processes. It helps improving processes a lot, as it becomes much easier to communicate between involved people, to identify potential problems and to optimize workflow. There are flowcharts of different shapes, sizes and types of flowchart vary from quite basic process flowcharts to complex program flowcharts. Nevertheless, all these diagrams use the same set of special symbols like arrows to connect blocks, parallelogram to show data receiving or rectangles for showing process steps.
Basic flowcharts are used to represent a simple process algorithm. A basic flowchart notation consists of rectangles (business processes), arrows (the flow of information, documents, etc.). The same notation is used in items such as the "decision", which allow you to do the branching. To indicate the start of the entire business process and its termination can be used the "Terminator" element. The advantages of Basic Flowchart are simplicity and clarity. With it you can quickly describe the business process steps. Creating of Basic Flowchart does not require any special knowledge, as easily understand by employees with different levels of education and IQ.
Picture: Types of Flowchart: Comprehensive Overview
Related Solution:
A database is a data collection, structured into some conceptual model. Two most common approaches of developing data models are UML diagrams and ER-model diagrams. There are several notations of entity-relationship diagram symbols and their meaning is slightly different. Crow’s Foot notation is quite descriptive and easy to understand, meanwhile, the Chen notation is great for conceptual modeling.
An entity relationship diagrams look very simple to a flowcharts. The main difference is the symbols provided by specific ERD notations. There are several models applied in entity-relationship diagrams: conceptual, logical and physical. Creating an entity relationship diagram requires using a specific notation. There are five main components of common ERD notations: Entities, Actions, Attributes, Cardinality and Connections. The two of notations most widely used for creating ERD are Chen notation and Crow foot notation. By the way, the Crow foot notation originates from the Chen notation - it is an adapted version of the Chen notation.
Picture: ERD Symbols and Meanings
Related Solution:
ConceptDraw DIAGRAM diagramming and vector drawing software extended with Electrical Engineering Solution from the Industrial Engineering Area of ConceptDraw Solution Park affords you the easiest and fastest way for designing professional looking Electrical Schematics.
Picture: Electrical Schematics
Related Solution:
Electrical Diagram is a visual graphical representation of an electrical circuit. ConceptDraw DIAGRAM diagramming and vector drawing software supplied with unique Electrical Engineering Solution from the Industrial Engineering Area will help you design Electrical Diagram of any complexity without efforts.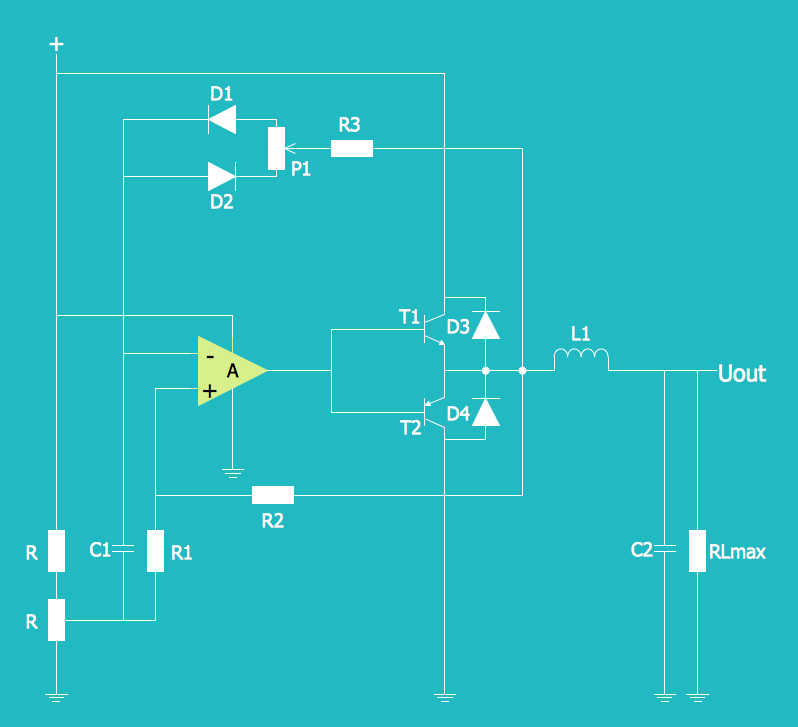
Picture: Electrical Diagram
Related Solution: