
Example 3. Simple Flow Chart
This sample shows the Gravitational Search Algorithm (GSA) that is the optimization algorithm. GSA is based on the law of gravity. It is a swarm based algorithm when all the members execute the operations, exchange the results and produce the global result that allows the system to solve the problem. The objects attract each other by the gravity force, the performance of the objects is measured by their masses. The gravity force causes the movement of all objects to the heavier masses objects. The position of the heavy masses is an optimal solution of the problem.
Use flowchart symbols from Flowcharts Solution for ConceptDraw DIAGRAM software to design your own complex or simple flow chart quick, easy and effective.
All source documents are vector graphic documents. They are available for reviewing, modifying, or converting to a variety of formats (PDF file, MS PowerPoint, MS Visio, and many other graphic formats) from the ConceptDraw STORE. The Flowcharts Solution is available for all ConceptDraw DIAGRAM or later users.
TEN RELATED HOW TO's:
Nowadays, a constructor needs skills in various areas. For instance, knowing How To use Appliances Symbols for Building Plan, can be useful in developing illustrations for customers. Aware means armed.
This image shows the content of the Appliances library that is a component of the ConceptDraw Floor Plans solution. Being used with ConceptDraw DIAGRAM drawing facilities, this library allows you to create floor plan and interior design for your new family residence and its, undoubtedly the most important section such as kitchen and bathroom. As considering your kitchen arrangement and developing the properly variant for your apartment, one of the main points is the complete layout of the kitchen and its appliances. The vector graphical objects supplied with ConceptDraw Floor plans solution by allows you easily display the most original ideas of kitchen and bathroom layout.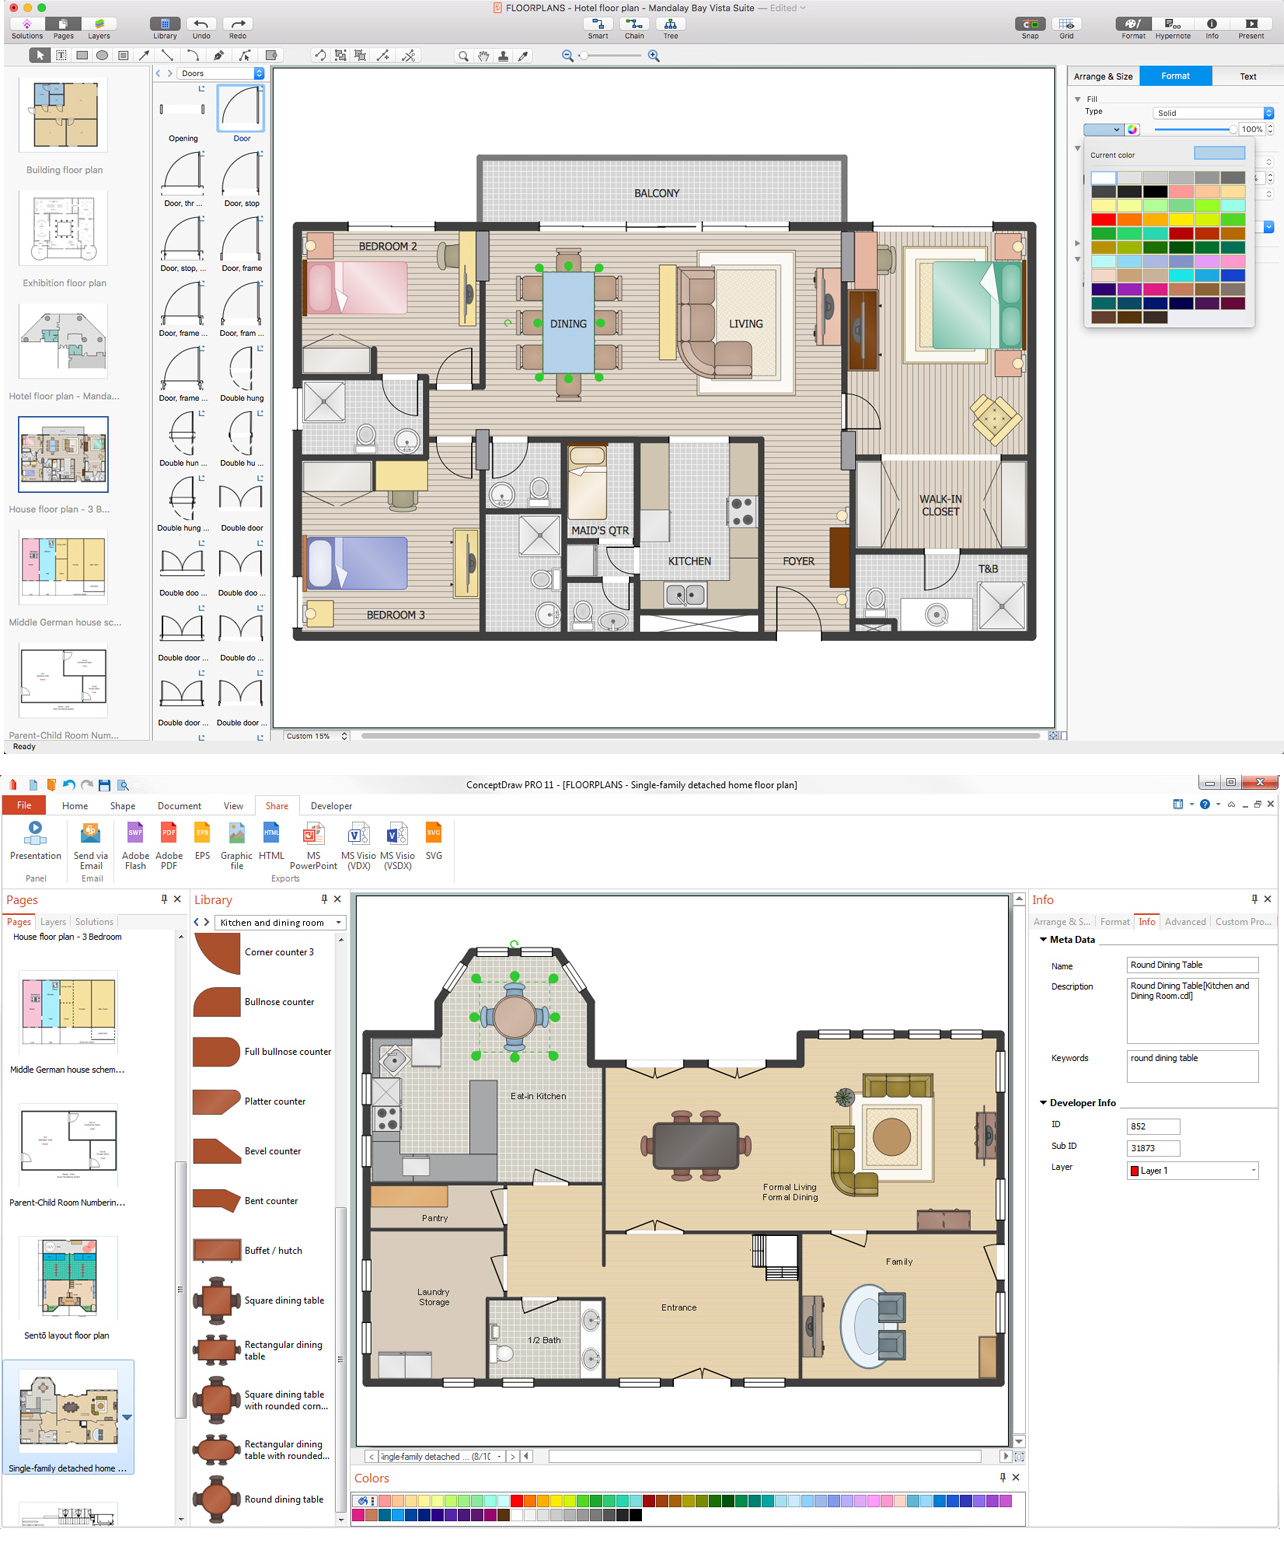
Picture: How To use Appliances Symbols for Building Plan
Related Solution:
A process flow diagram (PFD) is a diagram commonly used in chemical and process engineering to indicate the general flow of plant processes and equipment.
ConceptDraw DIAGRAM diagramming and vector drawing software extended with Flowcharts Solution from the Diagrams Area of ConceptDraw Solution Park offers the extensive drawing tools for quick and easy design professional looking Process Flow Diagrams.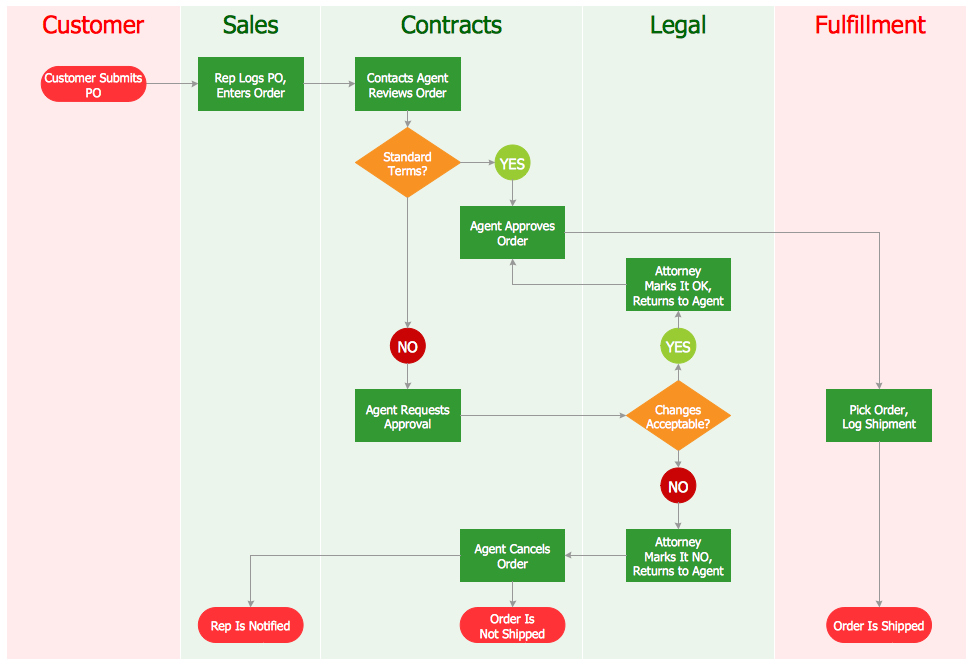
Picture: Process Flow Diagrams
Related Solution:
A flowchart is a powerful tool for examining processes. It helps improving processes a lot, as it becomes much easier to communicate between involved people, to identify potential problems and to optimize workflow. There are flowcharts of different shapes, sizes and types of flowchart vary from quite basic process flowcharts to complex program flowcharts. Nevertheless, all these diagrams use the same set of special symbols like arrows to connect blocks, parallelogram to show data receiving or rectangles for showing process steps.
Basic flowcharts are used to represent a simple process algorithm. A basic flowchart notation consists of rectangles (business processes), arrows (the flow of information, documents, etc.). The same notation is used in items such as the "decision", which allow you to do the branching. To indicate the start of the entire business process and its termination can be used the "Terminator" element. The advantages of Basic Flowchart are simplicity and clarity. With it you can quickly describe the business process steps. Creating of Basic Flowchart does not require any special knowledge, as easily understand by employees with different levels of education and IQ.
Picture: Types of Flowchart: Comprehensive Overview
Related Solution:
ConceptDraw DIAGRAM is a software for producing flow charts. The software delivers built-in object libraries with vector stencils that allows you to use RapidDraw technology. By clicking on direction arrows one can add a new object to flowchart. Users can start drawing their own flowchart diagrams in fast and simple way.
Picture: Diagram Flow Chart
Related Solution:
Fishbone diagram is a powerful tool used for solving business problems and obstacles. ConceptDraw DIAGRAM software extended with Fishbone Diagrams solution from the Management area of ConceptDraw Solution Park is a helpful tool for cause and effect analysis. It gives the ability to easy identify many possible causes and factors which cause the effects and to draw Fishbone Diagrams for problem solving.
Picture: Cause and Effect Analysis - Fishbone Diagrams for Problem Solving
Related Solution:
The Process Flowchart or Process Flowchart Diagram (PFD) is a visual representation relations between major parts of the system, the steps in a process, and even connections between various systems. The possibility to easy create professional-looking and attractive Process Flowcharts, Business Process Diagrams and Maps which visualize the steps of complex processes is provided by Business Process Diagram Solution from the Business Processes Area of ConceptDraw Solution Park and 16 libraries with 230 process flowchart symbols from BPMN 1.2 and BPMN 2.0.
Picture: Process Flowchart Symbols
Related Solution:
Do you need to draw a check order process flowchart?
Use the intuitive product - ConceptDraw.
Picture: Check Order Process Flowchart. Flowchart Examples
Related Solution:
The Venn diagram example below shows sustainable development at the confluence of three constituent parts.
Create your Venn diagrams for problem solving in environmental social science using the ConceptDraw DIAGRAM software.
Picture:
Venn Diagram Examples for Problem Solving
Environmental Social Science
Human Sustainability Confluence
Related Solution:
This sample shows the Flowchart that displays the architecture of SQL Exception Translation.
This sample was created in ConceptDraw DIAGRAM diagramming and vector drawing software using the Flowcharts solution from the Diagrams area of ConceptDraw Solution Park.
Picture: Sample Project Flowchart. Flowchart Examples
Related Solution:
But it never matters which hotel plan you want to illustrate in a way of a floor plan, you can always do it with ConceptDraw DIAGRAM especially it can be simple to do having the “Floor Plans” solution, which can be downloaded from the Building Plans area of ConceptDraw Solution Park.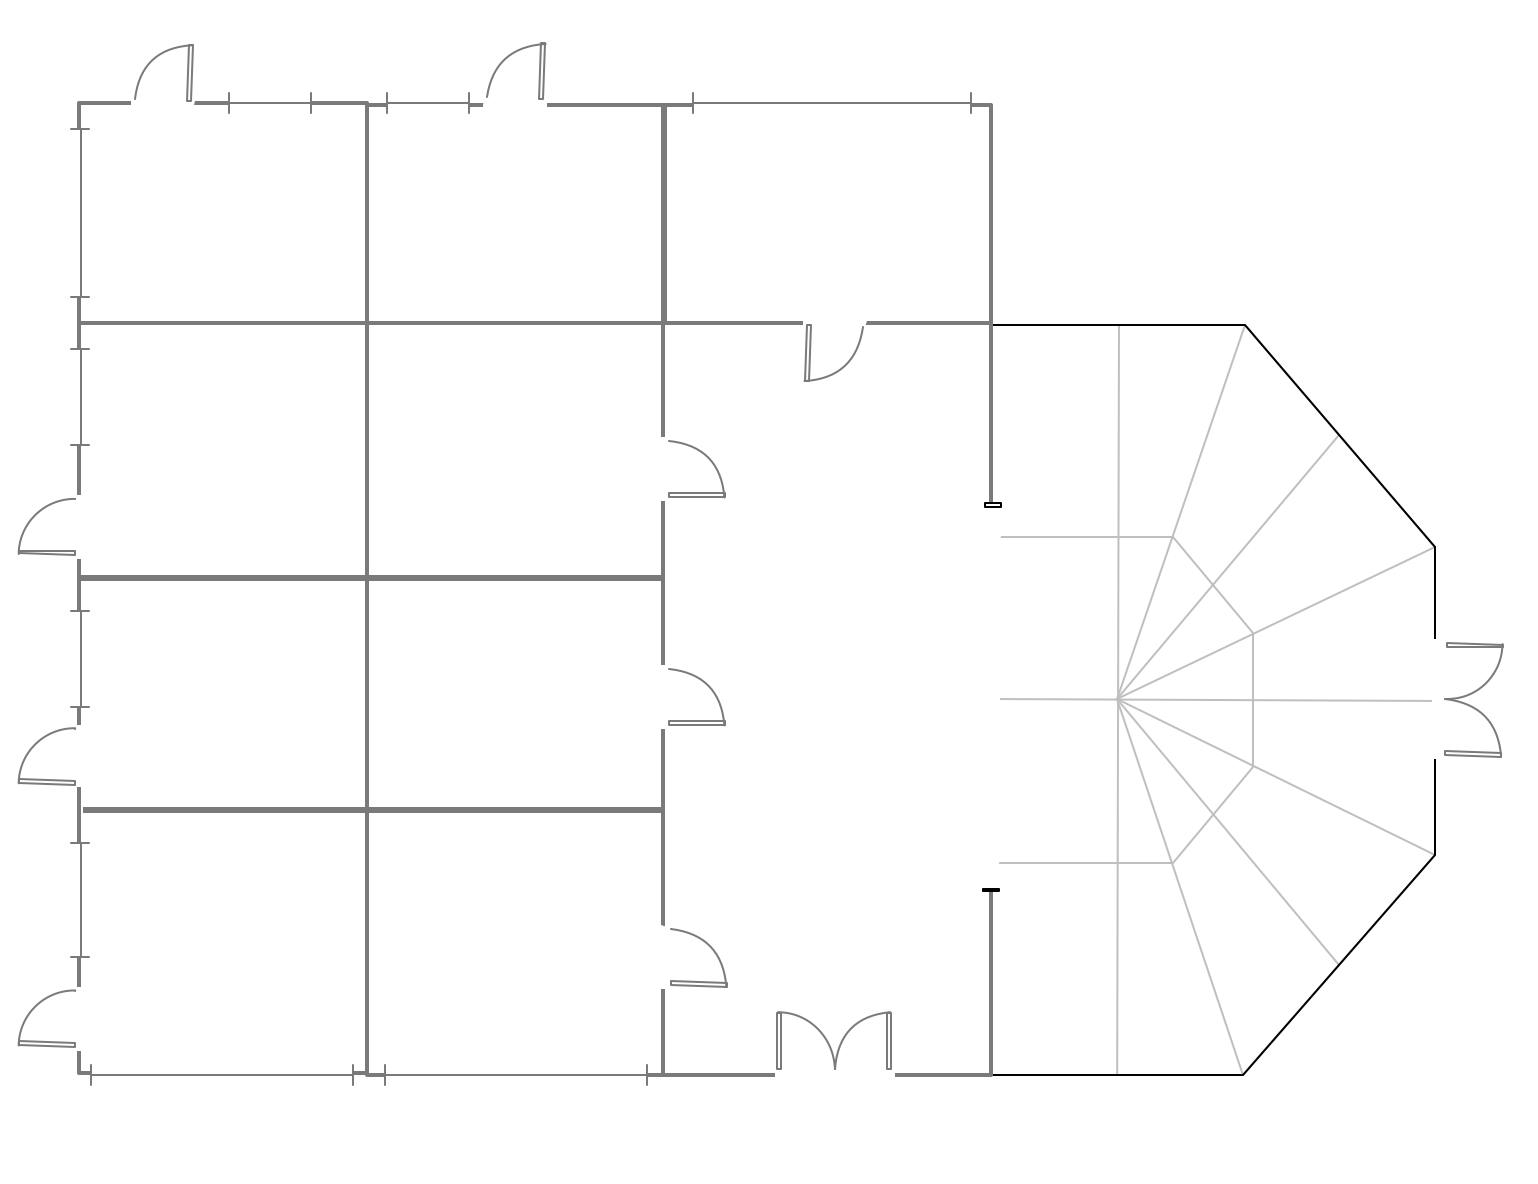
Picture: Mini Hotel Floor Plan. Floor Plan Examples
Related Solution:

