Using the Bubble Diagrams Solution for ConceptDraw DIAGRAM you can create your own professional looking Bubble Diagrams quick and easy.
The Bubble Diagrams produced with ConceptDraw DIAGRAM are vector graphic documents and are available for reviewing, modifying, and converting to a variety of formats (image, HTML, PDF file, MS PowerPoint Presentation, Adobe Flash or MS Visio).
TEN RELATED HOW TO's:
ConceptDraw DIAGRAM is a Wireless Network Drawing Mac OS software.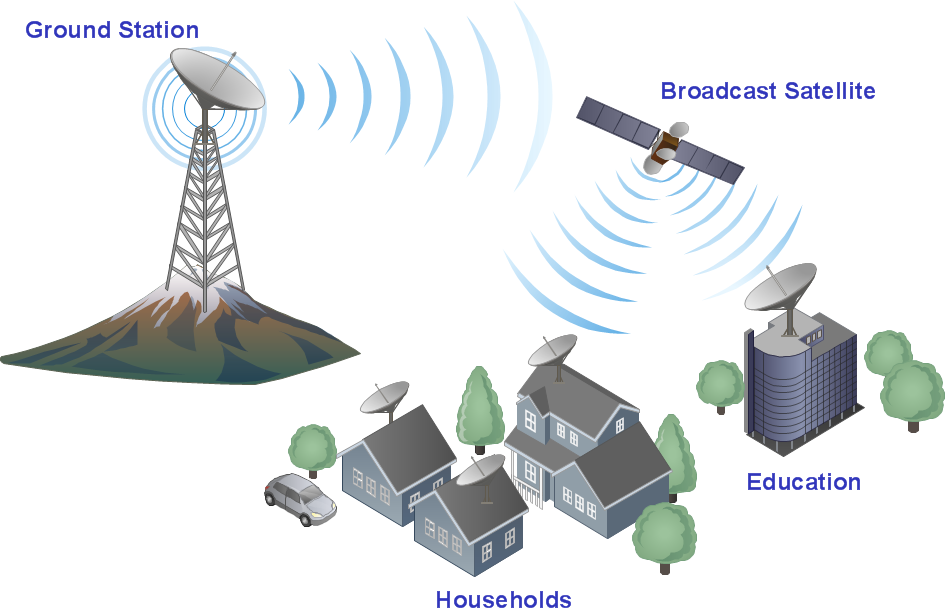
Picture: Wireless Networking for Mac
Related Solution:
The excellent possibility to create attractive Cross Functional Flowcharts for step-by-step visualization the operations of a business process flow of any degree of detailing is offered by ConceptDraw’s Cross-Functional Flowcharts solution. The extensive selection of commonly used vector cross functional flowchart symbols allow you to demonstrate the document flow in organization, to represent each team member’s responsibilities and how processes get shared or transferred between different teams and departments.
Picture: Cross Functional Flowchart Symbols
Related Solution:
While studying, many of the students encounter the necessity of remaking class projects, over and over. To facilitate this process you can use special electrical and telecom plan software, which helps altering projects in several clicks. Using templates will fasten your work, and you will have more free time.
This sample represents an electrical and telecommunication floor plan. Electrical and telecom floor plans contain a floor plan , on which imposed the layout of electrical, and telecommunications equipment. They shows electrical and telecom details regarding the current floor of a building: lightening, fixtures, wires, outlets, circuit panels, etc. Using of standart notation of electrical and telecommunication symbols makes the plan understandable for engineers, architects, constructors, specialist in electricity and telecommunications.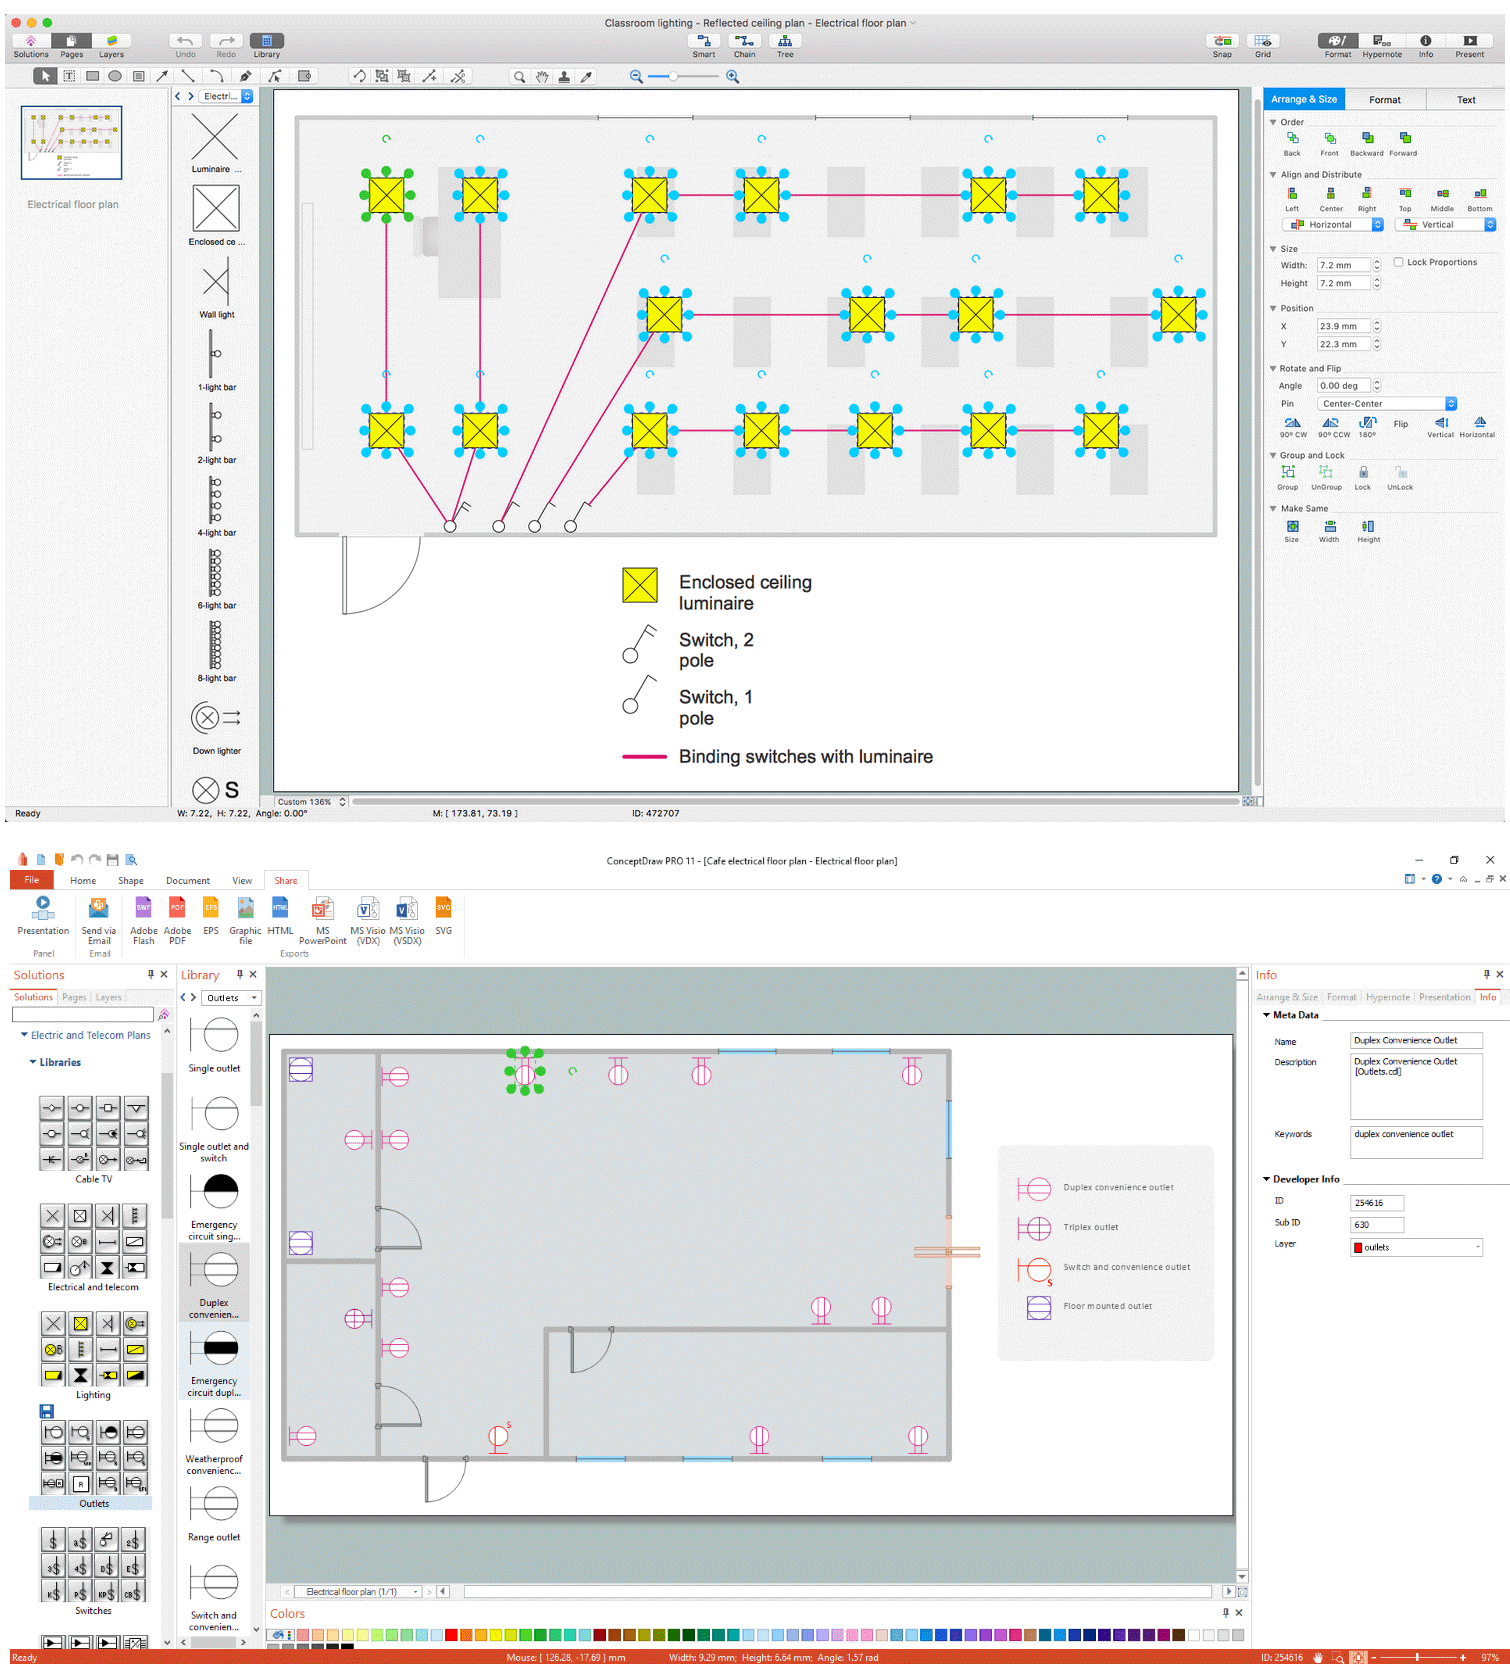
Picture: Electrical and Telecom Plan Software
Related Solution:
The Line Graphs solution from Graphs and Charts area of ConceptDraw Solution Park contains a set of examples, templates and design elements library of scatter charts.
Use it to draw scatter graphs using ConceptDraw DIAGRAM diagramming and vector drawing software for illustrating your documents, presentations and websites.
Picture: Scatter Chart Examples
Related Solution:
The Basketball Field library from the Basketball solution provides a complete set of ready-to-use predesigned vector courts: horizontally and vertically located, whole and half of court, colored and not, courts with views from different sides.
All courts objects are designed according to the real basketball courts dimensions. Simply drop the needed basketball field in the vector from the library to design your own basketball diagram.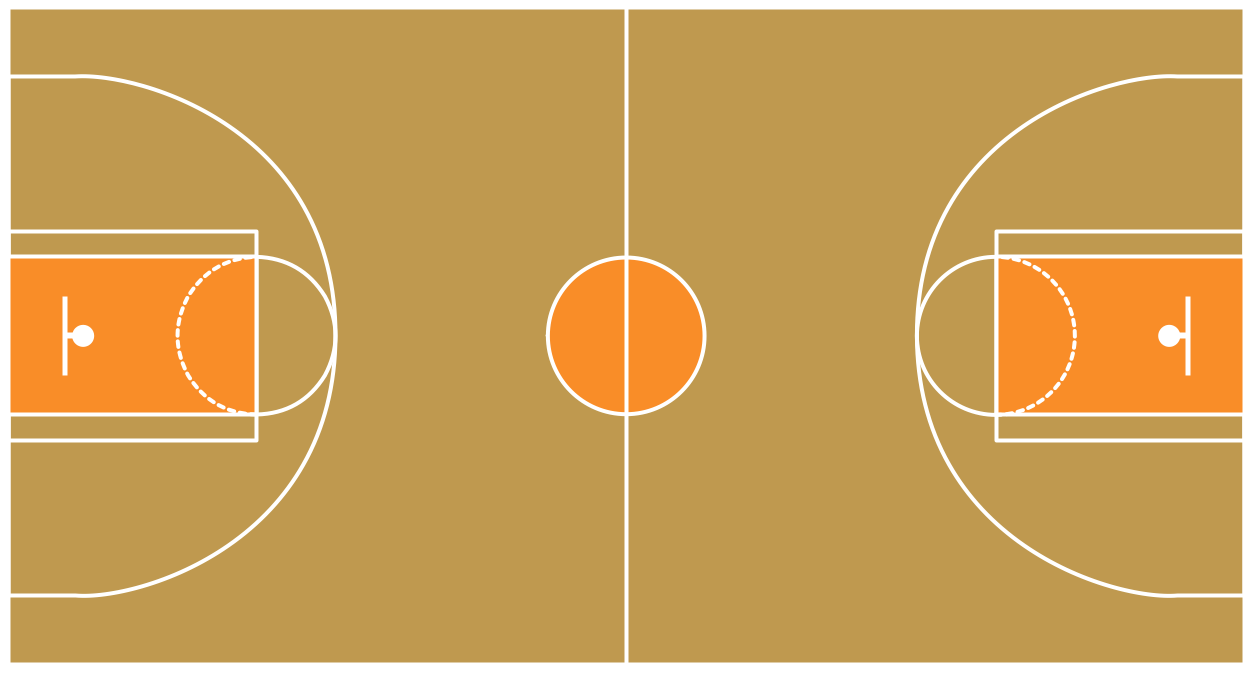
Picture: Basketball Field in the Vector
Related Solution:
Design efficiently the technical flow charts in ConceptDraw DIAGRAM software for various fields and provide ✔️ clarity, ✔️ accuracy, ✔️ usability, ✔️ simple communication, analysis, and improvement
Picture: Technical Flow Chart Example
Related Solution:
ConceptDraw DIAGRAM enhanced with Audio, Video, Media solution is a helpful tool for illustration of a CCTV network. It contains library of vector cliparts of video and TV devices and different digital gadgets for drawing such illustrations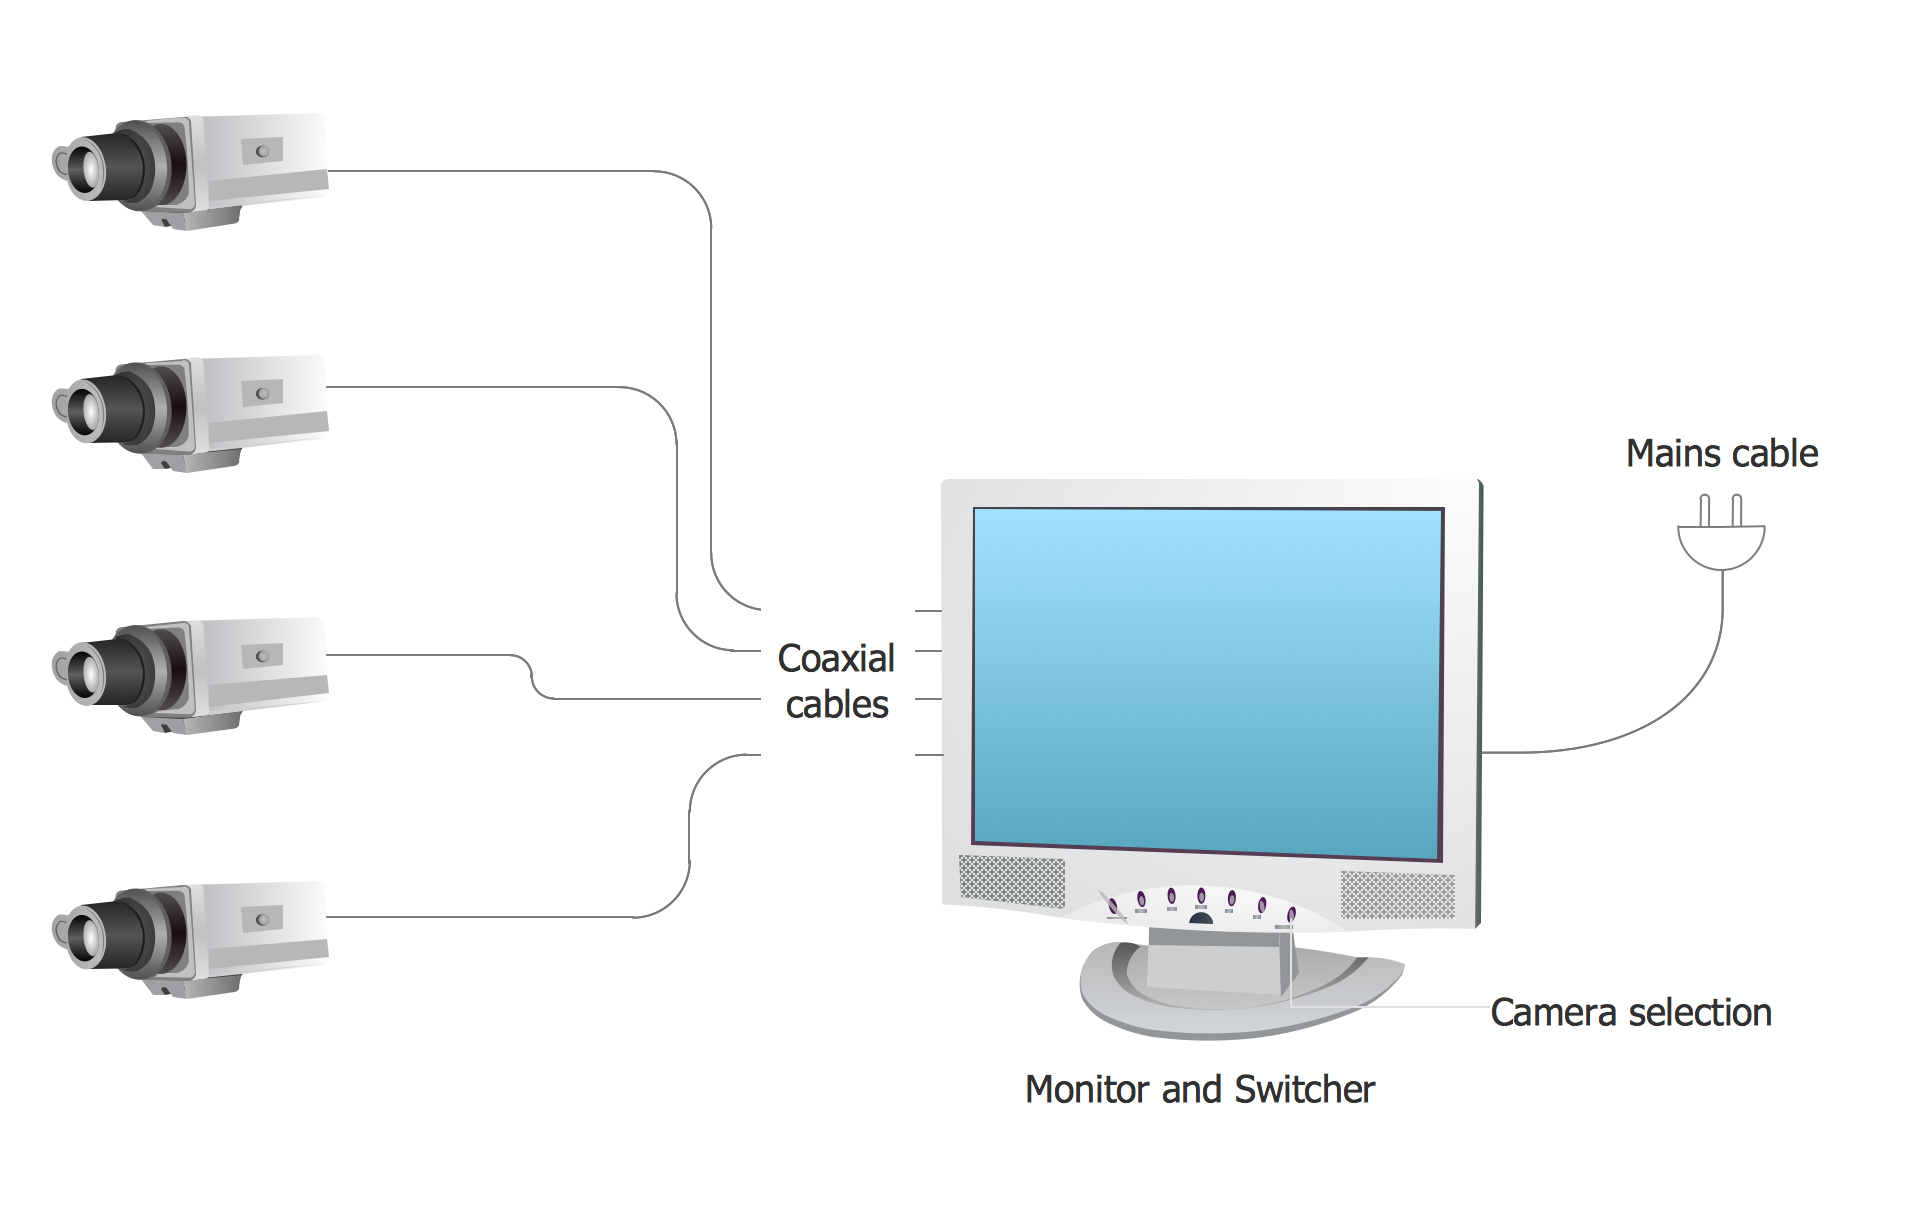
Picture: Basic CCTV System Diagram. CCTV Network Diagram Example
Related Solutions:
What is information architecture? Information architecture (IA) is a broad and abstract term. At the most general sense the information architecture describes the structure of a system, how the different pieces of information are related at the system and represents their relationships. The information architecture term was introduced by Richard Saul Wurman in 1975 and now is commonly used in the context of websites and intranets, information structures and computer systems.
ConceptDraw DIAGRAM extended with Enterprise Architecture Diagrams Solution from the Management Area is the best software for design information architecture and drawing Enterprise Architecture Diagrams.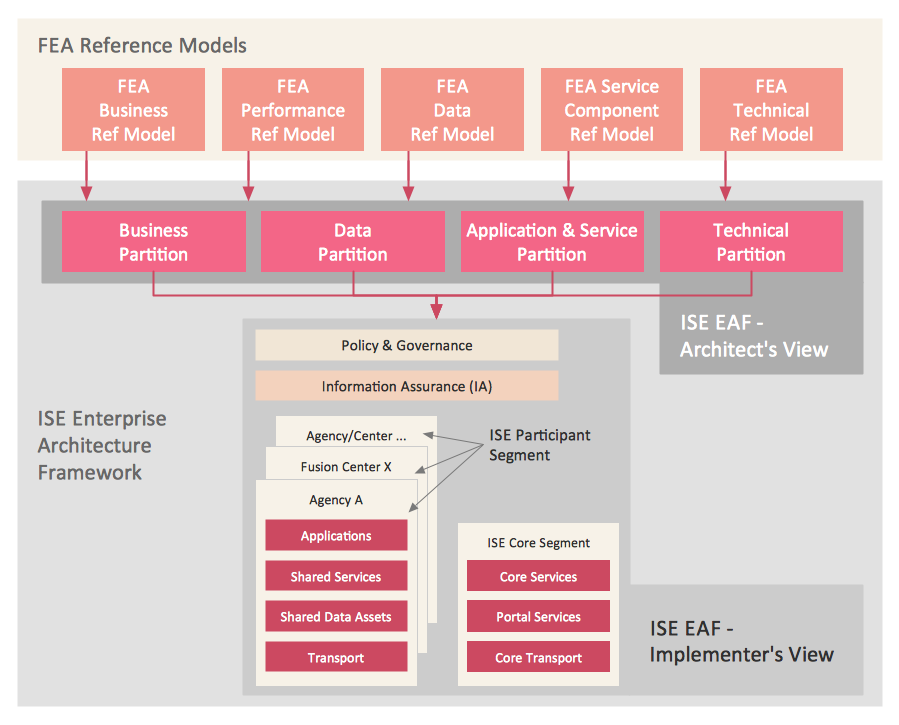
Picture: What Is Information Architecture
Related Solution:
ConceptDraw Flowcharts visualize a process or algorithm of program as step/operation blocks of various shapes connected with arrowed lines showed the process flow direction. They are used to visualize business or technical processes and software algorithms.
Picture: Selecting & Creating Flowcharts
Related Solution:
Want to create Diagrams for Amazon Web Services architecture? ConceptDraw Solution Park with AWS architecture Solution will help you!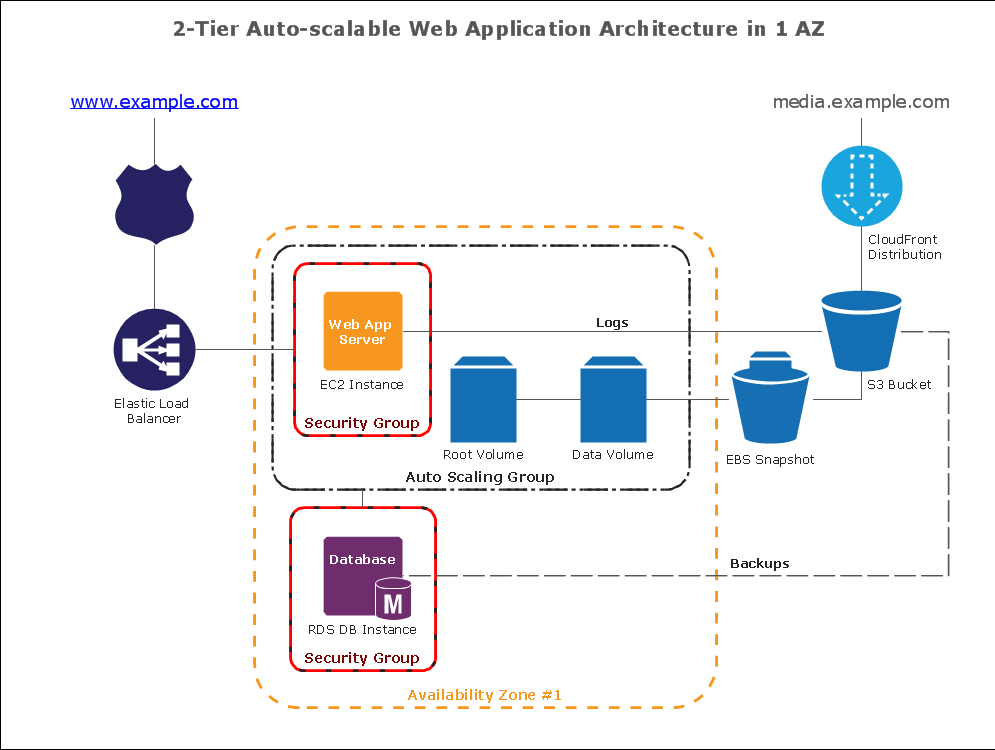
Picture: How To create Diagrams for Amazon Web Services architecture
