Made with
ConceptDraw
DIAGRAM 18

Create Response Charts

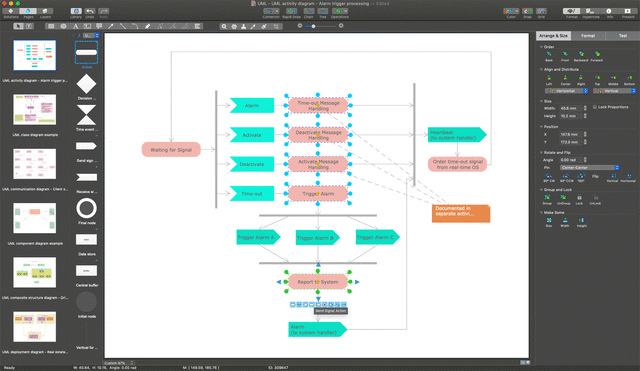
Interactive Flowcharts can change the way one creates and organizes their social media response process. ConceptDraw DIAGRAM provides tools to develop a response flowchart that can be connected with Action Mindmaps. Visual navigation through the stages of a response process helps you locate specific actions to be taken via Action mindmaps.

Action Mindmaps can be used to describe primary messages and good additions, show examples of messages, and also define the main objective of messaging for a specific situation. Using a combination of Interactive Flowcharts with Action Mindmaps helps professional social media teams be more proactive by being prepared with proper responses.

Social Media Response solution minimizes Time to Response, improves the quality of responses, and assists in your entire marketing strategy.

The response process consists of three major stages. These stages are easy to identify: review an input, evaluate specifics of the case, and respond.

They can be visualized by three vertical columns (swim-lanes) which collect the items identified for the appropriate stage.

The review stage is involved in assessment of the first impressions from received inputs. The evaluation stage is used when making decisions for the case you are dealing with. The response stage is intended for choosing the proper responsive action to take.

A response Action Mindmap organizes actions, scripts, advice, and work examples into a one-page visual assistant, useful for dispersing out to a team.

An Action Mindmap contains four major branches helping determine a responsive action - Primary Messages, Good Additions, Examples, and Objective.

Connecting items between a response process flowchart and Action Mindmaps is as easy as assigning hyperlinks to objects.

The solution provides a set of special symbols (“Action Mindmap” objects) intended to be used on flowcharts to symbolize connections and hyperlinks with Action MindMaps. These objects contain hyperlinks to mind map documents and can be titled and colored on the flowchart. When modifying a response process, these objects can be easily moved (drag-and-drop) between flowchart items without any need for editing. This helps provide meaning for the newly constructed response process as it refers to the same Action MindMap and will be used during other steps of the process.

From a practical stand point, “Action Mindmap” symbols are a great time-saver which makes reworking the response process much easier.

Critical steps one must take when developing a Social Media Response Flowchart are creating a flowchart, distributing Action symbols on the flowchart items, creating a set of Action Mindmaps, and assigning hyperlinks for Action symbols.

Flowcharts can be developed in any sequence. The critical steps involved in creating a flowchart can be completed in whatever order works for your team, whether you choose to start by identifying Action Mindmaps or you choose to first develop the flowchart describing the bigger picture of how you want to organize your social media response process. If your response process is part of a larger project and you also want to work with a Gantt chart, you may also incorporate ConceptDraw Project in order to connect Action Mindmaps with project Gantt charts.

Now organizing the response process for social media teams can be quicker and easier. Interactive flowcharts help to facilitate the training of your team, increase the quality of your responses, and will make you more prepared and proactive when responding to occurrences in social media.

See also Videos:

  • Organizing and Selecting Social Media Response Action
  • How to Prepare Learning Presentations for Training
  • How to Present a Social Media Response Plan to Your Team
  • What Is an Action Mind Map
  • How to Connect Social Media Flowchart with Action Maps

  • Create Response Charts *

    Sample 1. Social media activity of a real estate agent flowchart.

    Use a flowchart to detail all variants of response. This chart looks at what to do in case of positive or negative feedback.

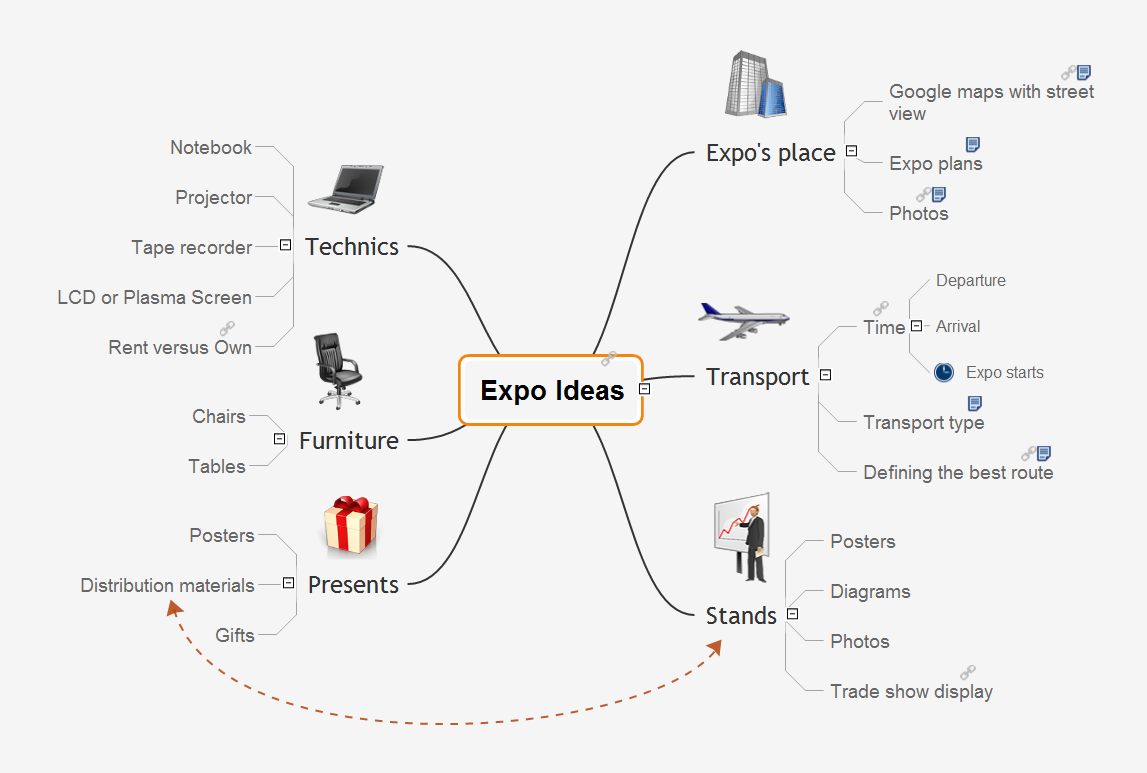
    The Interactive Flowcharts and Action Mind Maps demonstrate the solutions utilization, and management documents you can create using this solution.


    NINE RELATED HOW TO's:
    The ConceptDraw Flowchart component includes a set of samples and templates. This geathered as flowchart maker toolbox which focused on drawing flowcharts of any industry standards.Flowchart Components
    Picture: Flowchart Components
    Related Solution:
    An example of marketing analysis diagram, can be used to analyse product market and define marketing strategy.Marketing Analysis Diagram *
    Picture: Marketing Analysis Diagram
    Related Solution:
    Pyramid chart example is included in the Pyramid Diagrams solution from Marketing area of ConceptDraw Solution Park.Pyramid Diagram *
    Picture: Pyramid Diagram
    Related Solutions:
    ConceptDraw DIAGRAM enhanced with Flowcharts Solution is the best flow chart maker online design software. Use it to ✔️ create clear and actionable Flowcharts, ✔️ improve decision-making, ✔️ enhance problem-solving in various scenarios, ✔️ enhance creativity and productivity across industries, ✔️ streamline workflowsFlow Chart Online
    Picture: Flow Chart Online
    Related Solution:
    ConceptDraw DIAGRAM is the world’s premier cross-platform business-diagramming tool. Many, who are looking for an alternative to Visio, are pleasantly surprised with how well they can integrate ConceptDraw DIAGRAM into their existing processes. With tens of thousands of template objects, and an easy method for importing vital custom objects from existing Visio documents, ConceptDraw DIAGRAM is a powerful tool for making extremely detailed diagrams, quickly and easily.ConceptDraw DIAGRAM : Able to Leap Tall Buildings in a Single Bound *
    Picture: ConceptDraw DIAGRAM : Able to Leap Tall Buildings in a Single Bound
    Related Solution:
    This sample was created in ConceptDraw DIAGRAM drawing software using the Flowcharts solution.Horizontal Flowchart
    Picture: Horizontal Flowchart
    Related Solution:
    Create bar charts for visualizing problem solving in manufacturing and economics using the ConceptDraw DIAGRAM diagramming and vector drawing software extended with the Bar Graphs Solution from the Graphs and Charts area of ConceptDraw Solition Park.Bar Diagrams for Problem Solving. <br>Create manufacturing and economics bar charts with Bar Graphs Solution *
    Picture: Bar Diagrams for Problem Solving. Create manufacturing and economics bar charts with Bar Graphs Solution
    Related Solution:
    IT world is extremely rational and logical. So what can be more precise than Software Diagrams to rate the results of work? Visual statistics is the best way to understand the data. This figure demonstrates the data flow diagram (DFD), which was created to describe the electronic system of custom purchase. This is the process of buying using electronic bar code scanning system. Such systems are used in large stores. The cashier scans the bar code, the system outputs the data on the price of the goods and carries out a purchase process. This DFD utilizes the Gane/Sarson notation. To create it The ConceptDraw DFD solution has been applied.Software Diagrams
    Picture: Software Diagrams
    Using diagrams, you can visualize the flow of the information or build a detailed data structure. There's no need to have a degree in software and database design with ConceptDraw DIAGRAM , because this software has all the tools needed in developing models and diagrams. Project planning, designing and prototyping was never so easy. This UML diagrams can be used to visualize a model of the data base development process. A UML diagram shows a graphical view of a structure of software system: components and relationships. Using Unified Modeling Language helps to depict logical and physical elements of a data base, visually represent requirements and sub-systems. UML diagrams allows developers to organize and predict critical issues, as well as collaborate data base information.Software and Database Design with ConceptDraw DIAGRAM  *
    Picture: Software and Database Design with ConceptDraw DIAGRAM
    Related Solution:
    ConceptDraw
    DIAGRAM 18