Made with
ConceptDraw
DIAGRAM 18

Software and Database Design with ConceptDraw DIAGRAM

Design and document development of projects using a wide range of pre-drawn shapes, smart connectors and flowchart symbols. Develop visualization solutions with the help of the built-in scripting language.

ConceptDraw DIAGRAM is a perfect tool for:
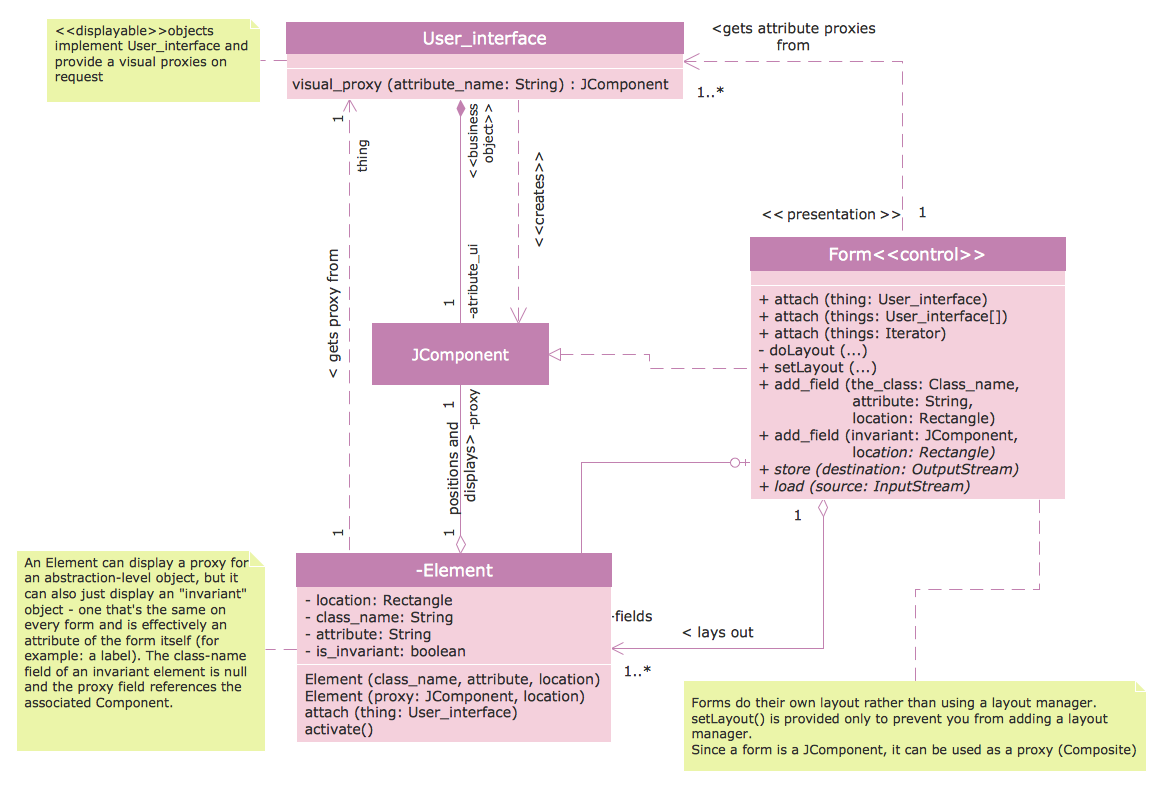
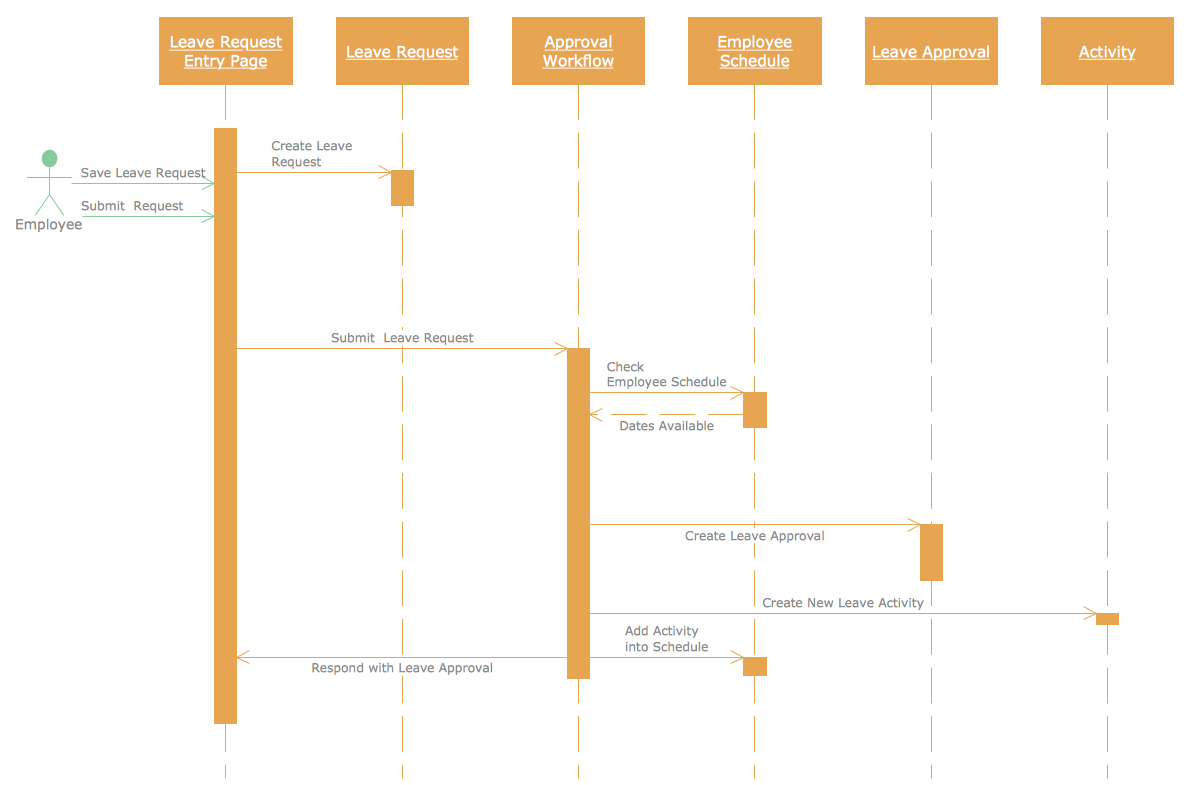
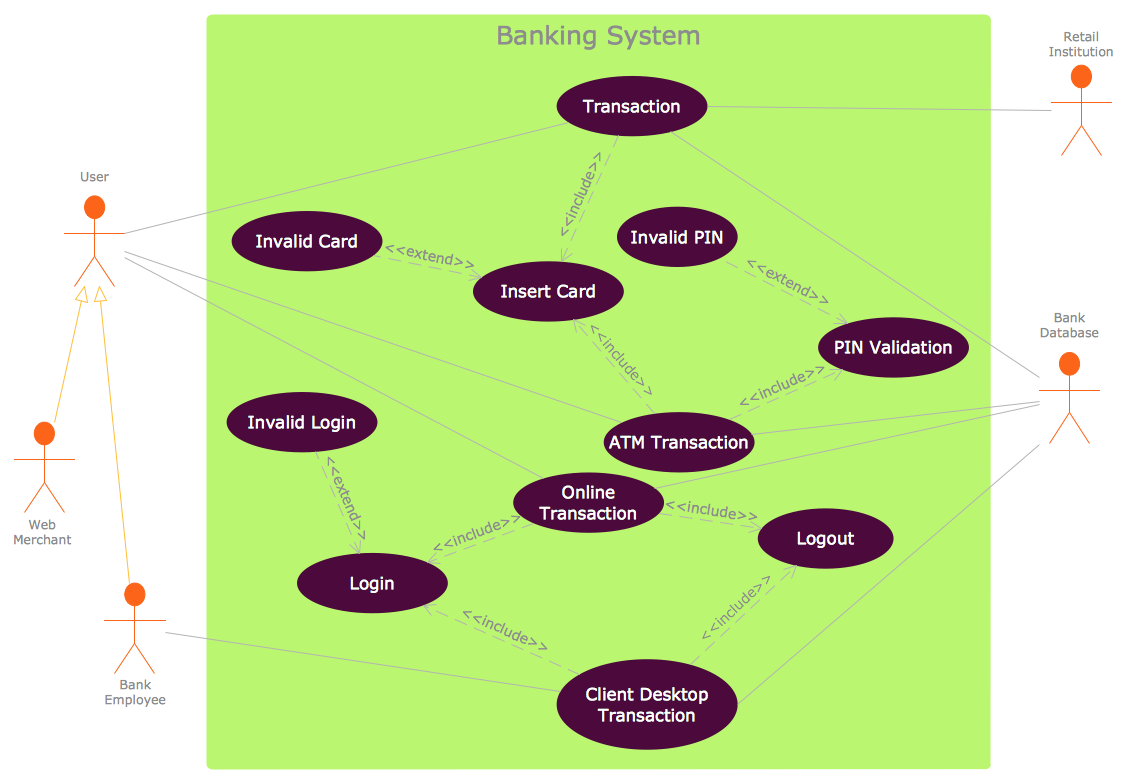
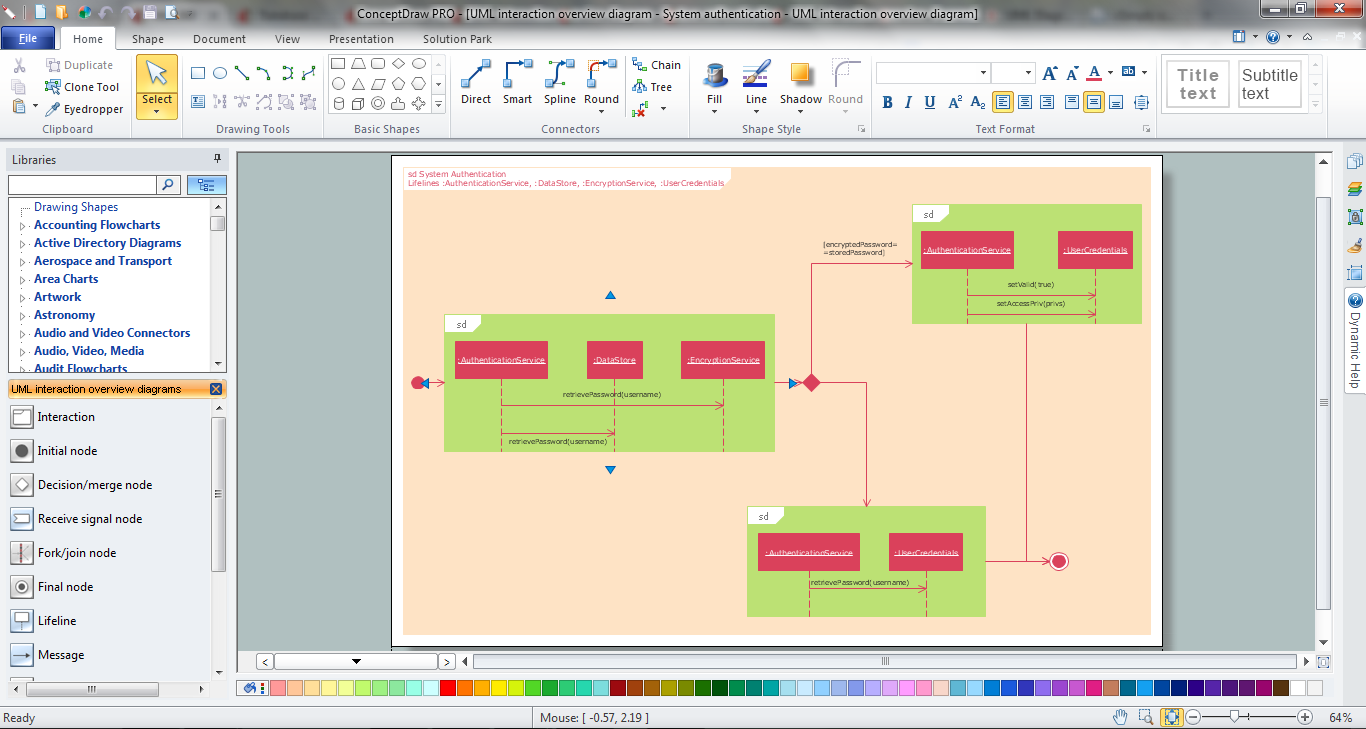
  • Designing and planning tasks such as:
    • UML Diagramming
    • Designing and prototyping Graphical User Interface (GUI)
    • Flowcharts, Data flow diagrams
    • Database and ERD Diagramming (Chen ERD, Database Model diagram, Express-G, Martin ERD, ORM Diagrams and more)
    • SSADM Diagrams, Booch Diagrams, Nassi-Shneiderman Diagrams
  • Developing Visualization Solutions
  • Project Planning (Gantt Charts, Timelines, Project Schedules)

Useful Articles:

UML Diagramming

ConceptDraw DIAGRAM includes collections of industry-standard UML diagramming libraries for drawing all types of diagrams: class, object, use case, sequence, collaboration, state chart, activity, component (package), and deployment.

UML Class diagram UML Class-diagram UML_Sequence diagramUML Sequence-diagram UML Use Case diagramUML Use-case-diagram
Designing and prototyping Graphical User Interface (GUI).

Mac Interface Sample

Thanks to Mac OS and Windows library interface elements ConceptDraw DIAGRAM is a perfect visual designing tool for project managers and software engineers that make designing and prototyping of dialog boxes, user interfaces a lot easier.

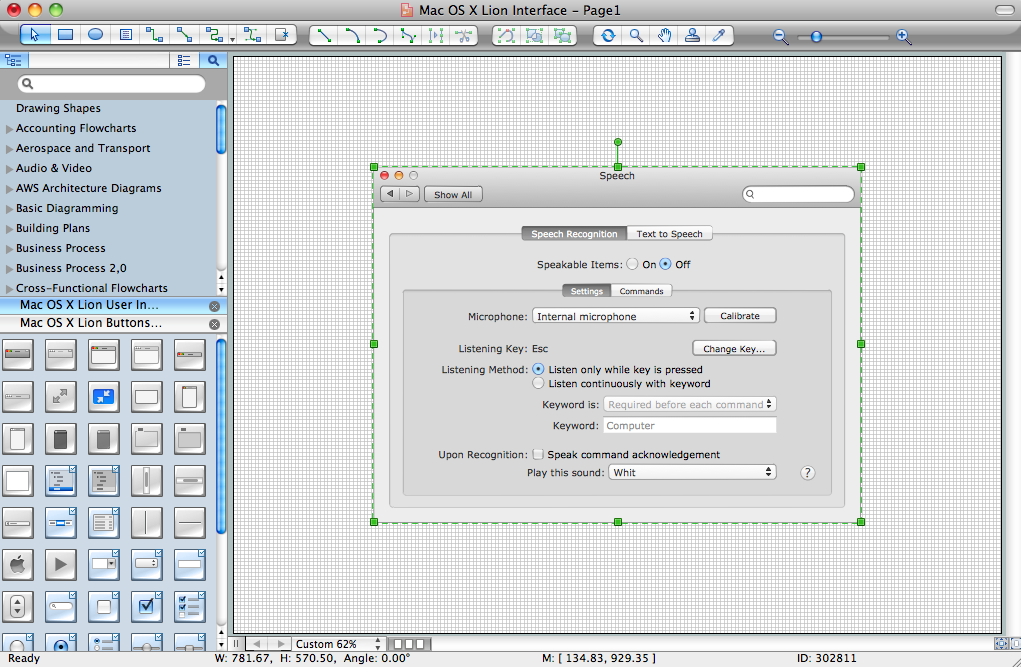
ConceptDraw DIAGRAM has a dizzying array of widget libraries for GUI prototyping that include all graphics for icons, menus, buttons, selection boxes, dialogs, forms, scroll bars, and other design elements... read more

Flowcharts and Data flow diagrams

Data Flow Sample

ConceptDraw DIAGRAM is a perfect tool for drawing various types of flowcharts and dataflow diagrams such as audit flowcharts, data flow diagrams, cause & effect diagrams, cross-functional flowcharts, Opportunity Flowchart, Deployment Flowchart and Process Flowchart.

ConceptDraw DIAGRAM offers task-specific templates, libraries of flowcharting shapes, smart connectors etc. to illustrate complex processes, procedures and information exchange.

Database and ERD diagramming

Thanks to an extensive set of library objects such as entities, links, items, attributes, users, types, captions, inheritance, references, boundaries, events, clouds etc ConceptDraw DIAGRAM is a perfect tool for database design and ERD diagramming.

You can also use ConceptDraw DIAGRAM to draw Chen ERD, Database model diagram, Express-G, Martin ERD, ORD Diagram and a lot more.

Sample Database Layout

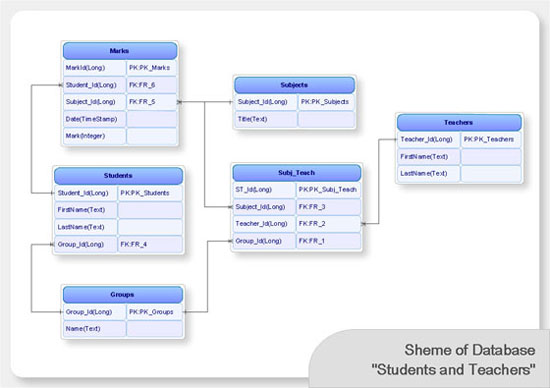
With ConceptDraw DIAGRAM you can visually design schemas for leading clients/servers and desktop databases. By graphically showing the relationships between information tables stored in the database a database diagram helps to ensure that the database you are designing is accurate, complete and efficient. ConceptDraw DIAGRAM allows you to visually create Entity Relationship diagrams (ERD) for various database systems.

The software product supports ODBC-compatible databases (Oracle, MS SQL, InterBase, MySQL, MS Access, Firebird and others). The built-in scripting language allows to connect to ODBC-compatible databases and automatically generate the database structure (reverse engineering of the database structure).

Moreover, data flow between tables can also be easily described by creating appropriate Data Flow Diagrams (DFD).

Cross-DBMS target compatibility allows you to design once and use for all.

Creating Visualization Solutions

Using the built-in scripting language, database connectivity, shape parameter table, support of shape custom properties, XML format allows to use ConceptDraw to visualize data from various applications and data sources. With the introduction of ConceptDraw Basic technology ConceptDraw becomes one of the most powerful platforms for your custom visual solutions.

Software and Database Design with ConceptDraw DIAGRAM  *


TEN RELATED HOW TO's:
It’s very important that your basketball illustrations looked bright, beautiful, interesting and attracted the attention. For this you just need to add the illustrations! The Basketball solution delivers two libraries with predesigned vector clipart objects. Simply drag the needed clipart to your diagram to make it successful.Basketball  Illustrations *
Picture: Basketball Illustrations
Related Solution:
This sample shows the Use Case Diagram of parking lot control system. On this sample you can see use cases represented as ovals and three actors represented as figures of persons that employ these use cases. Associations between actors and use cases are shown as lines. UML Diagram of Parking - This diagram can be used for understanding the process of working the car parking, at the projection and construction the parking by building companies and for automation the existing parkings.UML Diagram of Parking *
Picture: UML Diagram of Parking
Related Solution:
This sample shows the Flowchart that displays the architecture of SQL Exception Translation. This sample was created in ConceptDraw DIAGRAM diagramming and vector drawing software using the Flowcharts solution from the Diagrams area of ConceptDraw Solution Park.Sample Project Flowchart. <br>Flowchart Examples *
Picture: Sample Project Flowchart. Flowchart Examples
Related Solution:
No security system cannot be constructed without detailed security plan, or even a set of plans in some cases. ConceptDraw DIAGRAM software offers the Security and Access Plans Solution from the Building Plans Area to help you design the Security Plans for any premises and of any complexity.Security Plans *
Picture: Security Plans
Related Solution:
ER-modeling nowadays is a very popular approach for database design. If you are tired of looking for a good entity relationship diagram Software for Mac, then your search is almost over. ConceptDraw DIAGRAM is a great tool for creating diagrams of any complexity with tons of editable samples and templates. This diagram represents the vector library of the Chen’s and Crow’s Foot notation icons for drawing ERD (entity-relationships diagram). ConceptDraw Entity Relationship Diagram solution delivers the ability to visualize databases structure on both Mac and PC. The "bricks" entity-relationships models are the entity, and the relation. An entity is represented by a rectangle comprising the entity name. It means an object, information about which should be available and stored. A relation is intended to show a relations between two entities. There are several types of relations between entities. To show there are a number of different symbols for the types of relationships.Entity Relationship Diagram Software for Mac *
Picture: Entity Relationship Diagram Software for Mac
Related Solution:
Designing a workspace or office involves careful consideration of form and function. Conceptdraw offers you all nessesary office design elements in one library. Combine, match, design and create!Office - Design Elements *
Picture: Office - Design Elements
Related Solution:
ConceptDraw DIAGRAM diagramming and vector drawing software extended with Computer Network Diagrams Solution from the Computer and Networks Area offers a set of useful tools, collection of templates, samples, and libraries of various computer symbols, computer devices icons, computer network icon for fast and easy drawing network computer diagrams and illustrations.Network Icon *
Picture: Network Icon
Related Solution:
Learn the most common process flowchart symbols used in business process diagrams and workflow charts. Includes symbol meanings, examples, and a practical reference table.Process flowchart symbols reference chart showing terminator, process, decision, input output, document and predefined process shapes
Picture: Process Flowchart Symbols: Meaning, Types and Examples
Related Solution:
Enjoy the flowcharting process with the intuitive interface and powerful tools of the user-friendly ConceptDraw DIAGRAM software: ✔️ represent algorithms, ✔️ break down complex processes, ✔️ display workflows, ✔️ show procedures, ✔️ succeed in decision-making, ✔️ streamline processes, ✔️ increase productivity, ✔️ enhance efficiencyThe Best Application for Flowcharts - ConceptDraw DIAGRAM
Picture: Flowcharting Software
Related Solution:
When trying to figure out the nature of the problems occurring within a project, there are many ways to develop such understanding. One of the most common ways to document processes for further improvement is to draw a process flowchart, which depicts the activities of the process arranged in sequential order — this is business process management. ConceptDraw DIAGRAM is business process mapping software with impressive range of productivity features for business process management and classic project management. This business process management software is helpful for many purposes from different payment processes, or manufacturing processes to chemical processes. Business process mapping flowcharts helps clarify the actual workflow of different people engaged in the same process. This samples were made with ConceptDraw DIAGRAM — business process mapping software for flowcharting and used as classic visio alternative because its briefly named "visio for mac" and for windows, this sort of software named the business process management tools. This flowchart diagram shows a process flow of project management. The diagram that is presented here depicts the project life cycle that is basic for the most of project management methods. Breaking a project into phases allows to track it in the proper manner. Through separation on phases, the total workflow of a project is divided into some foreseeable components, thus making it easier to follow the project status. A project life cycle commonly includes: initiation, definition, design, development and implementation phases. Distinguished method to show parallel and interdependent processes, as well as project life cycle relationships. A flowchart diagram is often used as visual guide to project. For instance, it used by marketing project management software for visualizing stages of marketing activities or as project management workflow tools. Created with ConceptDraw DIAGRAM — business process mapping software which is flowcharting visio alternative or shortly its visio for mac, this sort of software platform often named the business process management tools.Process Flowchart
Picture: Process Flowchart: A Step-by-Step Comprehensive Guide
Related Solution:
ConceptDraw
DIAGRAM 18