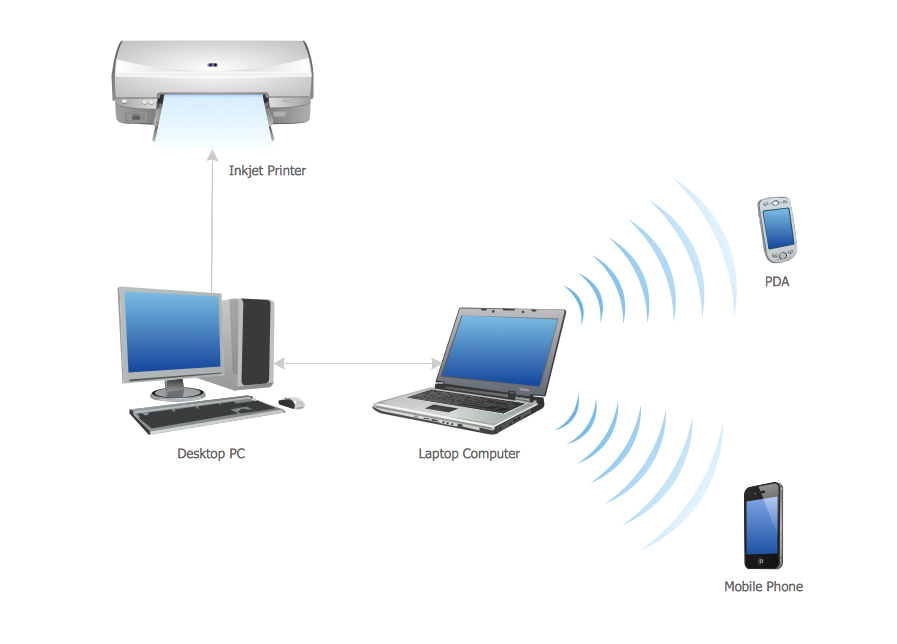
Example 1. Personal area (PAN) network.
Once you go to the Solutions section on this site, you will see our examples and templates of personal area network which can be very useful in terms of making your own diagram and to have the final version of it looking professional.
This example was created in ConceptDraw DIAGRAM using the Computer and Networks Area of ConceptDraw Solution Park and shows the Personal area network.

Example 2. Computer and Network Diagrams Solution
The network diagrams designed with ConceptDraw DIAGRAM are vector graphic documents and are available for reviewing, modifying, and converting to a variety of formats (image, HTML, PDF file, MS PowerPoint Presentation, Adobe Flash or MS Visio).
See also Samples:
TEN RELATED HOW TO's:
No need for any special drawing skills to create professional looking diagrams outside of your knowledge base. ConceptDraw DIAGRAM takes care of the technical side.
Use templates, samples and special libraries for your needs.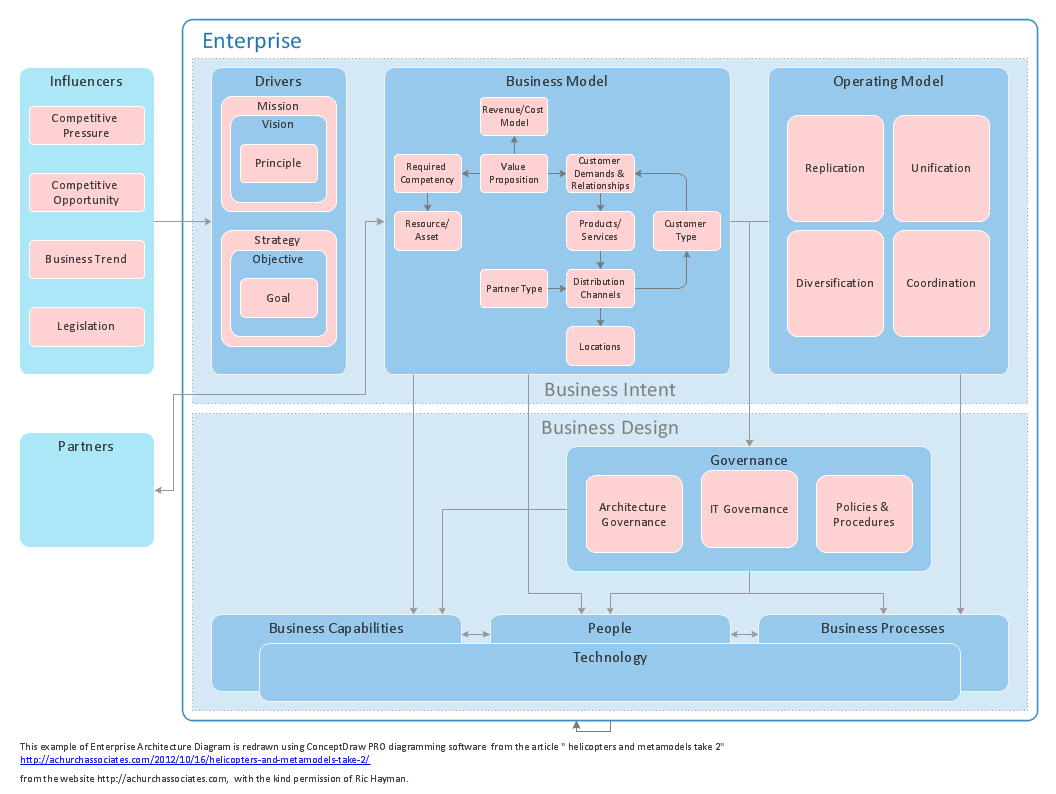
Picture: How To Create Professional Diagrams
A Mesh Topology is a computer network topology that is based on the cells concept, in which each workstation connects with several other workstations of the same network with the possible to accept the switch functions for other workstations.
This example was created in ConceptDraw DIAGRAM using the Computer and Networks solution from the Computer and Networks area of ConceptDraw Solution Park and shows the Mesh Network.
Picture: Mesh Network. Computer and Network Examples
Related Solution:
The network architecture and design specialization will help you gain the technical leadership skills you need to design and implement high-quality networks that support business needs.
Picture: Computer Network Architecture. Computer and Network Examples
The ConceptDraw vector stencils library Cisco WAN contains equipment symbols for drawing the computer wide area network diagrams.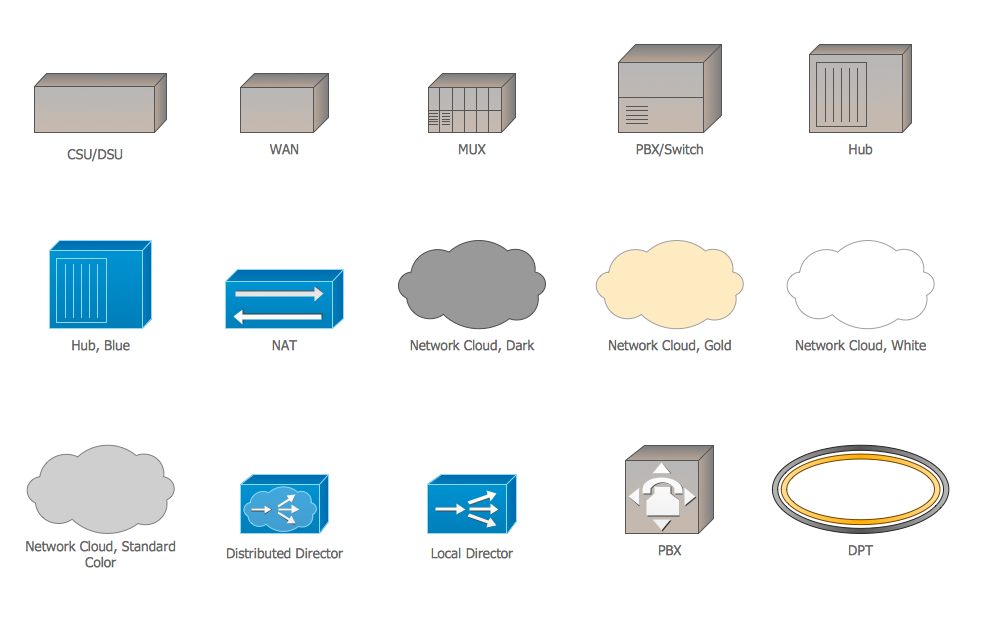
Picture: Cisco WAN. Cisco icons, shapes, stencils and symbols
Related Solution:
UML Diagrams Social Networking Sites Project. This sample was created in ConceptDraw DIAGRAM diagramming and vector drawing software using the UML Use Case Diagram library of the Rapid UML Solution from the Software Development area of ConceptDraw Solution Park.
This sample shows the Facebook Socio-health system and is used at the projection and creating of the social networking sites.
Picture: UML Use Case Diagram Example. Social Networking Sites Project
Related Solution:
What is a Concept Map and what software is effective for its design? A concept map or conceptual diagram is a diagram that depicts suggested relationships between concepts. As for effective software - we suggest you to pay attention for the ConceptDraw DIAGRAM diagramming and vector drawing software. Extended with Concept Maps Solution from the Diagrams Area it is a real godsend for you.
Picture: What Is a Concept Map
Related Solution:
ConceptDraw DIAGRAM is a powerful intelligent vector graphics engine that can be used to create basic diagrams including flowcharts, charts, workflows, flowcharts, organizational charts, business diagram, learn business diagrams, flow diagrams.
Picture: The Best Mac Software for Diagramming or Drawing
Related Solution:
As concept map consists from conception-blocks and links between them, you can use ConceptDraw library objects and add to a document as much objects as you need. ConceptDraw tools let you to edit, group, move objects, change their appearance and add text signs and raster or vector pictures.
ConceptDraw DIAGRAM diagramming and vector drawing software extended with Concept Maps Solution from the Diagrams Area is effective tool for creating professional looking Concept Maps.
Picture: Concept Maps
Related Solution:
Perfect Network Diagramming Software with examples of LAN Diagrams. ConceptDraw Network Diagram is ideal for network engineers and network designers who need to draw Logical Network diagrams.
Picture: Network Diagram SoftwareLogical Network Diagram
UML Communication Diagram depicts the interactions between objects or parts in terms of sequenced messages and describes both the static structure and dynamic behavior of a system.
Picture: Diagramming Software for Design UML Communication Diagrams
