ConceptDraw Basic Network library of vector stencils from Computer and Networks solution provides the 51 objects of design element for drawing the computer network diagrams.
Use the Basic Network library to create your own computer network diagrams that show LAN and WAN topology, equipment nodes and their logical and physical connections.
TEN RELATED HOW TO's:
All computer networks differ by various params, and their size is one of them. As global area networks are the biggest, personal area (PAN) networks are the smallest. Personal computers, smartphones and other devices that have possibility to connect to Internet form a personal network.
This diagram was created using ConceptDraw Computer Network Diagrams to represent a typical components of Personal area network. A personal area network (PAN) is the connection of IT devices around an individual person. This sample of personal area network involves a notebook, a personal digital assistant (PDA), and a portable printer. Commonly a PAN contains such wireless devices as mouse, keyboard, smartphone and tablet. A wireless connection is typical for a PAN.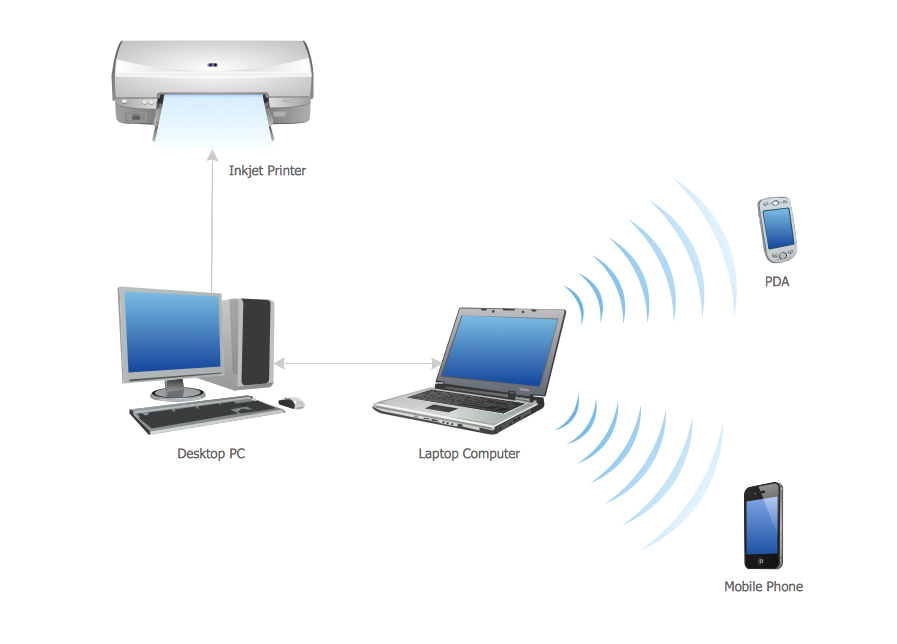
Picture: Personal area (PAN) networks. Computer and Network Examples
Related Solution:
ConceptDraw DIAGRAM is perfect for software designers and software developers who need to draw Computer&Network Diagrams.
ConceptDraw has 1004 vector stencils in the 40 libraries that helps you to start using software for designing own Network Diagrams. You can use the appropriate stencils from Computer and Network Diagrams library with 56 objects..png)
Picture: Design Element: Computer and Networkfor Network Diagrams
Related Solution:
ConceptDraw DIAGRAM is perfect for software designers and software developers who need to draw Rack Diagrams..png)
Picture: Design Element: Rack Diagramfor Network Diagrams
Garrett IA diagrams are used at development of Internet-resources, in particulars at projecting of interactions of web-resource elements. The diagram of information architecture of the web resource which is constructed correctly with necessary details presents to developers the resource in comprehensible and visual way.
Picture: Garrett IA Diagrams with ConceptDraw DIAGRAM
Event-Driven Process Chain Diagrams for improvement throughout an organisation.
ConceptDraw DIAGRAM - software that reduces the time needed to create a business process model.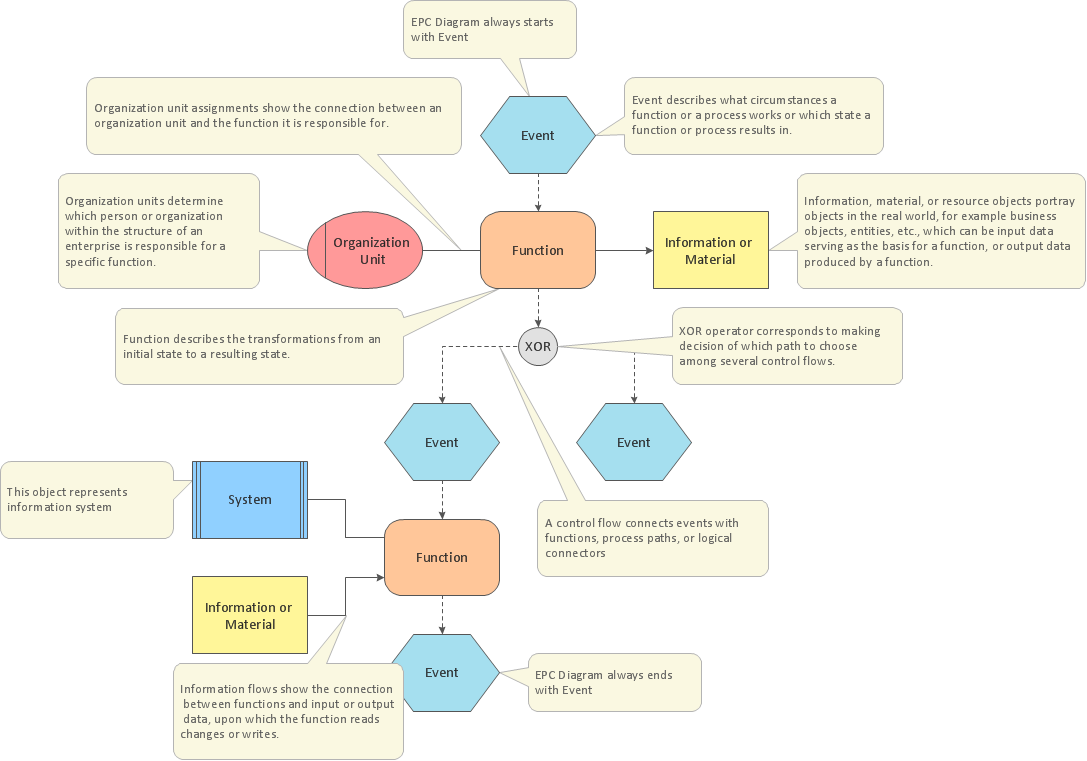
Picture: EPC for Business Process Implementation
Related Solution:
Working with disordered network data can be quite exhausting. Sometimes it's necessary to find a network diagramming software to design Cisco network diagrams that would be easy to use and would be able to export diagrams to various graphic formats. ConceptDraw DIAGRAM is a great diagramming tool that is able to perform all these tasks easily.
This vector library represents a set of 26 objects depicting the manufacturer - standard equipment of Cisco switches and hubs. This is only a small part of the vector graphic objects of Cisco equipment that comprise the Cisco Network Diagrams solution. In full the ConceptDraw Cisco Network Diagrams solution has 15 libraries, containing more then 500 objects to create a Cisco network diagrams. They can be used by IT specialists and corporative IT divisions, system and network administrators to make the visual documentation of Cisco networks topology.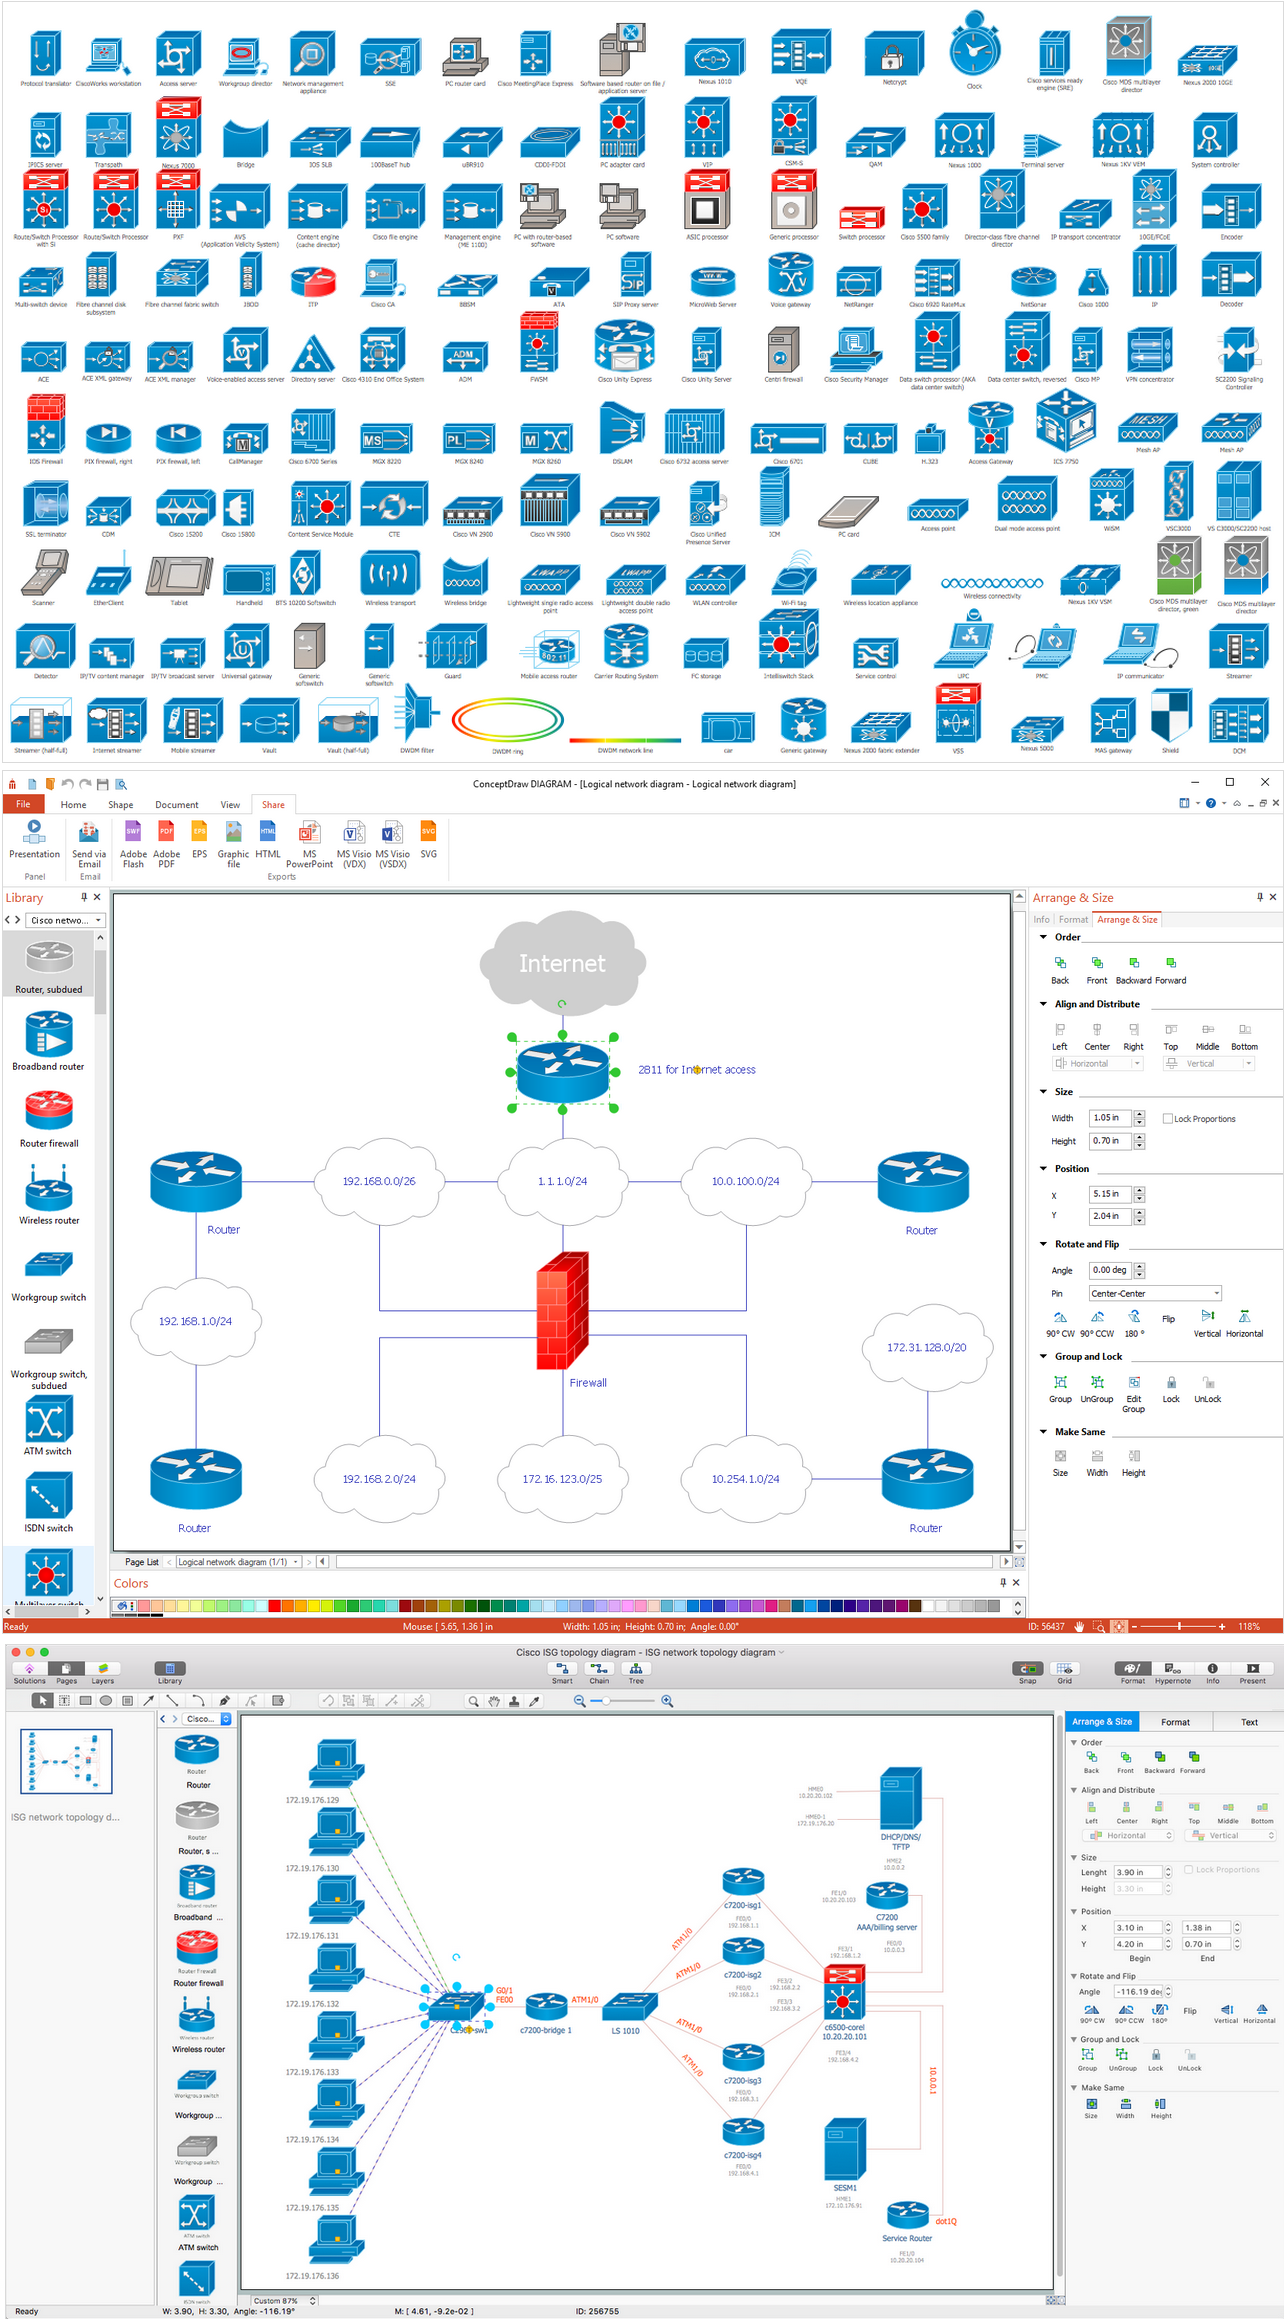
Picture: Network Diagramming Software for Design. Cisco Network Diagrams
Related Solution:
The Ring Network Topology Diagram examples was created using ConceptDraw DIAGRAM software with Computer and Networks solution.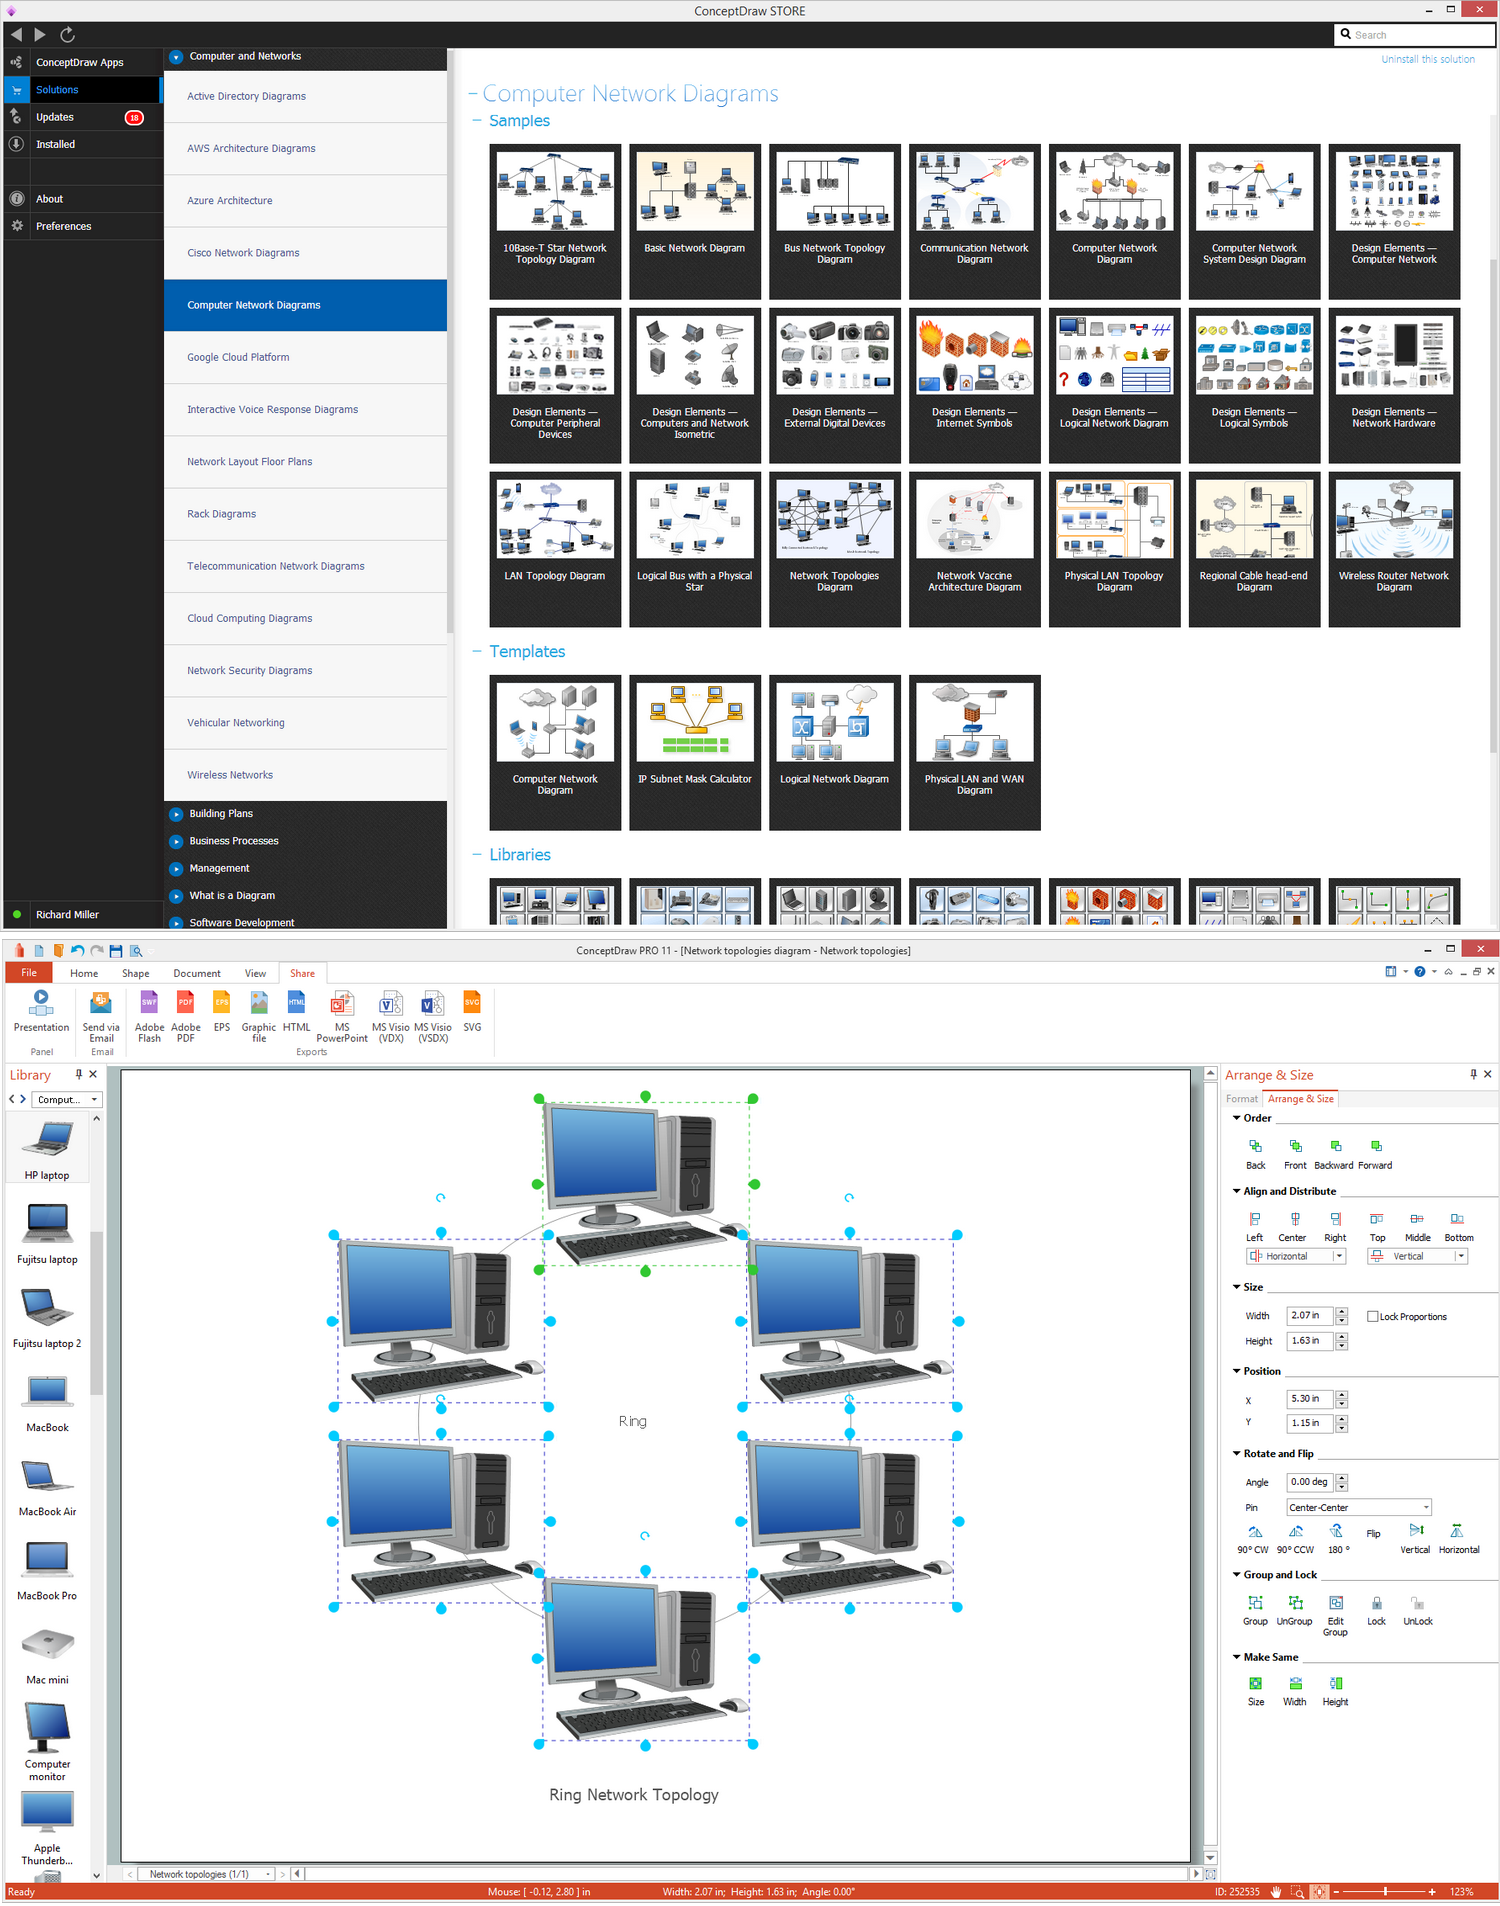
Picture: Ring Network Topology
Related Solution:
Perfect Network Diagramming Software with examples of LAN Diagrams. ConceptDraw Network Diagram is ideal for network engineers and network designers who need to draw Logical Network diagrams.
Picture: Network Diagram SoftwareLogical Network Diagram
Cisco switches and hubs deliver the best performance, and often used as network solutions for small businesses, enterprises, data centers. Cisco switches are the core interconnect devices of each computer network. The numerous Cisco switches specifically designed for various applications. Network switches are separated for two types: fixed configuration and modular switches. The fixed configuration switches deprecate swapping or adding another module, and vice versa for modular switch.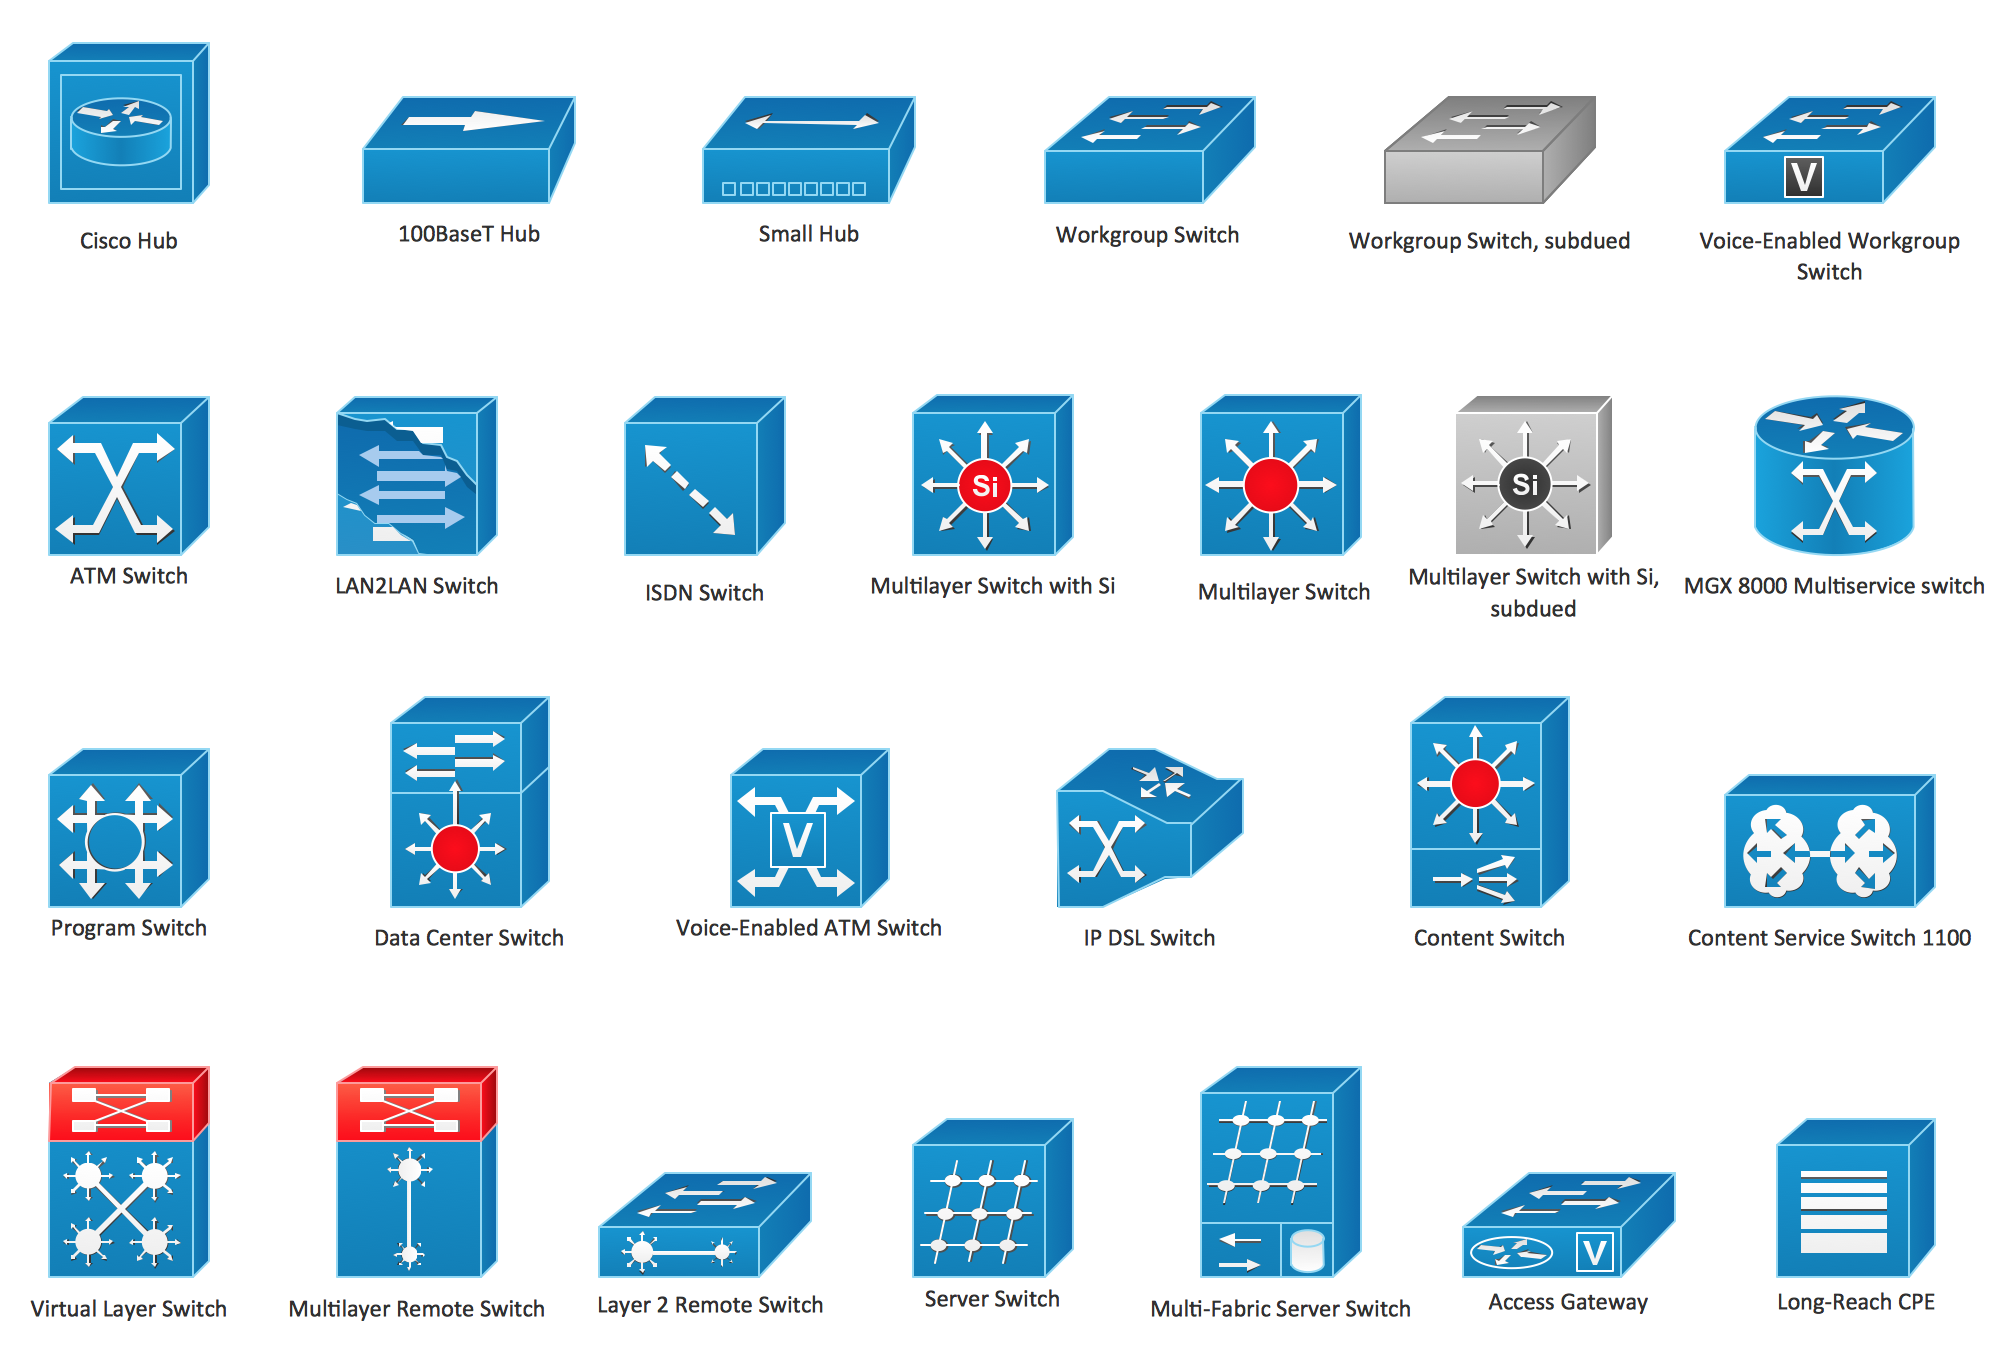
Picture: Cisco Switches and Hubs. Cisco icons, shapes, stencils and symbols
Related Solution:
Draw Network Topology and Computer Network Diagrams, Designs, Schematics, and Network Maps using ConceptDraw in no Time!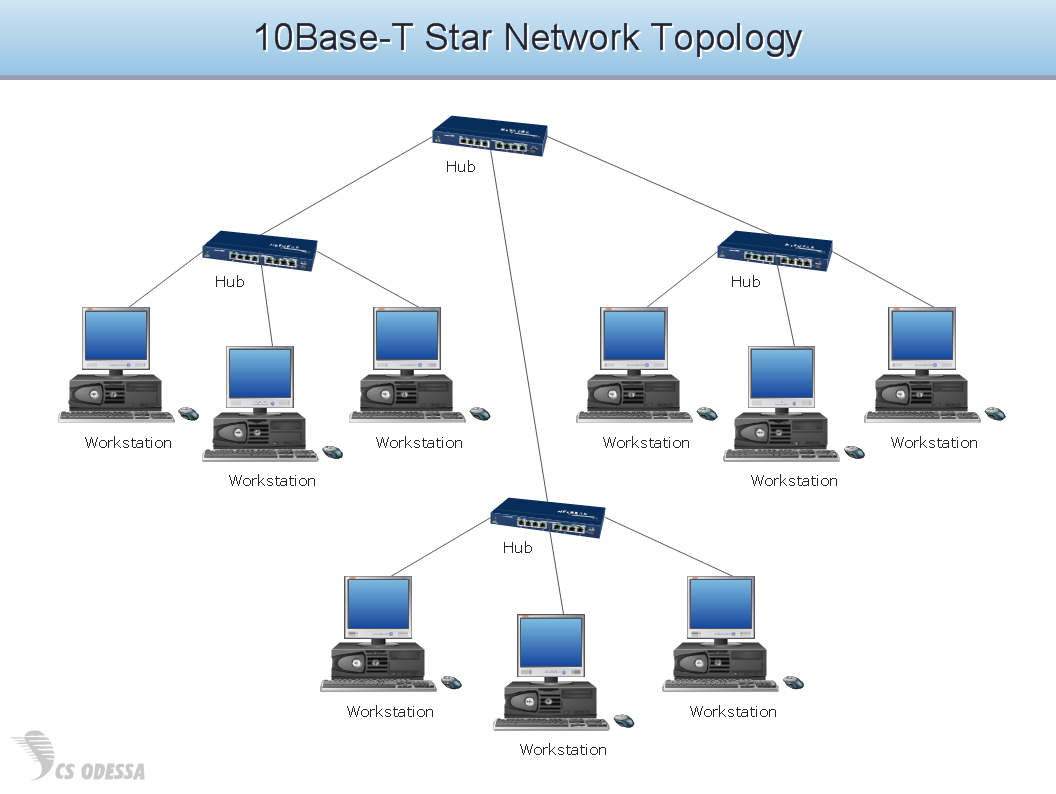
Picture: Network Diagram SoftwareTopology Network
_Win_Mac.png)