Software Diagrams
Development of Software with ConceptDraw DIAGRAM
ConceptDraw is a tool for technical and business graphics. It provides specialists who create graphic documentation with a possibility to focus not on the process of drawing itself but on the essence of the task. For this ConceptDraw features a huge number of ready-to-use objects (4590 for the moment of writing the article), smart connectors, layers, hyperlinks and many other possibilities.
Design and document development of projects using a wide range of pre-drawn shapes and smart connectors. Develop visualization solutions with the help of the built-in scripting language.
ConceptDraw DIAGRAM is a perfect tool for:
- Designing and planning tasks such as:
- Jacobson Use Cases Diagram
- SSADMN Diagram
- Yourdon and Coad Diagram
- Command OLE Diagram
- Block Diagrams
- Data Modeling Diagram
- SysML Diagram
- Chen RED Diagram
- Martin RED Diagram
- IDEF0 Diagram
- Booch OOD Diagram
- Gane Sarson Diagram
- Memory Object Diagram
- Data Flow Diagram
- FlowCharts
- Graphic User Interface (GUI)
- UML Diagram
- Program Structure Diagrams
- ORM Diagram
Modern development of program software leads to a large amount of graphic documentation: diagrams describing the work of applications in various cuts and notations, GUI design, documentation on project management. Each of these fields is represented by topical libraries and templates.
To ConceptDraw DIAGRAM new possibilities have been added, thanks to which the program became a sequence higher useful for developers. The most considerable innovations are:
- a set of wizards for automation of widespread tasks built-in scripting language, which helps to automate tasks specific for your
- particular situation.
Let us consider typical applications.
Object-oriented design
Over the recent years object-oriented methodology has become more and more widespread. Thanks to this methodology developers manage to deal with growing complexity of applications. More and more programs are written in such programming languages as C++, Java, Visual Basic and Object Pascal. However, the complexity of the designed systems imposes extended requirements as to design of graphic documentation. ConceptDraw possesses powerful tools for designing of technical documentation for object-oriented projects. The libraries included in the package allow to easily draw class hierarchies, object hierarchies and diagrams of data flows with the use of the most popular notations, including UML and Booch notations. And the library for projecting COM-interfaces will spare developers of ActiveX-servers a headache.
Flowcharts of algorithms and business-processes
Flowcharting is a conventional way of recording algorithms in a graphic form. ConceptDraw is an ideal means for their creation. Easiness of flowcharting in ConceptDraw is really impressive. This functionality is useful for students and teachers of informatics.
At development of real application flowcharts are widely used for clearing processes on which business-logics of the application will be based.
Prototyping Graphical User Interface (GUI)
ConceptDraw allows to more tightly draw art designers, managers and users to the process of GUI design. Now libraries of controls for Windows XP, MacOS and MacOS X are available to all of them and they can share their vision of Windows, menu and web-forms on various platforms with developers.
Project management
For a large-scale project to be completed successfully it should be thoroughly projected. One of the generally recognized and visual tools for projecting and tracking timeliness of the work on a project is a Gantt chart. ConceptDraw offers the wizard for automatic creation of Gantt chart.
The other side of the question of project management is the dynamism of changes. Changes in a project and its documentation are made daily. All updates should be done in time and be available to each developer. ConceptDraw offers many methods of solving this question:
- Cross platform compatibility. ConceptDraw is released in two versions: for PC and for Mac. Its files can be easily read by the both versions. It means you can exchange documents with your colleagues and partners working on different platforms.
- Export to HTML provides the possibility of getting a set of ready web-pages based on a ConceptDraw file, which can be displayed in intranet or Internet for all who care.
- Export to PDF and graphic formats are designed, first of all, for sending information via e-mail.
Automation of management and development process
ConceptDraw DIAGRAM supports XML. XML for ConceptDraw has been created and, at the same time, support for import XML for Visio. All this allows to develop solutions for automation of various aspects of software development.
For instance:
- generation of UML diagrams etc. on the ready initial code
- generation of the initial code
- generation of resources for Windows and MacOS, web-forms
- and a lot more
Visualization of data
ConceptDraw is a good means for visualization of information of any kind. The program features powerful graphic possibilities. Thus, on the ready graphic kernel ConceptDraw the rest products of the line have been developed: ConceptDraw PROJECT, ConceptDraw MINDMAP This powerful graphic kernel (2D-graphics) is supported by a number of open formats (including XML). To this add the flexibility of data processing, connected with the scripting language ConceptDraw Basic (included in version V), and also the flexibility in parameterization of objects, which is provided by the whole table of the object parameters (which is available for editing even from the program's interface). So in the end it becomes clear that visualizing of information in ConceptDraw is a good idea.
So, the typical task for ConceptDraw Basic is to automate the visualization of some data. This data can be obtained as the result of work of an arbitrary application (including ConceptDraw-script) and saved in a text file, ODBC-compatible database or in one of the open formats supported by ConceptDraw. In the first two cases, data will further be read and visualized with the help of ConceptDraw Basic. In case of using a ConceptDraw open format (XML for ConceptDraw or XML for Visio) the obtained document can be simply opened in ConceptDraw, you can then add some details of design and get a presentable diagram. Possibilities of ConceptDraw Basic considerably increase at using in script the functions exported by the shared libraries.
The conclusion is: ConceptDraw is a platform worth considering for writing solutions, connected with data visualization.
Work with databases
Special attention has been given to work with databases. There are libraries for designing databases in various notations: ORM, Chen ERD and Martin ERD, Express-G and relational diagrams. Starting from version V, ConceptDraw supports ODBC-compatible databases. Interaction with them is possible with the help of the scripting language ConceptDraw Basic. Besides, in ConceptDraw Professional package there is Database Model Diagram wizard (it can be found among the templates of the section ERD & Database). It builds a model of an arbitrary presented by the user in the form of DSN database.
Having applied all said above about possibilities of ConceptDraw in fields of projection, automation and visualization of data, we can conclude, that the program is well designed for solving the following tasks:
- design of databases
- ORM-diagrams
- ER-diagrams
- relational diagrams
- reengineering of databases
- visual displaying of data in the form of charts and diagrams

Example 1. Data Flow Diagram
TEN RELATED HOW TO's:How to build segregation of duties using drawing tools from Accounting Flowcharts Solution for ConceptDraw DIAGRAM software.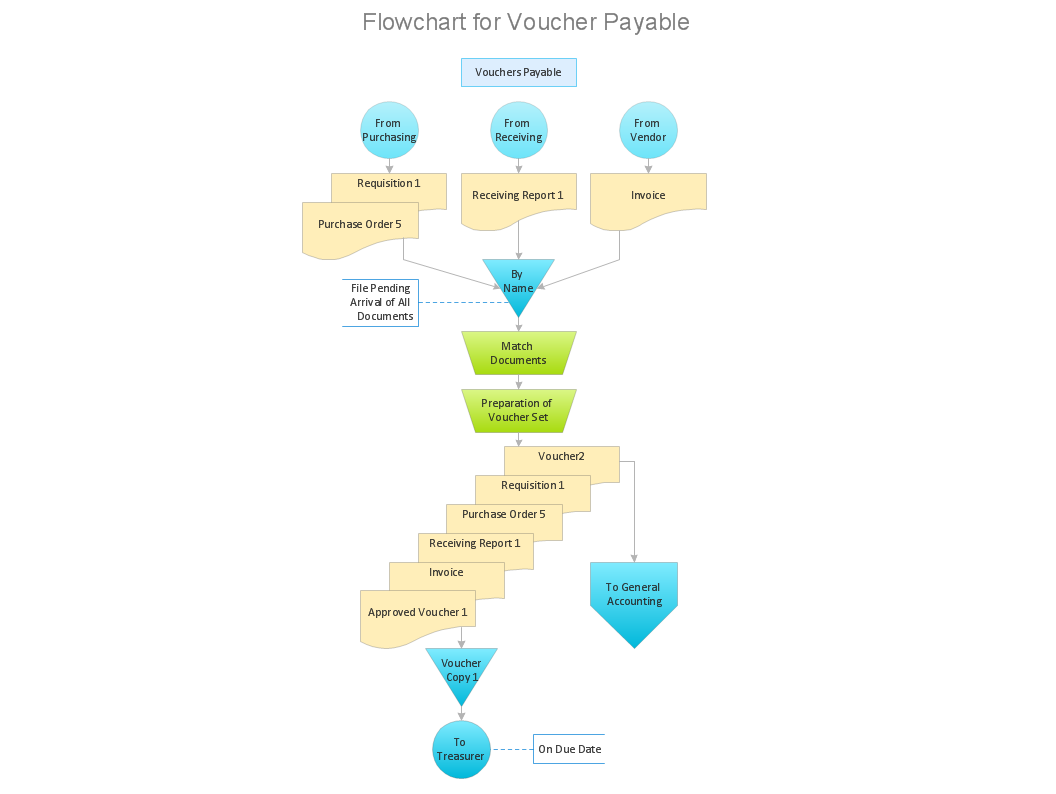 Picture: Approval Process and Segregation of ResponsibilitiesAccounting Flowchart ExampleRelated Solution:Venn diagrams are illustrations used in the branch of mathematics known as set theory. Use ConceptDraw DIAGRAM to quick and easy design your own Venn Diagram of any complexity.
 Picture: Venn DiagramRelated Solution:UML Package Diagram illustrates the functionality of a software system. ConceptDraw has 393 vector stencils in the 13 libraries that helps you to start using software for designing your own UML Diagrams. You can use the appropriate stencils of UML notation from UML Package library.
 Picture: UML Package Diagram. Design ElementsRelated Solution:Structure of a software product might get very complex and complicated, if software engineers did not pay much attention to the architecture of the product. It will take a few minutes to create UML diagrams with ConceptDraw DIAGRAM , because this software is just perfect for diagramming. You can alter ready-to-use templates, or make your own, whatever you need. This illustration represent the example of UML diagram made by using ConceptDraw Rapid UML solution. This activity diagram displays the stages of the software development process similar to a flow chart. This diagram depicts the states of elements in the software system. It can be applied to represent software and coding logic. This UML diagram was drawn with the help of the ConceptDraw Rapid UML solution which supplies the kit of vector libraries, containing the symbols of the Unified Modeling Language notations.
 Picture: UML Diagrams with ConceptDraw DIAGRAMRelated Solution:UML Collaboration Diagram Example Illustration. This sample was created in ConceptDraw DIAGRAM diagramming and vector drawing software using the UML Collaboration Diagram library of the Rapid UML Solution from the Software Development area of ConceptDraw Solution Park. This sample shows the creation process of the contact list and can be used at the staff training and staff working, at the attraction process the new clients.
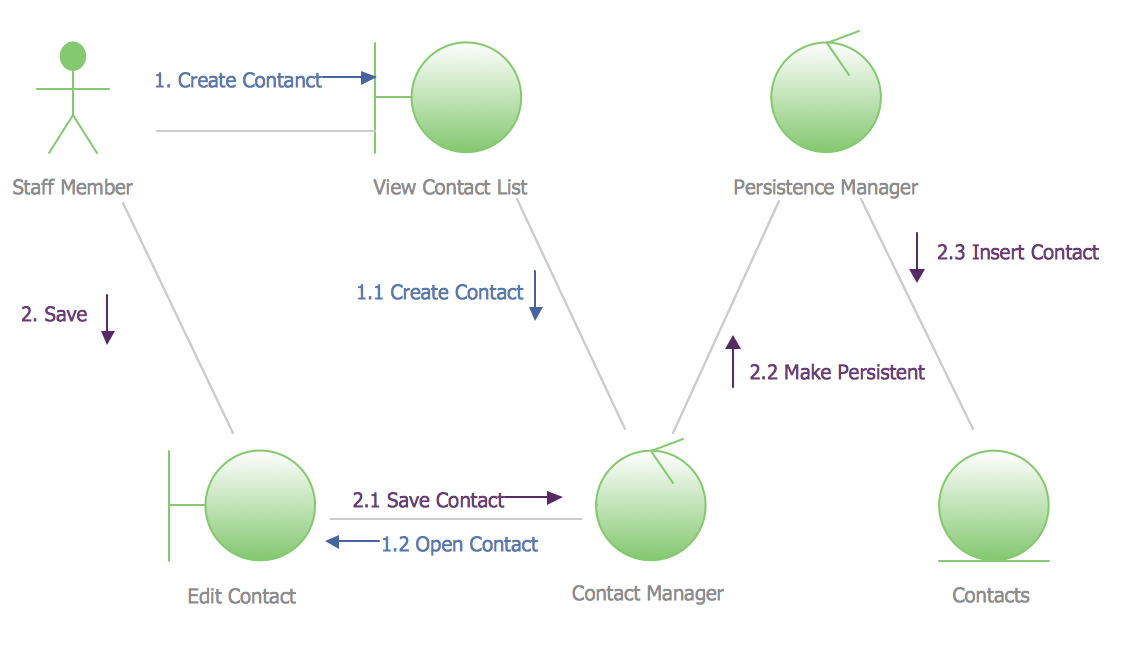 Picture: UML Collaboration Diagram Example IllustrationRelated Solution:A layout is a way that furniture is arranged in some place. It’s not difficult to develop a store layout using software with tons of templates and libraries with vector shapes of furniture, doors, walls etc. Create a plan in five minutes and have more time to implement it. Designing the floor plan for a new store is very important step for a small business. Well thought out and well-done floor plan is the foundation of the store layout. It should provide a basis through which to make out and organize everything else. Sometimes a small stores have a small floor space, so well thought out arrangement of furniture and commercial equipment is crucial to the success of the business. By using the ConceptDraw Floor Plans solution you can make a floor plan for your store quickly and effortlessly.
 Picture: Store Layout SoftwareRelated Solution:The Gantt Chart is the main interface in ConceptDraw PROJECT. It summarizes the tasks in your project and presents them graphically so you can easily view your progress.
 Picture: Gantt Chart SoftwareThe Cloud Computing is the use of the software and hardware that includes the great number of computers connected over the communication network such as the Internet. The Cloud name comes from the usage the cloud symbol on the system diagrams as the abstraction for the complex network infrastructure. This term is used as a marketing metaphor for the Internet. This example was created in ConceptDraw DIAGRAM using the Computer and Networks Area of ConceptDraw Solution Park and shows the Cloud Computing.
 Picture: Cloud ComputingRelated Solution:Event-Driven Process Chain Diagrams is using for improvement throughout an organisation. ConceptDraw DIAGRAM - software that reduces the time needed to create a EPC diagrams.
 Picture: The Building Blocks Used in EPC DiagramsRelated Solution:The vector stencils library COM and OLE from the solution Software Engineering contains 15 symbols of the COM and OLE objects for ConceptDraw DIAGRAM software.
 Picture: COM and OLE DiagramConceptDrawDIAGRAM 18