Martin ERD Diagrams
What is Martin ERD?
The result of any systematic analysis is expected to be an entity–relationship model, defining and describing what exactly is important in the processes of running any business, although it cannot be used for defining the business processes themselves, but only presenting the business data schemas in a way of a graphical form with help of such graphical objects as boxes representing entities being connected with help of lines representing the relationships and so expressing the dependencies as well as the associations between entities. It is interesting to know that any of the possibly existing entity–relationship models can always be represented in any verbal form.
All the entities within the entity–relationship model can be characterized whether by relationships or by the additional properties representing the “attributes”, including the identifiers known to be called as the "primary keys". All the diagrams created for representing the attributes and entities as well as the relationships can always be called the “entity-attribute-relationship diagrams” and they can always be created in ConceptDraw DIAGRAM software as it is one of the best tools existing for making such drawings.
The implementation of any entity–relationship model is a “database”. Each of the rows of a table in a such relational database implementation can represent only one instance of an entity type. At the same time each of the fields in a table can represent any needed attribute type. In a so called “relational database” a relationship between all the mentioned entities can be implemented in a way of storing the primary key of one entity as well as the so called "foreign key" in the table of different entity.
Usually the data models, such as the entity–relationship ones, are built at two-three levels of abstraction. One of the types of the data models existing and widely used is conceptual one. Being the highest level entity–relationship model, it contains the least granular detail. At the same time, it establishes all the scope of what has to be included in the existing model set. Such models usually define the so called “master reference data entities”. These master reference data entities are very widely and commonly used by different organizations working in so many different fields of the business activity. It is always very useful supporting documenting the data architecture for an organization by developing the conceptual entity–relationship models and so such models are used as the foundations for the logical data models which contain more detail to compare to the conceptual entity–relationship model.
There’s another type of the entity–relationship models which is a “physical ER” one. Such models can be developed from any logical entity–relationship model, being developed for a reason of being instantiated as a “database”. It is well-known that each of the physical entity–relationship models must contain enough details for producing a database. Also, every physical entity–relationship model is always technology dependent when every existing database management system is usually known to be very different from each other. The described physical models are usually instantiated to be created in the structural metadata of some database management system. They are normally created as the relational database objects. Such objects can be database indexes (for example, unique key indexes), database constraints (e.g., a commonality constraint or a foreign key constraint) or database tables.
Any entity–relationship model is usually used for designing different modifications for the relational database objects. It also can be used for maintaining the structural metadata of the needed database. At the same time, the data modelling technique can be used for describing any needed ontology for some particular area of interest. Thus, in case of designing some information system based on a database, the “conceptual data model” can be mapped to a “logical” one (for example the “relational model”). Sometimes both of the phases can be referred to as the so called "physical design."
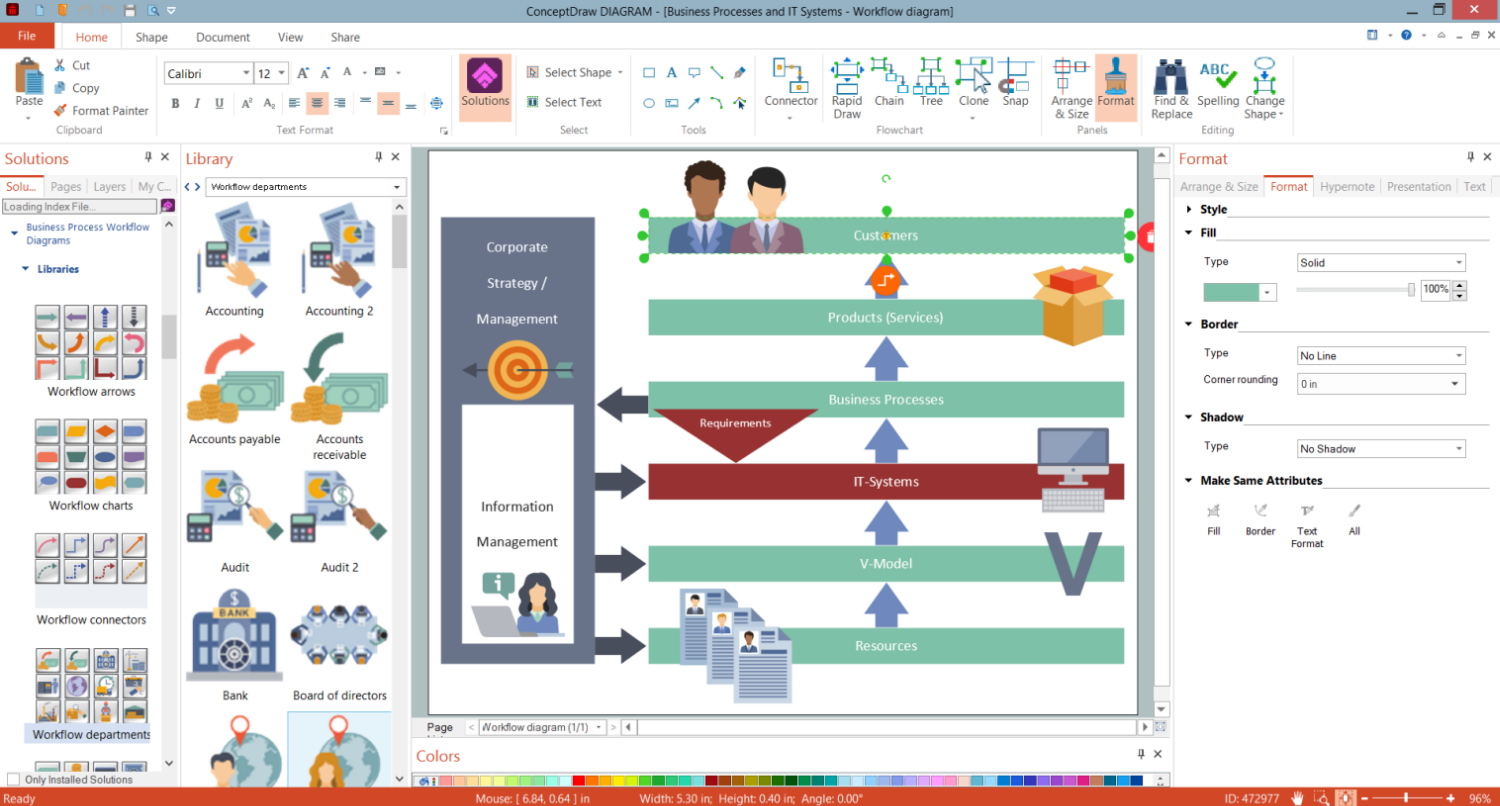
Once you decide to create any needed Entity-Relationship Diagram with help of a professional and well developed software, then one of the best applications will be the ConceptDraw DIAGRAM diagramming and drawing one. Having this tool means enabling yourself to create the great looking diagrams from a scratch using the basic graphical objects from the stencil libraries in the available to all the ConceptDraw DIAGRAM users which can be found within the application itself. To make it even simpler, you can always make your drawing much quicker if you download another product of CS Odessa known to be ConceptDraw STORE application. This new product enables everyone who uses ConceptDraw DIAGRAM to make the needed drawing much faster as ConceptDraw STORE provides lots of pre-made “solutions”, including the “Entity-Relationship Diagrams (ERD)” one full of the stencil libraries with design elements for making only smart looking diagrams and many other schematics.
 solution")
Example 1. Entity-Relationship Diagrams (ERD) Solution
Most of the mentioned solutions also include the examples and templates, which were previously created by the developers of the ConceptDraw DIAGRAM and ConceptDraw STORE. Those, who know all about how to make a proper diagram, chart, flowchart, map, plan and many other schemes, developed the professional software and so the application which can be used while working in ConceptDraw DIAGRAM.

Example 2. Martin ERD Diagram — Sales
The example below illustrates a data model diagram for a store.
Downloading the ConceptDraw STORE application from this site will enable you to get the Entity-Relationship Diagrams (ERD) solution with two stencil libraries where all 45 stencils can be found and so used from. One of the libraries in called “Design Elements — Chen ERD” and another one as “Design Elements — Crow’s Foot ERD”. Having both stencil libraries, which were mentioned, as well as the pre-made templates of the ER diagrams will help you to ensure yourself in making a great looking ERD within only an hour or even less, depending on how familiar you are with the mentioned products of CS Odessa.
ConceptDraw DIAGRAM is a perfect tool for:
- Designing and planning tasks such as:
- Jacobson Use Cases Diagram
- SSADMN Diagram
- Yourdon and Coad Diagram
- Command OLE Diagram
- Block Diagrams
- Data Modeling Diagram
- SysML Diagram
- Chen RED Diagram
- IDEF0 Diagram
- Booch OOD Diagram
- Gane Sarson Diagram
- Memory Object Diagram
- Data Flow Diagram
- FlowCharts
- Graphic User Interface (GUI)
- UML Diagram
- Program Structure Diagrams
- ORM Diagram
- Developing Visualization Solutions
- Project Planning (Gantt Charts, Timelines, Project Schedules)