Chen ERD Diagram
An entity–relationship model is also known as “ER model”. This model describes the inter related things of interest in a limited domain of knowledge and it is composed of the entity types, which all classify the so-called “things of interest”. The model specifies all of the relationships that can exist between instances of the entity types.
An ER model is very commonly used in software engineering, being formed in order to represent the things that some business needs to remember. It is being done in order to perform any needed business process, making the ER model to become an abstract “data model” for a reason of it defining a data structure, which can be implemented in a database (also known as a “relational database”).
Entity–relationship modelling was originally developed for a purpose of using it in a database design in 1976 by Peter Chen. Some other ER-modellers insist of showing the subtype entities connected by the generalization as well as specialization relationships, so ER-model can be used also in the specification of the domain-specific ontologies.
Such entity–relationship model is expected to be a result of the analysis, conducting systematically. This analysis is usually being conducted for a reason of defining as well as describing what is important in order to process in an area of the certain business. Such model does not define any business process, but presents a business data schema in a way of a graphical form. The ER model can be drawn in a graphical form in a way of boxes, which represent entities, connected by lines, which represent relationships, expressing the associations as well as dependencies between those entities.
The mentioned entities may be characterized not only by relationships but by the additional properties (or attributes), including the identifiers known as the "primary keys". The diagrams created in order to represent the needed attributes and entities, as well as any relationships may be called “entity-attribute-relationship diagrams”, or “entity-relationship models” (which is not as common).
A database is known to be the one implementing an ER model. Once there is a simple relational database implementation, each of the existing rows of the table each represents one instance of an entity type. At the very same circumstances, each of the fields mentioned in a table represents some particular attribute type. Once the “relational database” is being discussed, then any relationships between entities are implemented in a way of storing the primary keys of each of the entities.
There are a few kinds of data models, main of which are “conceptual”, “logical” and “physical”. Within the “conceptual” model (which is the highest level possible of any ER model) there is the least granular detail, which establishes the overall scope of what has to be included within the model set itself. Such “conceptual ER model” is meant to define the master reference data entities which are commonly used by any organization, which is involved in the process. This model can also be used as the foundation for one or more than one logical data models and the purpose of having it is to establish the so-called “structural metadata” between the set of the different logical ER models. Do not forget also that this ER model can be used for forming the commonality relationships between the similar models as a basis for the further data model integration.
Another type of the ER models is the “logical” one. This model does not require a conceptual ER-model and it contains more details than the first mentioned one (see above). Additionally, both transactional and operational data entities can be defined to the master data entities. The details of each of the data entities can be developed in this case and the relationships between the data entities can be established no problem. This logical ER model is independent in its development within the so-called specific “database management system”, into which this model can be implemented.
And the last type of the ER models is a “physical” one, being developed from each of the logical ER models. This physical model is usually developed in order to become an instantiated as a “database”. Each of such models must contain enough details in order to produce a database. This last model is being instantiated in the “structural metadata” of a database management system in a way of the relational database objects, for example: database indexes, database tables and so on, as so-called “unique key indexes”. The physical ER model can also be used for designing any needed modifications for the relational database objects and for maintaining the structural metadata of the database.
Once again, “ERD”, or “entity relationship diagram”, is the one being very simple to create in case you know what to start from and how to implement your plans of creating. It would be much better if you had experience in making any similar diagrams before. But once you do not have enough of the experience in making the needed diagrams, including the ER one, then the examples and templates, developed by the team of the professionals, may help you a lot, making it possible to finish with the dream drawing in only a couple of hours.
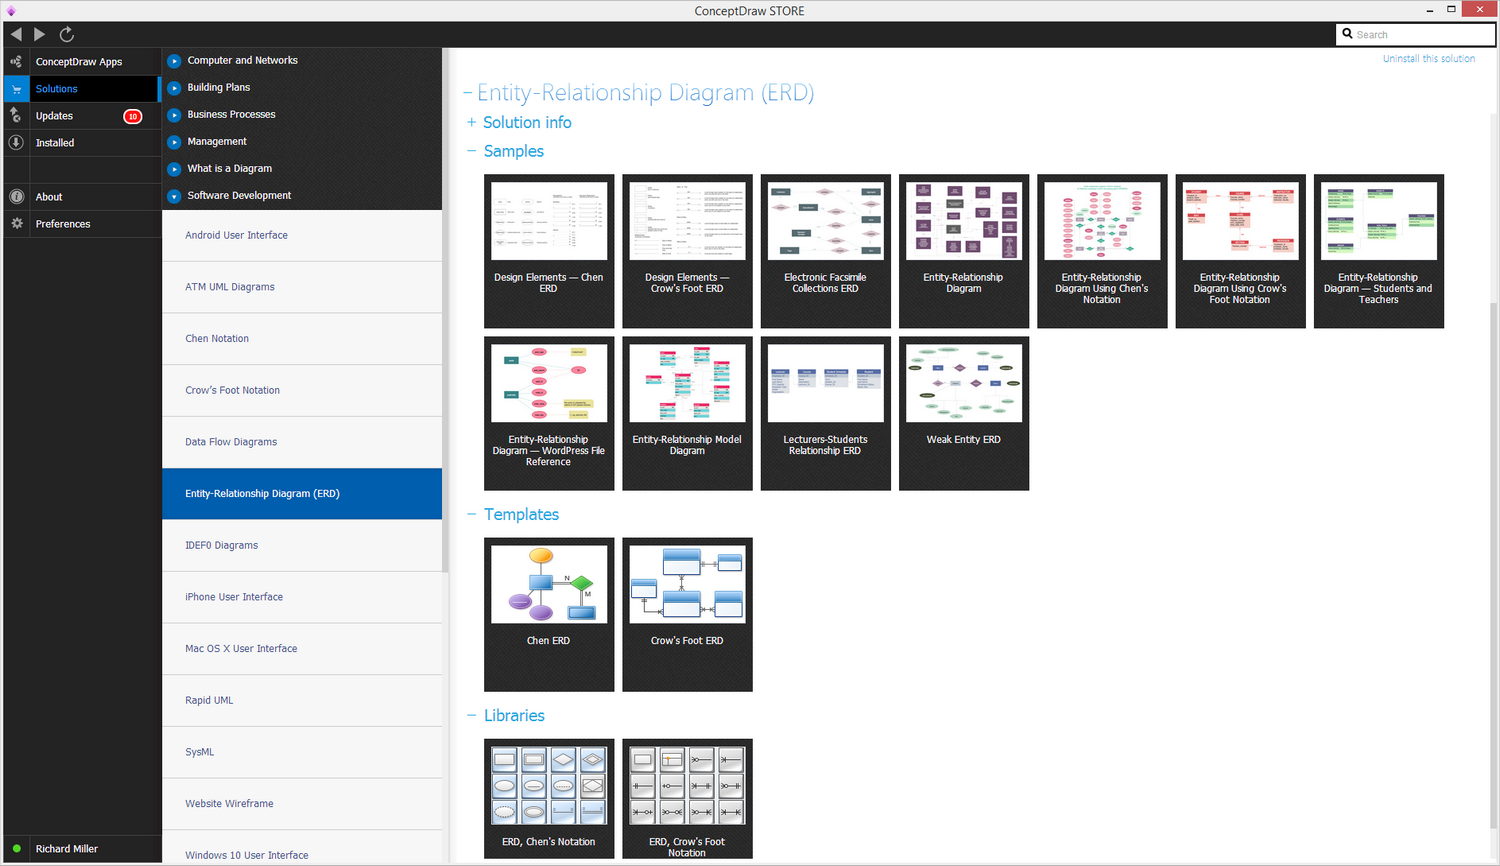
Thus, having ConceptDraw DIAGRAM software and the “Entity-Relationship Diagram (ERD) solution”, which contains a large collection of pre-designed examples of “Entity Relationship Diagrams”, as well as samples and templates for the data modelling, can simplify your task and so to make the planned drawing appear in front of you as a great looking and smart diagram. In case you decide to use the mentioned solution full of examples as well as stencil libraries, then you can always download it from ConceptDraw STORE application or from this site.
Example 1. Entity-Relationship Diagram (ERD) solution
So getting all needed, you can use the various icons as well as developed elements in order to develop a model of a database of any complexity according to the Chen's notation. The available drawing tools from Entity-Relationship Diagram (ERD) solution can be very useful for all of our clients, including you. This solution extends ConceptDraw DIAGRAM with 2 libraries containing 45 objects advocated by Chen's and Crow’s Foot notations: so helpful while describing any database needed.
Use the Entity-Relationship Diagrams (ERD) solution to draw data model diagrams for your business documents, presentations and websites.

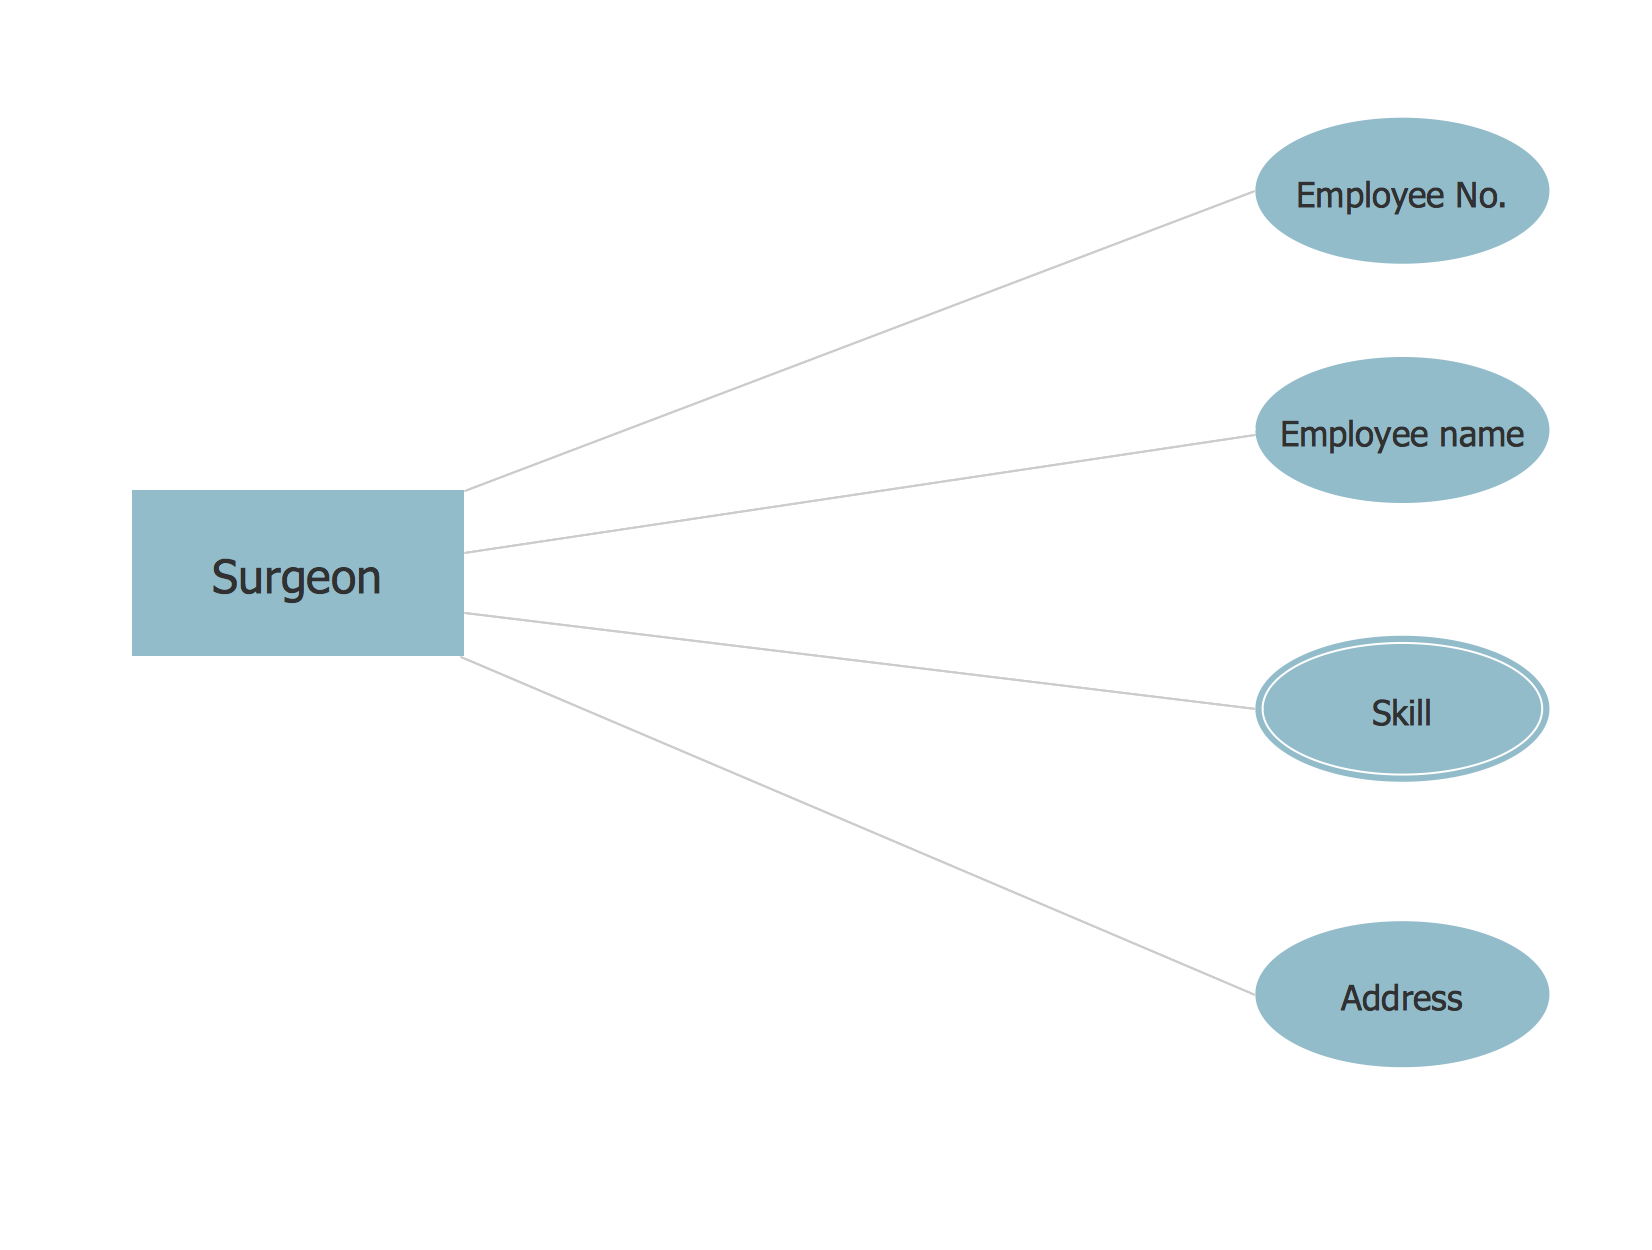
Example 2. Chen ERD Diagram — Database of a Surgeon
The example above illustrates an entity with its' attributes. A surgeon is an entity, and information about him such as name or address is shown as attribute.
ConceptDraw DIAGRAM is a perfect tool for:
- Designing and planning tasks such as:
- Jacobson Use Cases Diagram
- SSADMN Diagram
- Yourdon and Coad Diagram
- Command OLE Diagram
- Block Diagrams
- Data Modeling Diagram
- SysML Diagram
- Martin RED Diagram
- IDEF0 Diagram
- Booch OOD Diagram
- Gane Sarson Diagram
- Memory Object Diagram
- Data Flow Diagram
- FlowCharts
- Graphic User Interface (GUI)
- UML Diagram
- Program Structure Diagrams
- ORM Diagram
- Developing Visualization Solutions
- Project Planning (Gantt Charts, Timelines, Project Schedules)


