UML Diagram
What is UML diagram?
UML is a Unified Modeling Language, that can be applied in banking, finance, internet, aerospace, healthcare and other business activities. It is, in general, as simple as an accepted standard which is commonly used for modeling some system. There are lots of notations that can be used for creating UML diagrams. And these notations can visually represent any needed:
- requirements,
- subsystems,
- logical and physical elements,
- structural,
- behavioral patterns,
which are especially relevant to systems built while using an object-oriented style.
The above mentioned Unified Modeling Language (or UML) is a standardized and general-purpose modeling language which is very popular and widely used in the field of software engineering business activity.
Types of UML Diagrams
This Unified Modeling Language contains a set of graphic notation techniques for generating the visual models of object-oriented software-intensive systems and there are all together 13 types of UML diagrams, which you can always create using ConceptDraw DIAGRAM software. These types are:- “package” (or “class”),
- “object”,
- “use case”,
- “sequence”,
- “collaboration”,
- “component”,
- “state machine”,
- “timing”,
- “interaction overview”,
- “composite structure”,
- “activity”
- “deployment”
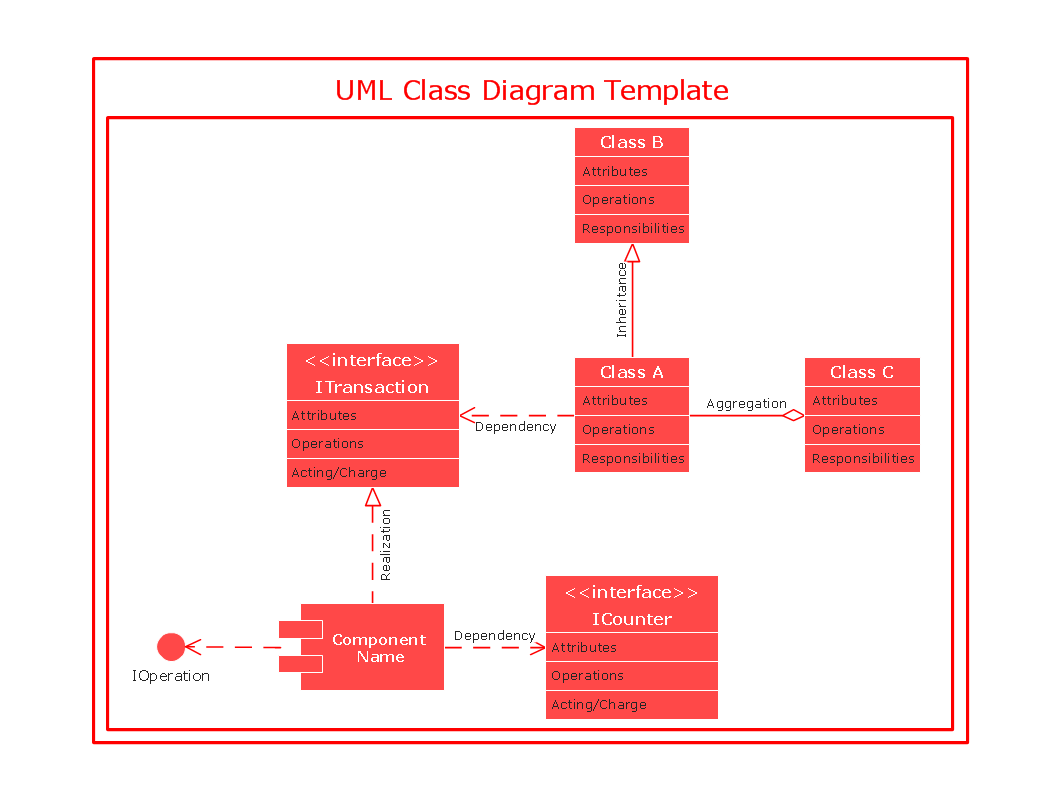
UML Class Diagrams
UML Class diagrams are the static structure diagrams with the help of which it is simple to describe a structure of some particular system in a way of showing the system's classes, attributes, operations (or methods), as well as the relationships among the objects within this system.
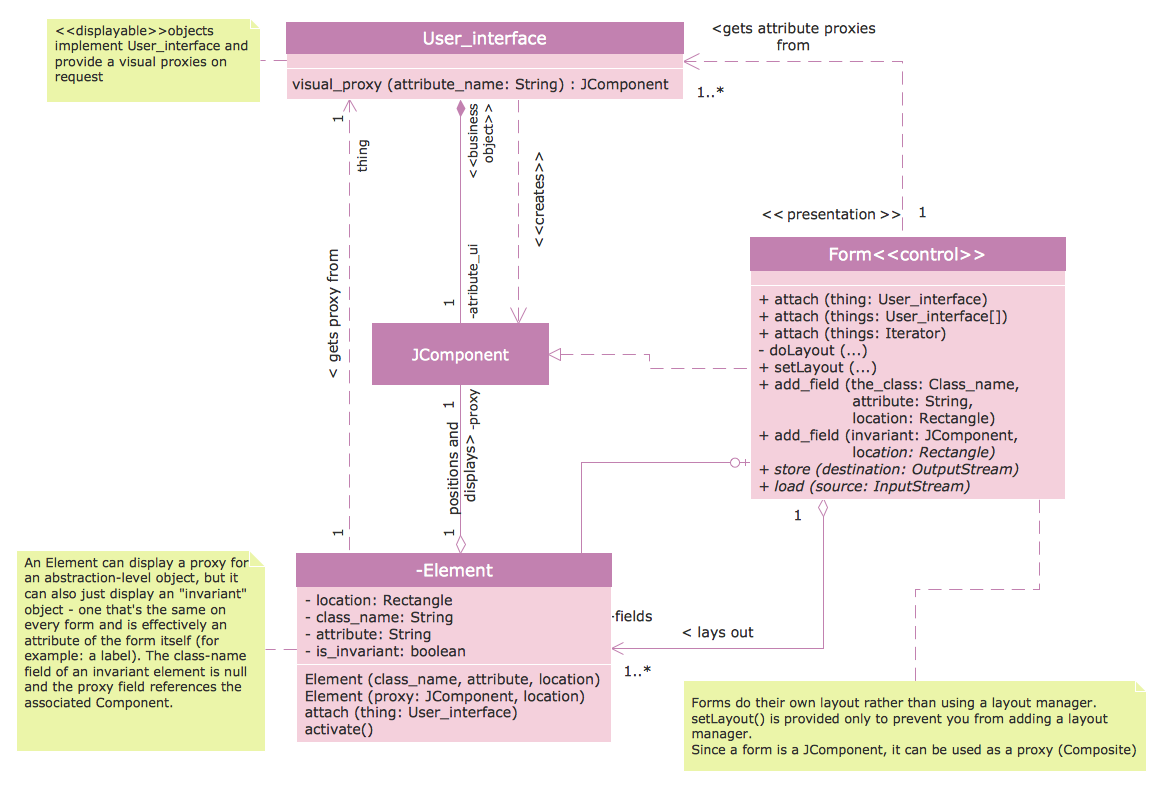
Pic. 1 UML Class Diagram
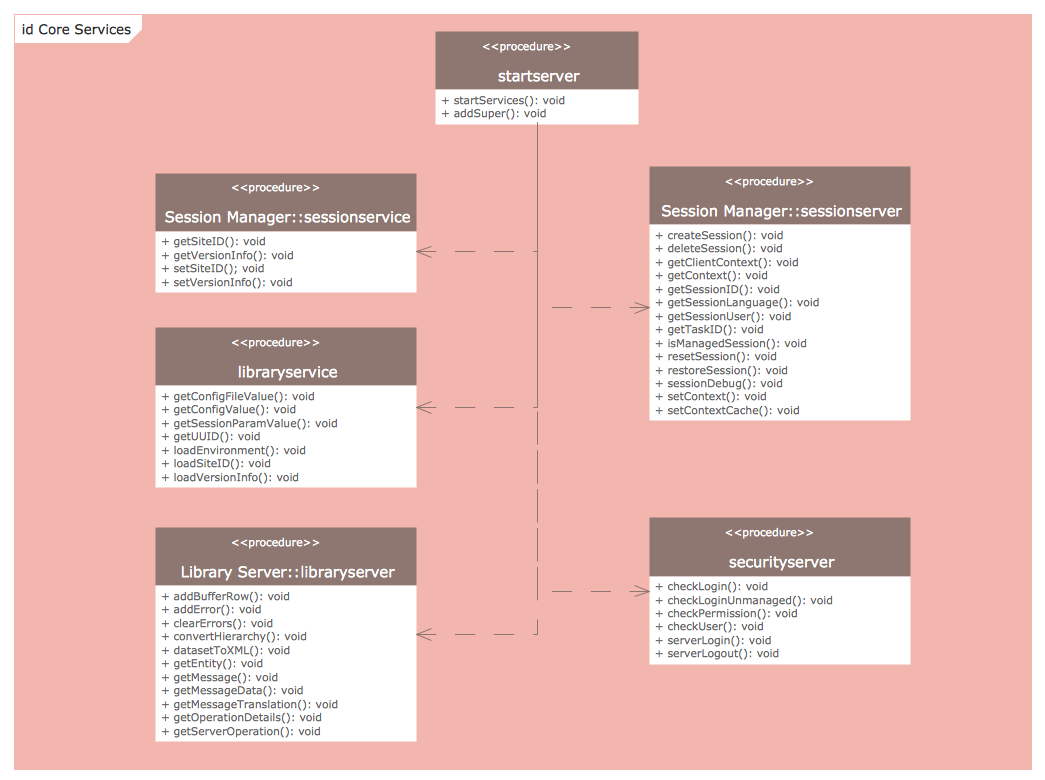
UML Package Diagrams
UML Package diagram is used in the Unified Modeling Language for depicting the dependencies between the packages that can make a particular model.
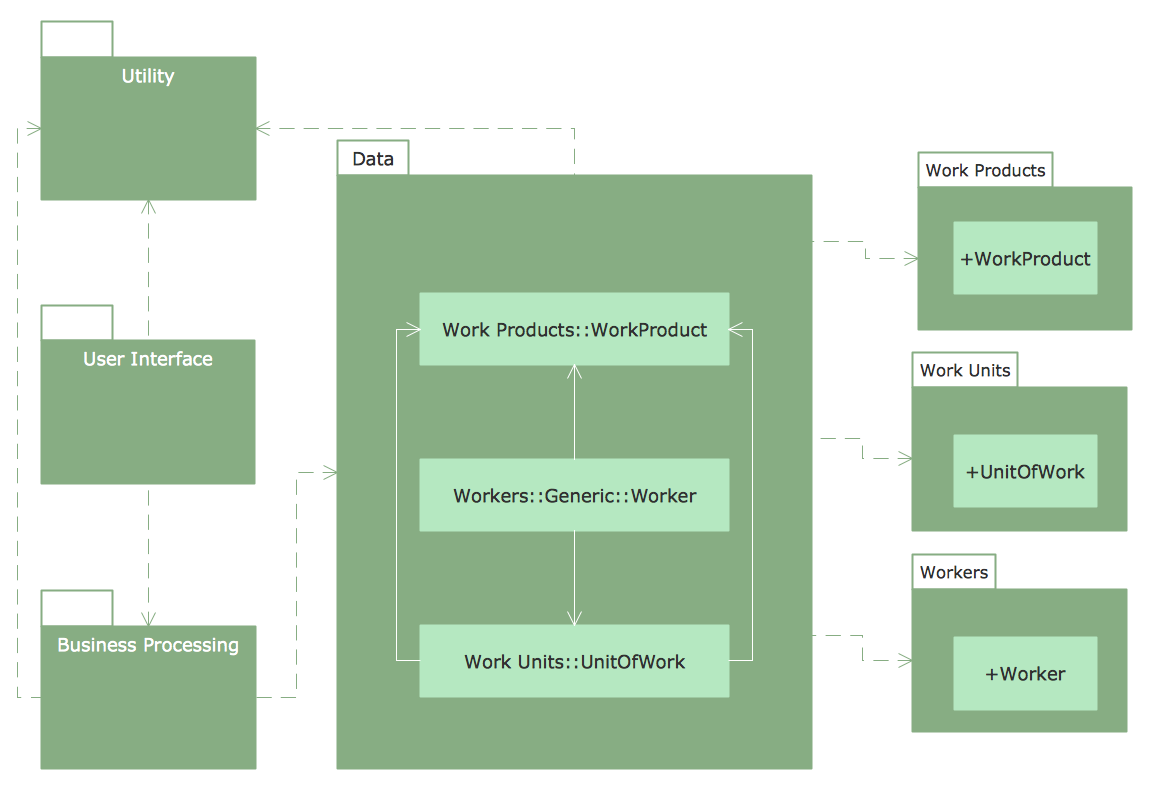
Pic. 2 UML Package Diagram
UML Object Diagrams
UML Object diagrams are used in the Unified Modeling Language (UML) and these diagrams show a partial or complete view of some system’s structure at some specific period of time.
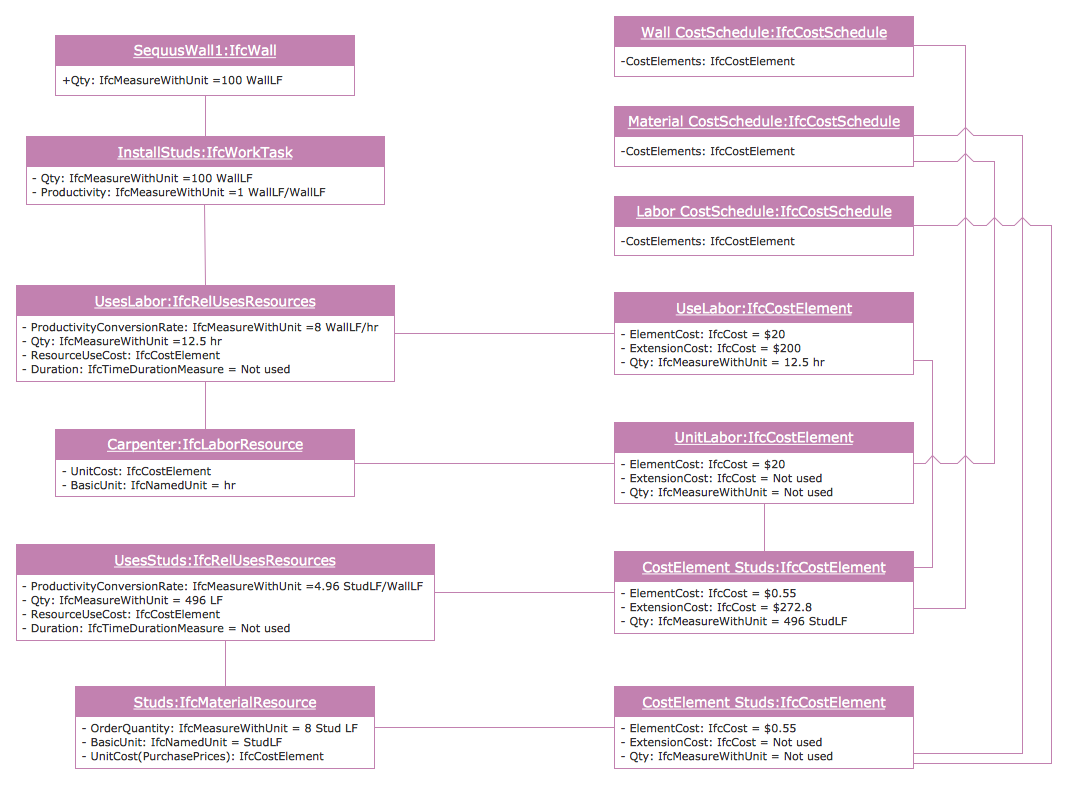
Pic. 3 UML Object Diagram
UML Use Case Diagrams
UML Use Case diagrams are the representations of a user's interaction with some particular system, depicting the specifications of a use case.
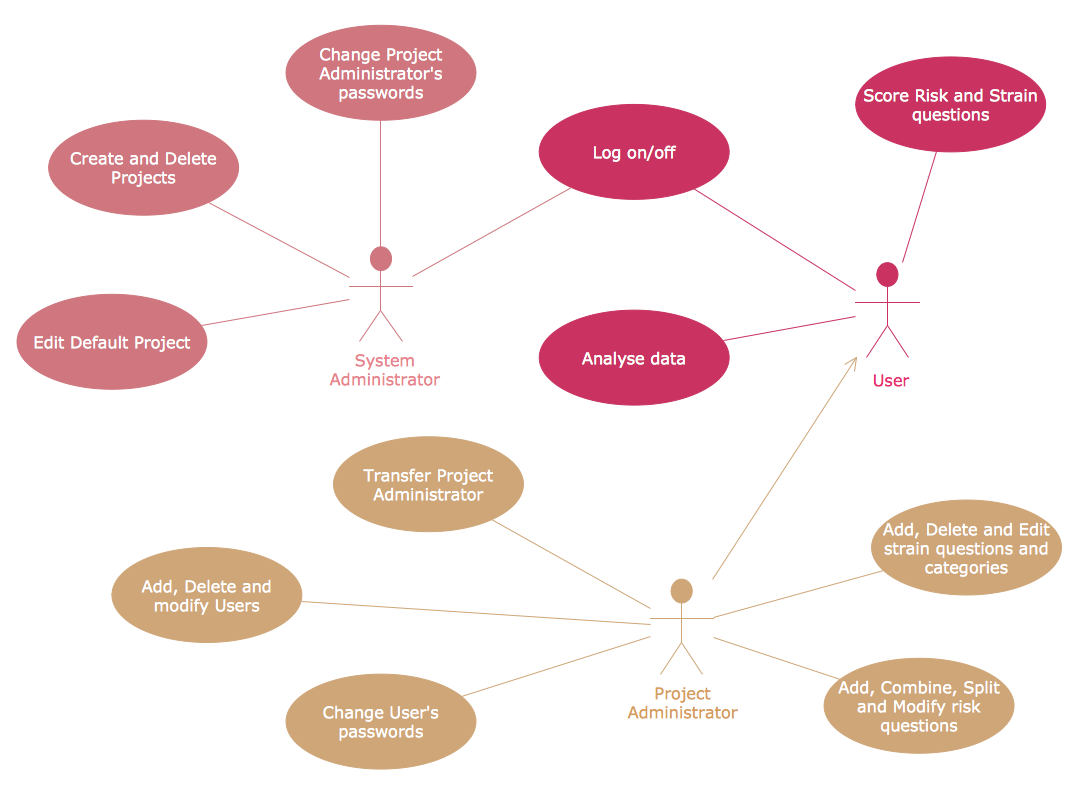
Pic. 4 UML Use Case Diagram
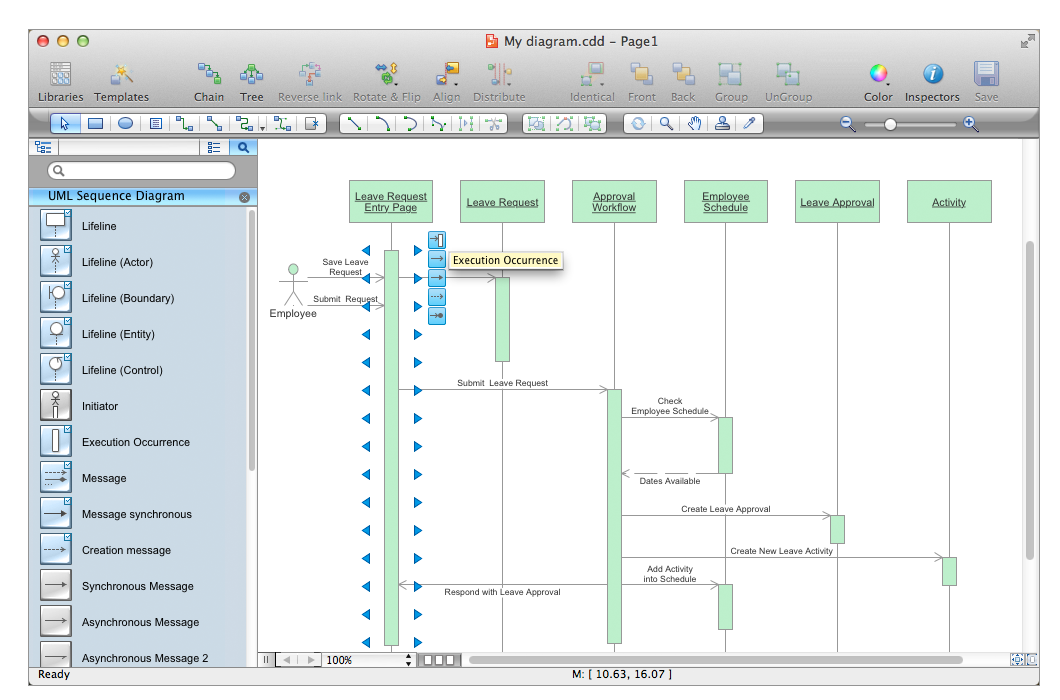
UML Sequence Diagrams
UML Sequence diagrams are interaction diagrams with help of which it is simpler to show the way how processes operate with each other and in which order it happens.
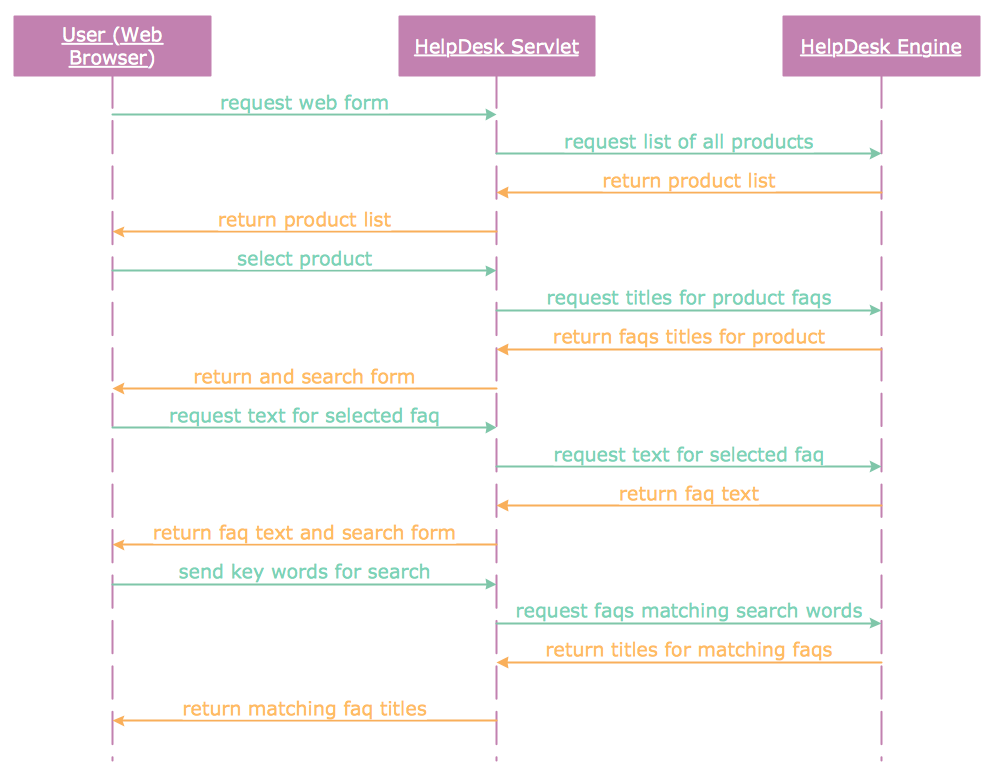
Pic. 5 UML Sequence Diagram
UML Collaboration Diagrams
UML Communication diagrams model the interactions between different objects or parts in terms of sequenced messages. Communication diagrams represent a combination of information taken from Class, Use Case and Sequence Diagrams describing both the static structure and the dynamic behaviour of some particular system.
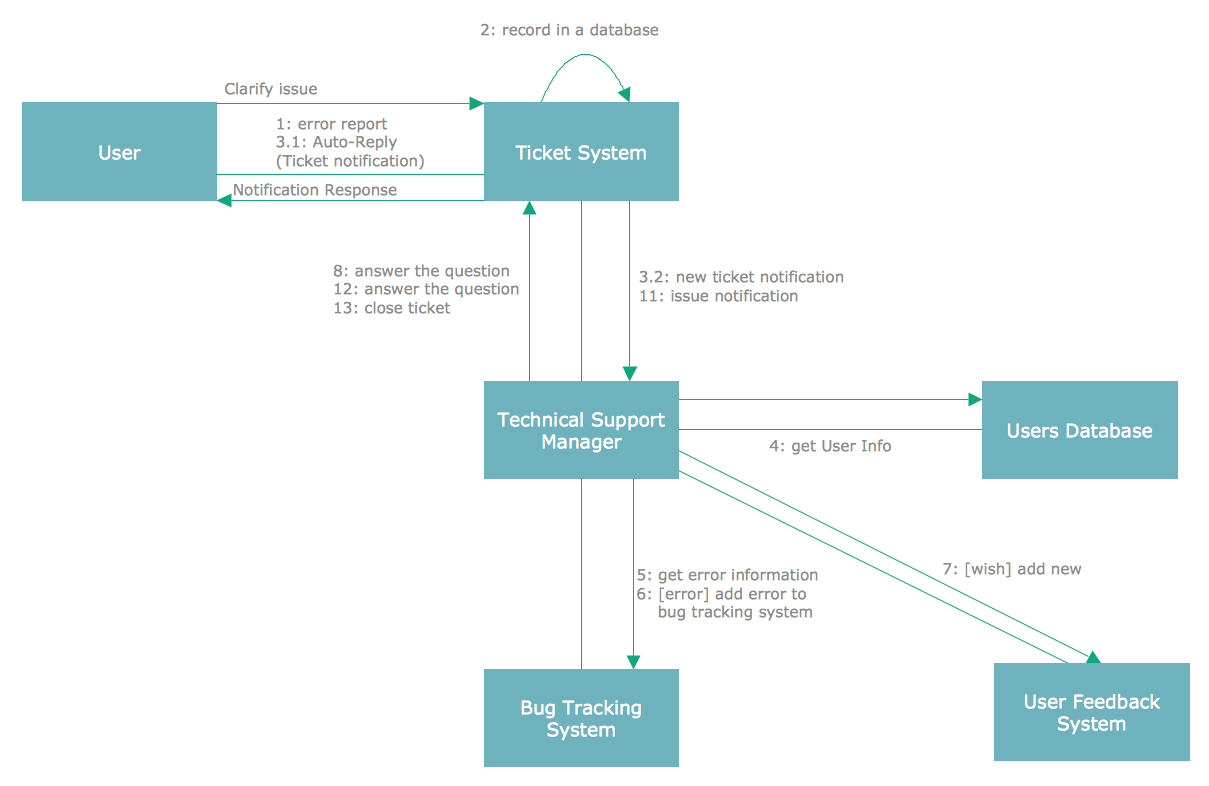
Pic. 6 UML Collaboration Diagram
UML Activity Diagrams
UML Activity diagrams represent workflows of the actions and activities with support of choice, iteration as well as concurrency. In the Unified Modeling Language activity diagrams are meant to model both organizational and computational processes (for example, workflows) and this type of diagrams represents the overall flow of control.
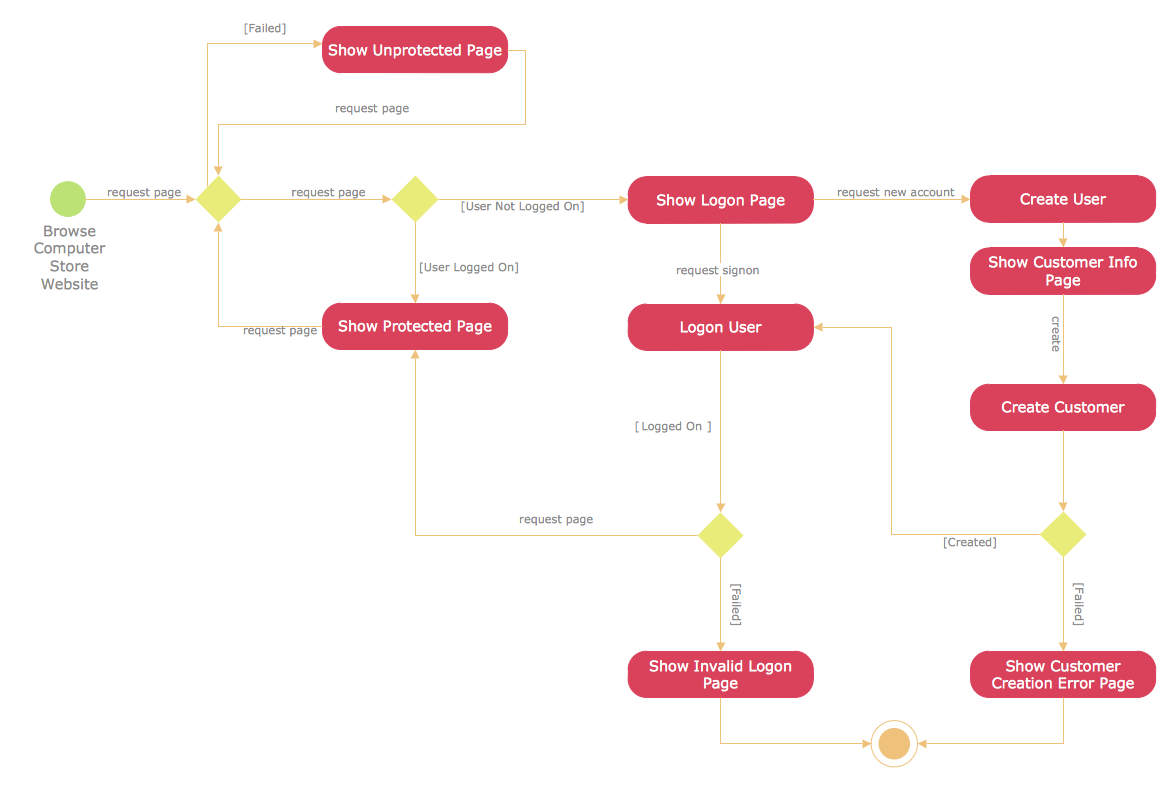
Pic. 7 UML Activity Diagram
UML Component Diagrams
UML Component diagrams help depict the way the components of some system are wired together in order to form larger components or software systems. This type of diagrams is used for illustrating the structure of arbitrarily complex systems.
Pic. 8 UML Component Diagram
UML Deployment Diagrams
UML Deployment diagrams are used for modeling the physical deployment of some artefacts on nodes. These nodes look as boxes and the artefacts clustered with each node appear as rectangles within these boxes. Nodes may also have subnodes which can appear as nested boxes. A single node in this type of UML diagrams may conceptually represent many different physical nodes.
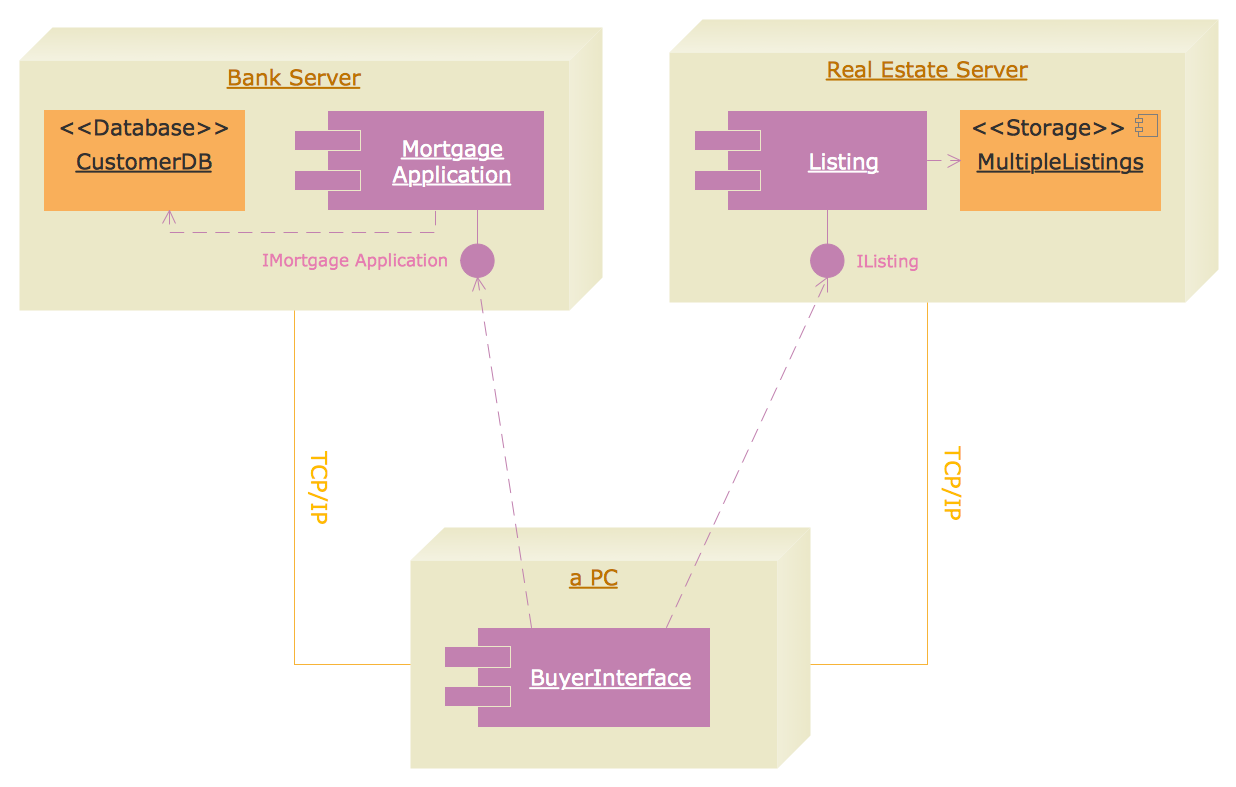
Pic. 9 UML Deployment Diagram
UML State Machine Diagrams
"UML state machine, also known as UML statechart, is a significantly enhanced realization of the mathematical concept of a finite automaton in computer science applications as expressed in the Unified Modeling Language (UML) notation.
UML State Machine diagrams or UML state charts are used for boosting the realization of the mathematical concept of a finite automaton in computer science applications.
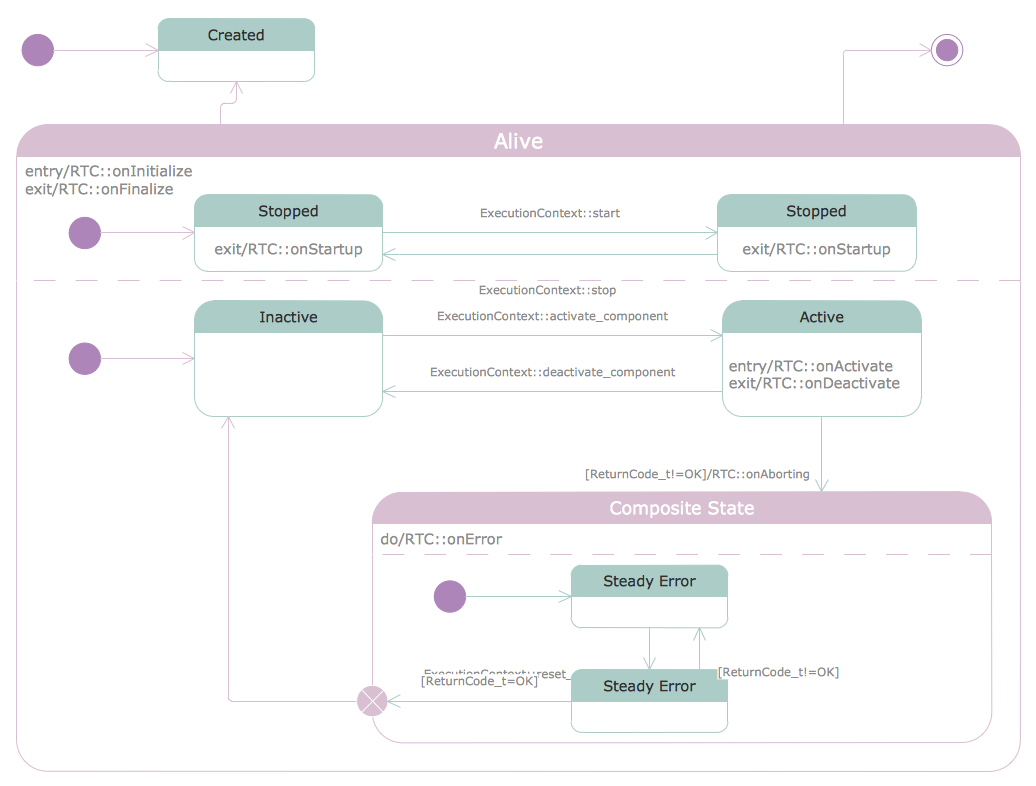
Pic. 10 UML State Machine Diagram
UML Timing Diagrams
UML Timing diagram is a specific type of UML interaction diagram, which focuses on timing constraints. These types of UML diagrams are used for exploring the behaviours of objects throughout some particular period of time. This type of UML diagram is a special form of a Sequence diagram. The differences between them are the axes, which are reversed, so that the time is increased from left to right and the lifelines are shown in separate compartments that are arranged vertically.
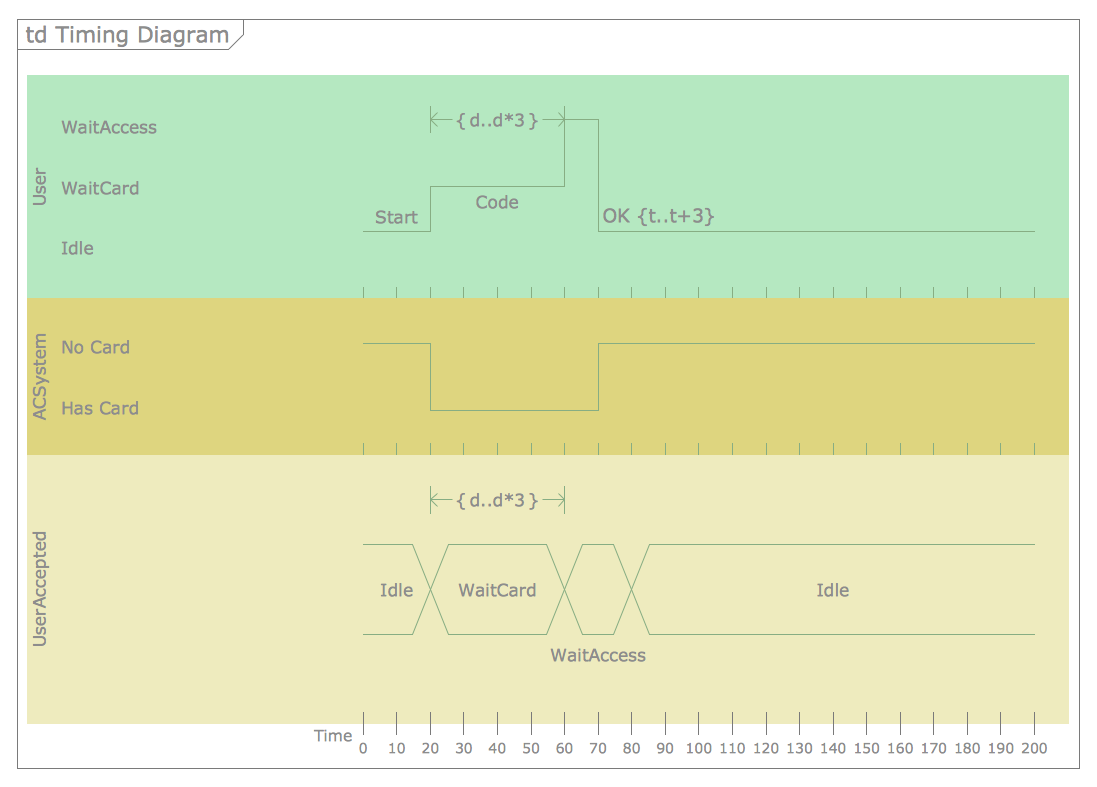
Pic. 11 UML Timing Diagram
UML Interaction Overview Diagrams
UML Interaction Overview Diagram is included to the list of fourteen types of UML diagrams, which can illustrate a control flow with nodes that can contain interaction diagrams. This type of UML diagrams is similar to the Activity diagram, as they both visualize a sequence of activities. The difference in them is that each individual activity is pictured as a frame which can contain a nested interaction diagrams. This makes the interaction overview diagram to be very useful for deconstructing a complex scenario.
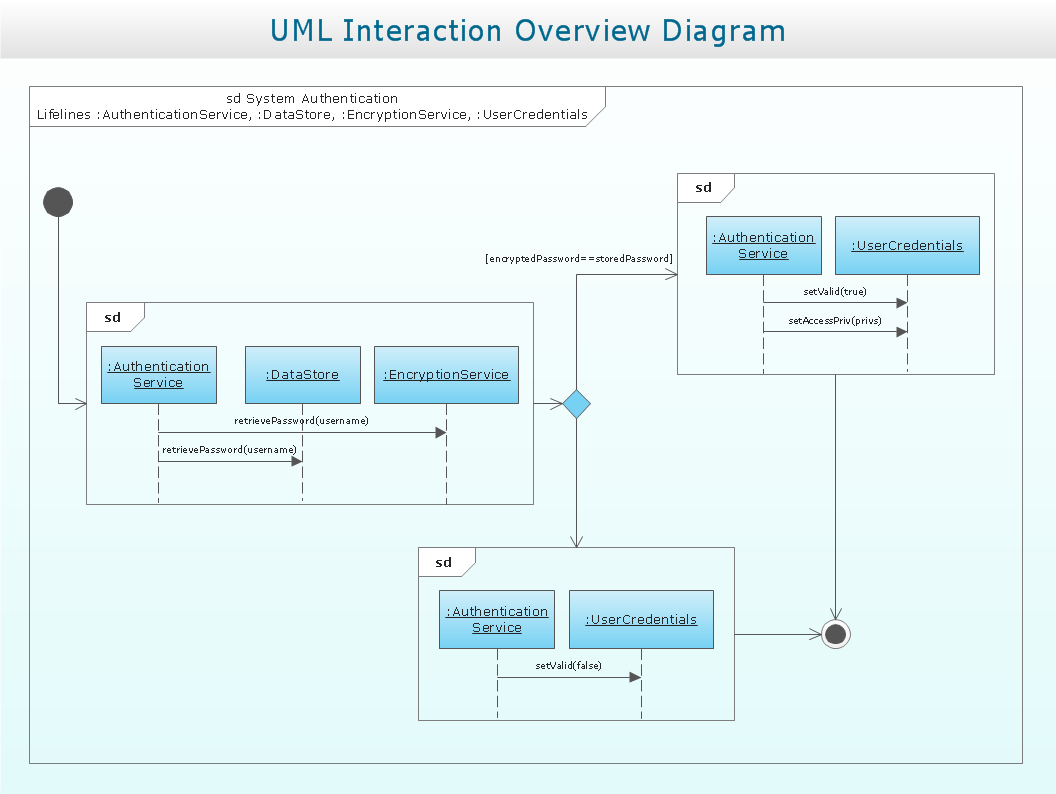
Pic. 12 UML Interaction Overview Diagram
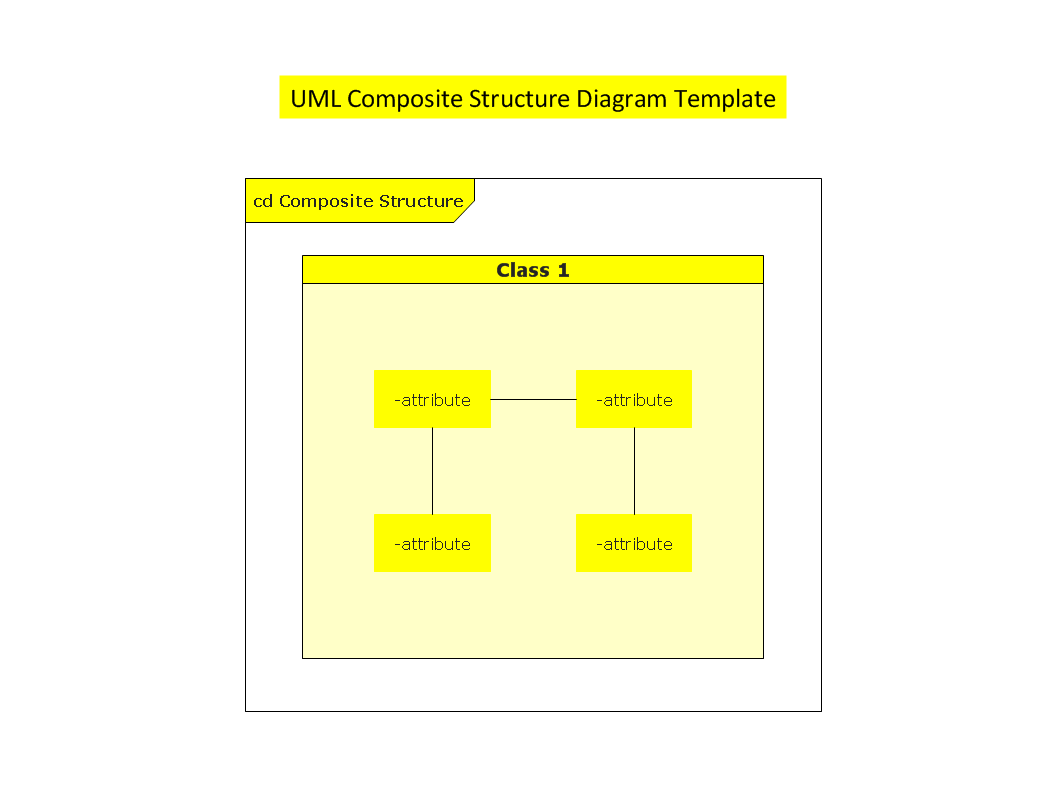
UML Composite Structure Diagrams
UML Composite Structure diagram is such type of Static Structure diagrams that shows the internal structure of a class and the collaborations, which this structure makes possible. This type of UML diagrams can include internal parts, using which the parts of a system can interact with each other.
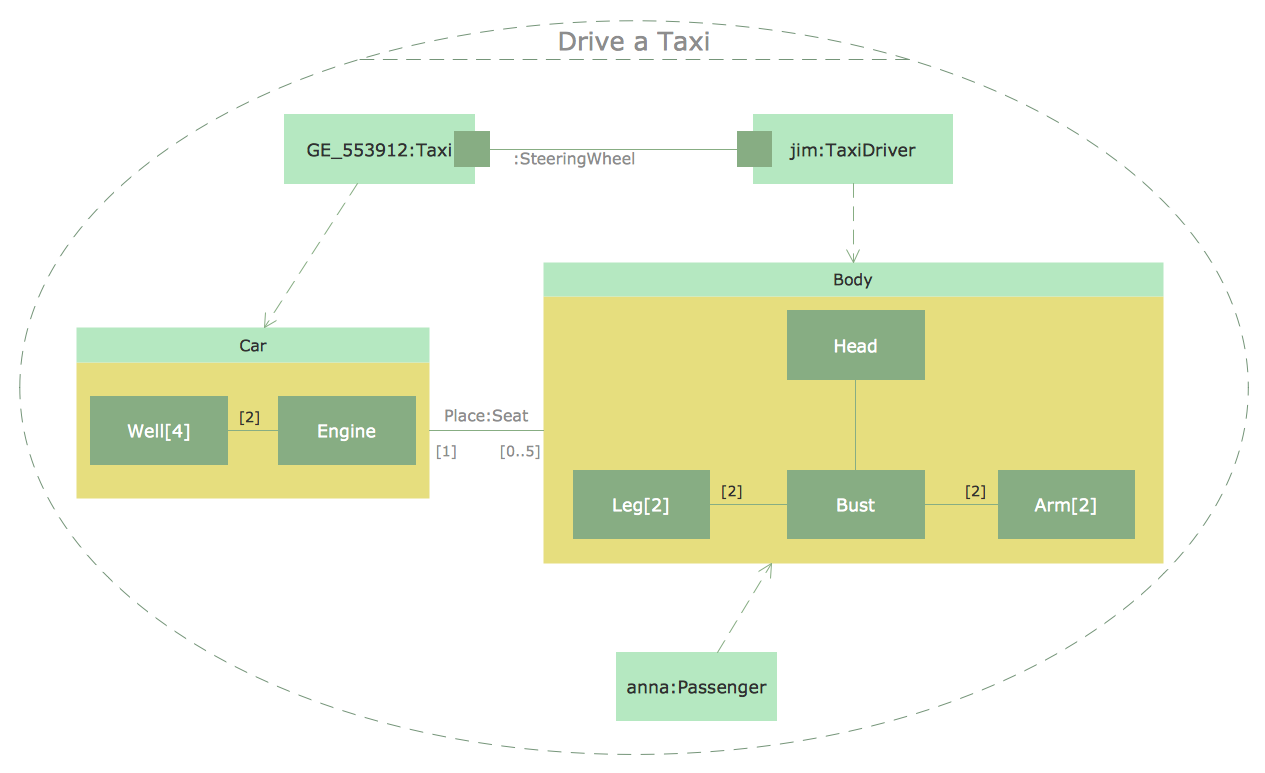
Pic. 13 UML Composite Structure Diagram
Example 1. UML Diagrams
UML can be applied to diverse application: banking, finance, internet, aerospace, healthcare, etc.
After describing so many different UML diagrams, which you can always create using ConceptDraw DIAGRAM we want to mention the way these diagrams may be created. Besides having ConceptDraw DIAGRAM it is also beneficial having ConceptDraw STORE as well, as this other product of CS Odessa is truly unique and it allows to download any needed solution for creating your own charts, flowcharts, schemes, plans, maps and diagrams, including any of the mentioned UML diagram any time you want them to be made within only a couple of hours or even minutes if you already know how to use ConceptDraw DIAGRAM and so ConceptDraw STORE, including all of the available solutions.

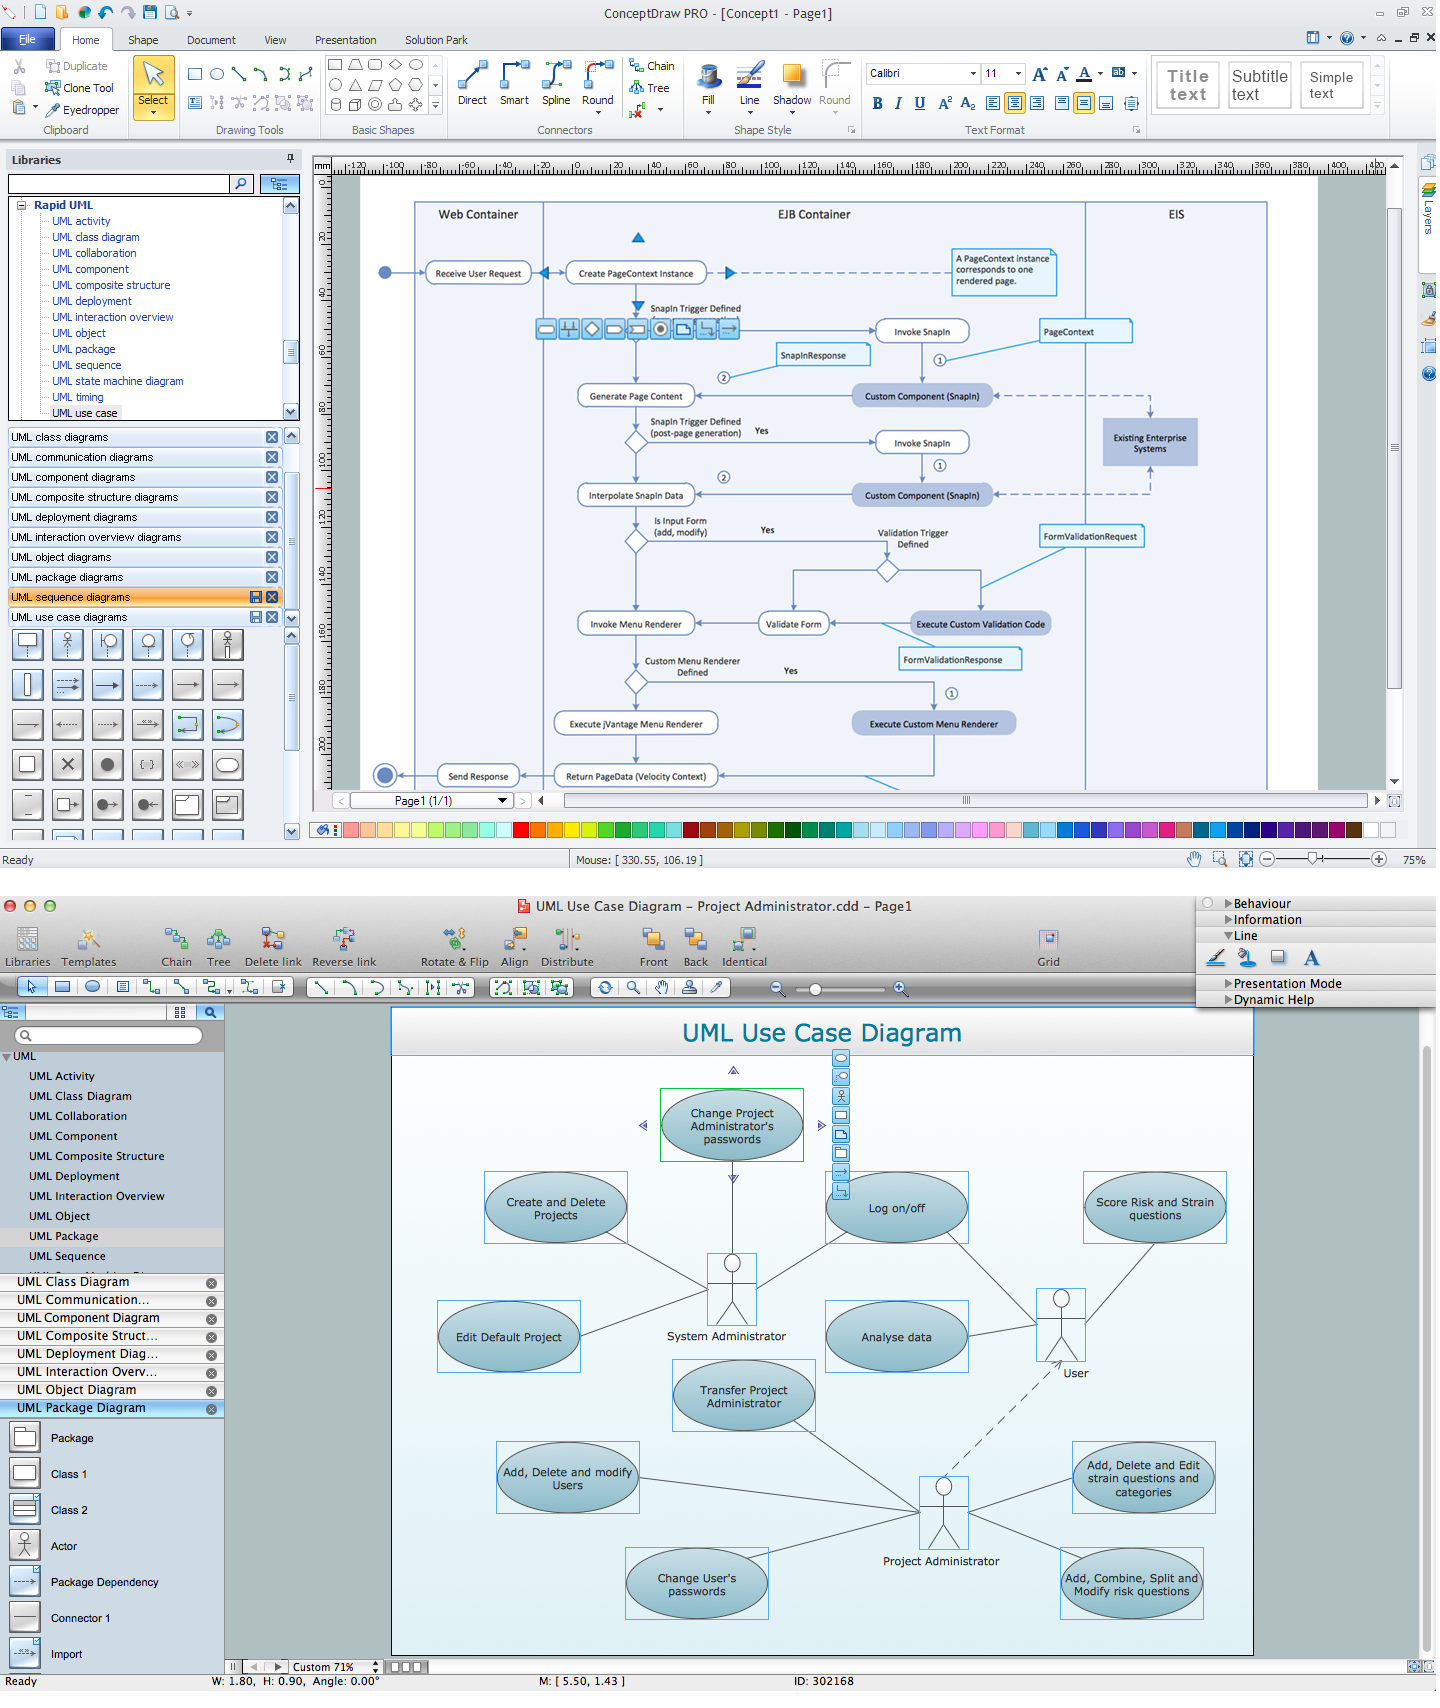
Example 2. UML Diagrams solution
The solution called “Rapid UML” allows you to make any UML diagram, using the available samples, such as “Design Elements — UML activity”, “Design Elements — UML class”, “Design Elements — UML Communication”, “Design Elements — UML Composite structure”, “Design Elements — UML Deployment”, “Design Elements — UML Interaction Overview”, “Design Elements — UML Component”, “Design Elements — UML Object”, “Design Elements — UML Package”, “Design Elements — UML State Machine”, “Design Elements — UML Timing”, “Design Elements — UML Sequence”, “Design Elements — UML Use case”, “UML Activity Diagram — Alarm Trigger Processing”, “UML Activity Diagram — Cash Withdrawal from ATM”, “UML Activity Diagram — Cash Withdrawal from ATM”, “UML Activity Diagram — Catalogue Creation Process”, “UML Activity Diagram — Catalogue Creation Processing”, “UML Activity Diagram — Payment Process”, “UML Activity Diagram — Servlet Container”, “UML Activity Diagram — Snap in Process”, “UML Activity Diagram — Ticket Processing System” and many other.