Value Stream Maps Visualize
The new Value Stream Mapping solution found in the ConceptDraw Solution Park continues to extend the range of ConceptDraw DIAGRAM into a business graphics tool that can be used to document processes in any organization. For the start simply put timeline objects from library and continue to create diagram. After that put it to specific place object that illustrates processes of the production. Many lean practitioners use Value Stream Mapping as a fundamental tool to identify waste, cut process cycle times, and implement process improvement.
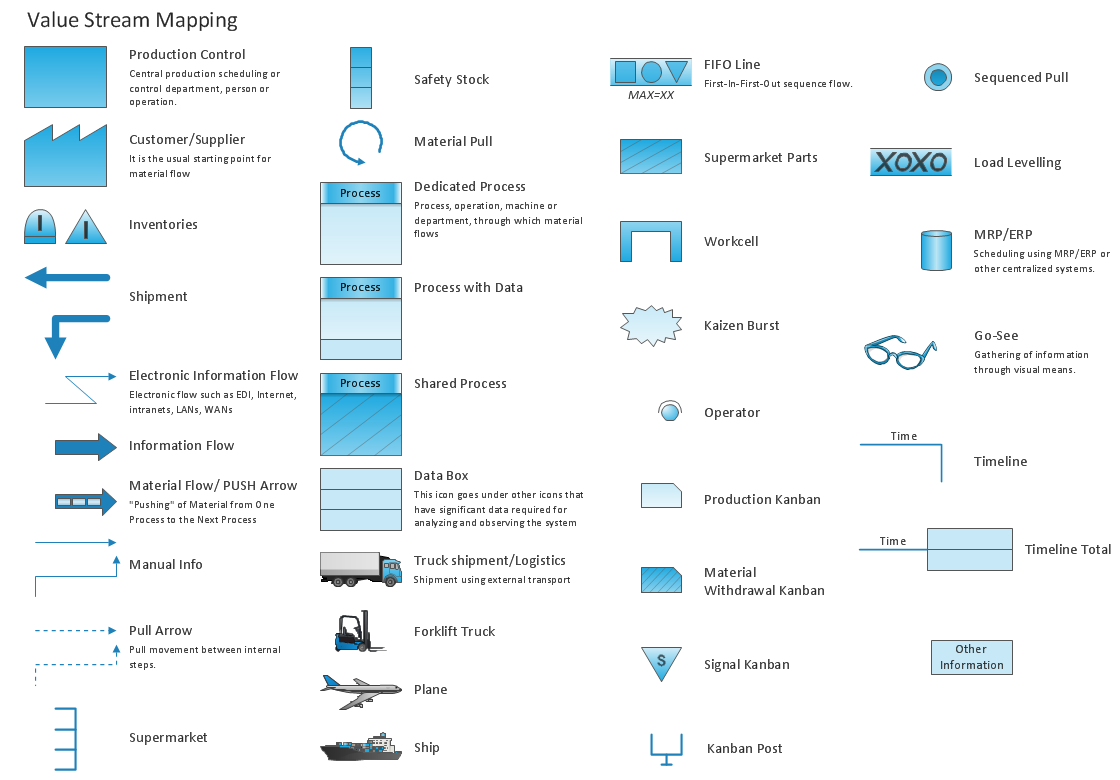
Pic.1 Value stream map (VSM) vector stencils.
Value Stream Maps visualize for a manufacturing plant the material and information flow required to deliver a product/service to customers.
See also Samples:
THREE RELATED HOW TO's:
ConceptDraw DIAGRAM is a software for making Value Stream Mapping diagram with more than 10 library objects that are scalable vector images.
Picture: Value Stream Mapping - Design Elements
Related Solution:
This sample shows the Data Flow Diagram of the Taxi Service and interactions between the Clients, Operators and Divers, as well as Orders and Reports databases.
Picture: Taxi Service Data Flow DiagramDFD Example
Related Solution:
Value Stream Map template helps you to create VSM diagrams using ConceptDraw DIAGRAM software.
Picture: How To create Value Stream Map (VSM)
Related Solution:
ConceptDraw
MINDMAP 16