Marketing Diagrams
With ConceptDraw, easily diagram complex processes that conform to particular standards such as Lean or Six Sigma. It includes a variety of business process shapes so your diagrams look exactly the way you want. Easily collaborate with colleagues to create detailed process diagrams and use them as a key element in streamlining your processes.
ConceptDraw Business Diagram Suite is the most powerful business and relational charting/diagramming package available. If you need to create advanced, completely customizable Flow Charts, Organizational charts and other relational diagrams from your data, then ConceptDraw is the ideal solution for you.
Examples of functionality that ConceptDraw Business Diagram is perfectly suited for include:
- Creating Dynamic Organizational Charts
- Creating Social Network Diagrams
- Building Flow Charts and Block Charts
- Diagramming your business processes
- Decision Charts
- Much more.
Business Diagram Examples
Even users with no prior experience, may create neat and comprehensive business diagrams using ConceptDraw DIAGRAM and its Solutions.
If you need to draw professional, customizable Business Diagrams, Organizational charts and many other relational diagrams using your data, ConceptDraw DIAGRAM is the right tool for you.
What are the Benefits of Business Diagram
- Gain greater understanding of your corporate data, by visualizing business processes and acting on them.
- Dynamically create advanced, customized Organizational Charts and Diagrams on the web.
- Visually examine how people, business functions and other items relate to each other.
- Create custom, reusable objects for rapid application development.
- With just a few clicks, ConceptDraw can connect, align, and evenly distribute shapes in your business process diagrams. ConceptDraw can automatically connect shapes as you drag, drop, and rearrange them onto the drawing page, or connect existing shapes that are already on the drawing page.
Free Download Diagram Software and View All Examples

Pic. 1. Business Flowchart. Social media activity of a real estate agent.
All ConceptDraw DIAGRAM documents are vector graphic files and are available for reviewing, modifying, and converting to a variety of formats: image, HTML, PDF file, MS PowerPoint Presentation, Adobe Flash, MS Visio VSDX.
TEN RELATED HOW TO's:
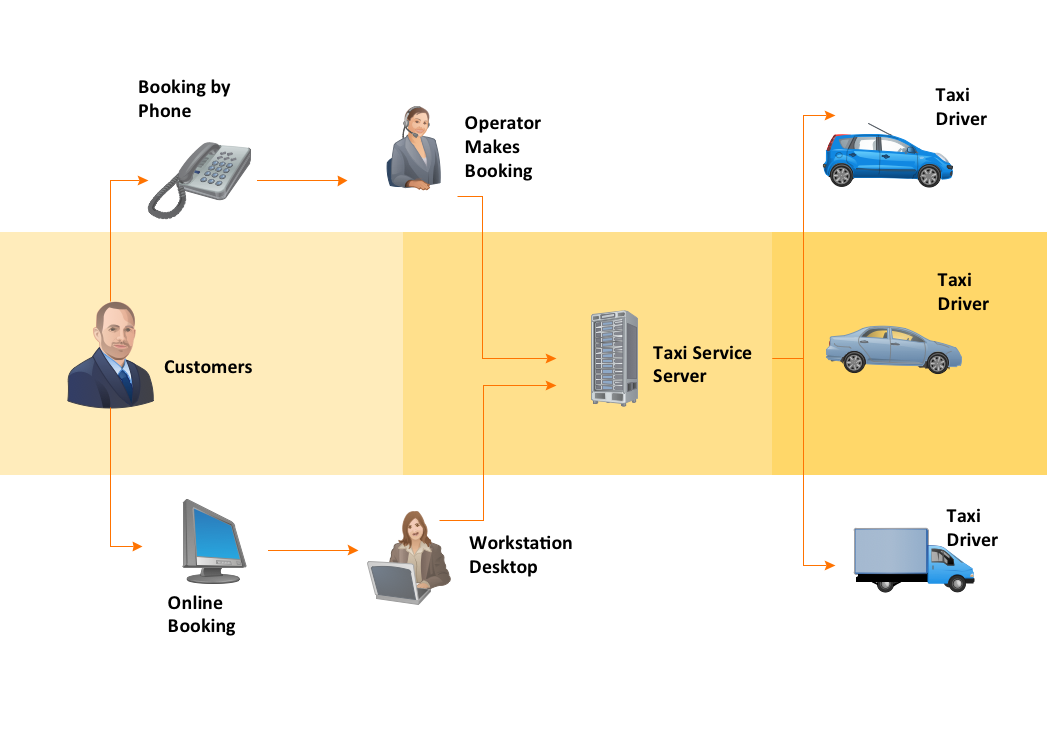
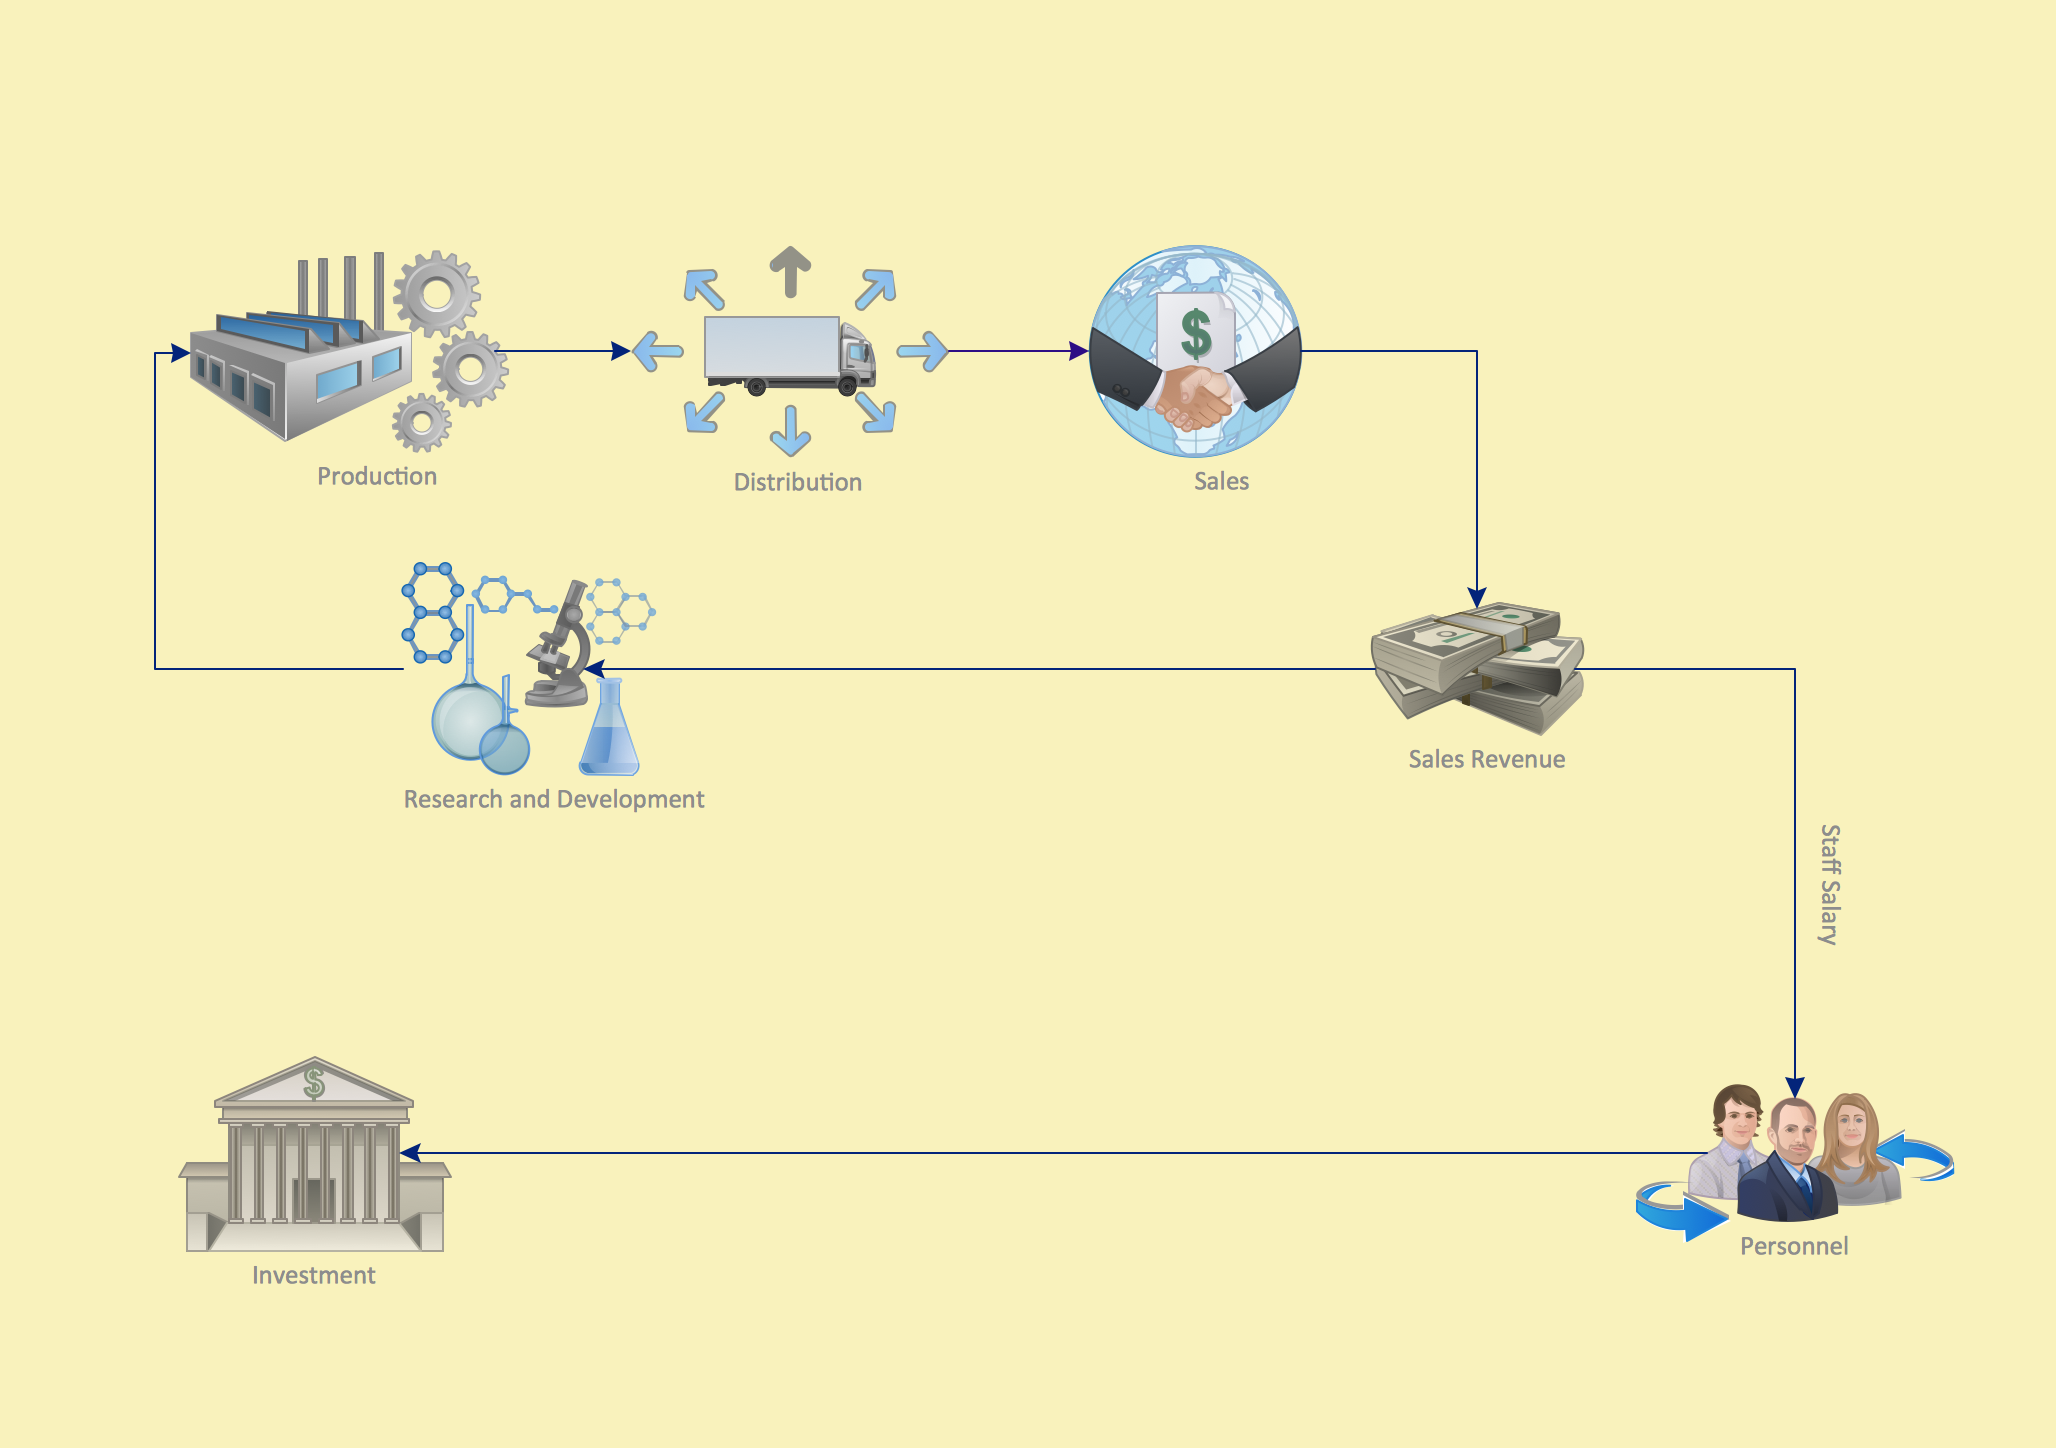
This sample shows the Flowchart that displays the layout and work flow of the cloud marketing platform. This diagram has a style of the marketing brochure. This style displays the central product that is related to the other issues.
Using the ready-to-use predesigned objects, samples and templates from the Flowcharts Solution for ConceptDraw DIAGRAM you can create your own professional looking Flowchart Diagrams quick and easy.
Picture: Flowchart Marketing Process. Flowchart Examples
Related Solution:
What is a Histogram Chart? It is a chart which visually displays a distribution of the data. ConceptDraw DIAGRAM for fast and simple drawing professional looking Histogram Chart.
Picture: Histogram Chart
Related Solution:
ConceptDraw gives the ability to draw Flowchart documents. Flowcharts solutionis a powerful tool that extends ConceptDraw application for drawing business flowcharts.
ConceptDraw DIAGRAM vector diagramming and business graphics software enhanced with with templates, green and interactive flowchart makers, samples and stencil libraries from ConceptDraw Solution Park which all focused to help with drawing flowcharts, block diagrams, bar charts, histograms, pie charts, divided bar diagrams, line graphs, area charts, scatter plots, circular arrows diagrams, Venn diagrams, bubble diagrams, concept maps, and others.
Picture: The Best Flowchart Software Available
Related Solution:
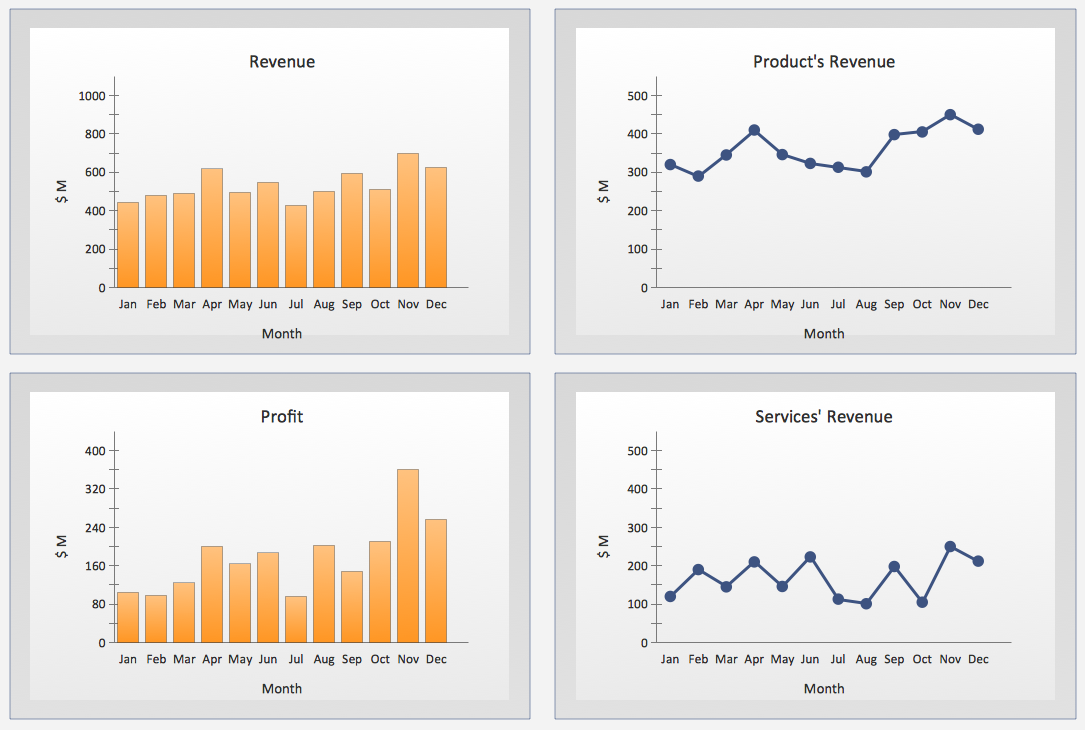
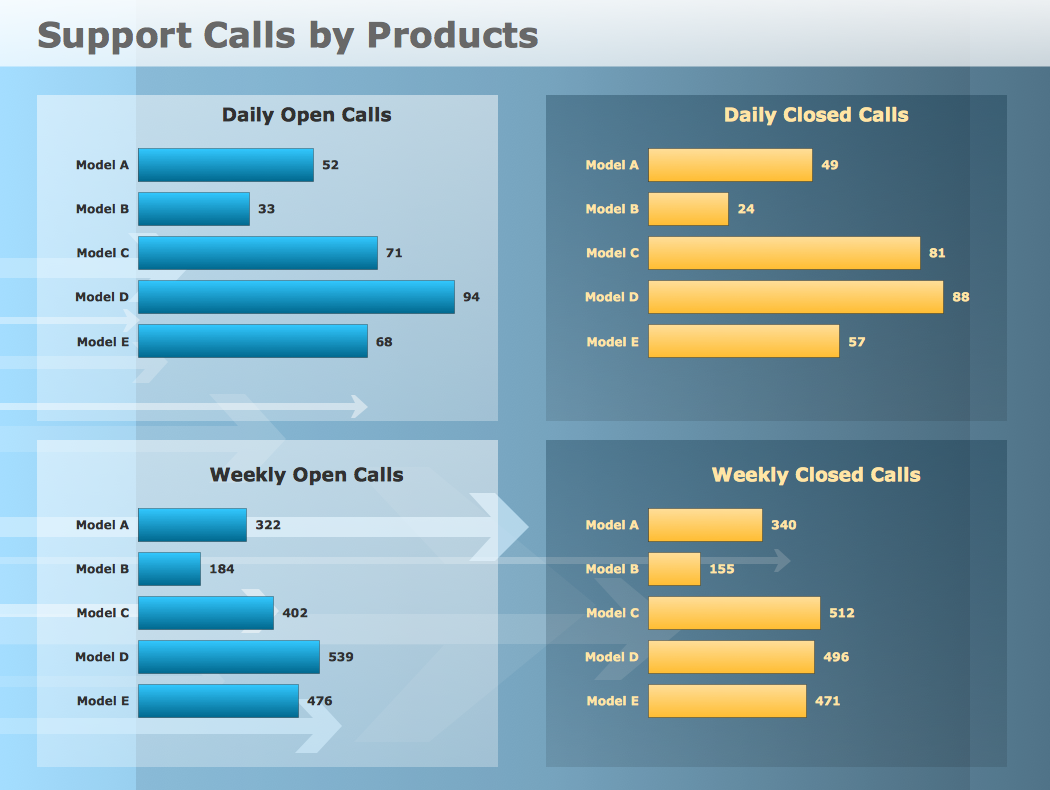
ConceptDraw Sales Dashboard is an automatically updated sales dashboard you can customize to see KPI you need. You can access sales dashboard anywhere to get fresh data and use any minute to see how your business can improve.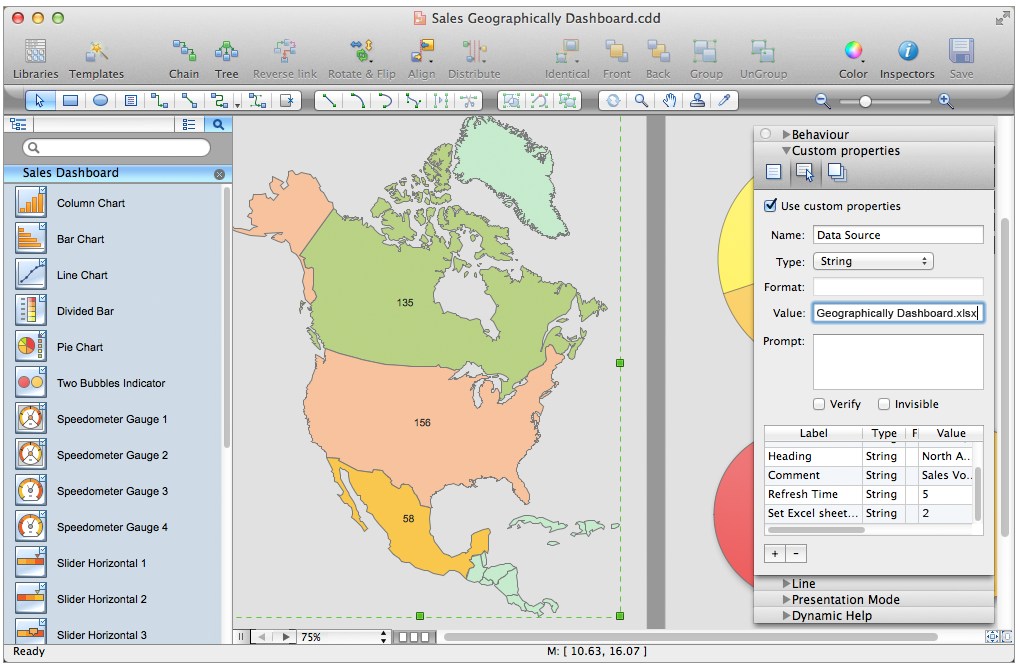
Picture: Sales Dashboard - Access Anywhere
Unfortunately, a man can’t predict the future and no one is safe from natural disasters, such as floods, earthquakes, hurricanes or fires. Nonetheless, what you can do to ensure safety for you and your relatives is to create an emergency plan, so everyone will know what to do if emergency happens. Keep that plan simple and train it several times a year so that no one could forget any details of it.
Fire and emergency plans are important to supply people with a visual safety solution. This diagram presents a set of standard symbols used to depict fire safety, emergency, and associated information. Using clear and standard symbols on fire emergency plans provides the coherence of collective actions , helps to avoid embarrassment, and improves communications in an emergent situation. The fire emergency symbols are intended for the general emergency and fire service, as well as for building plans ,engineering drawings and insurance diagrams. They can be used during fire extinguishing and evacuation operations, as well as trainings. It includes vector symbols for emergency management mapping, emergency evacuation diagrams and plans.
Picture: Emergency Plan
Related Solution:
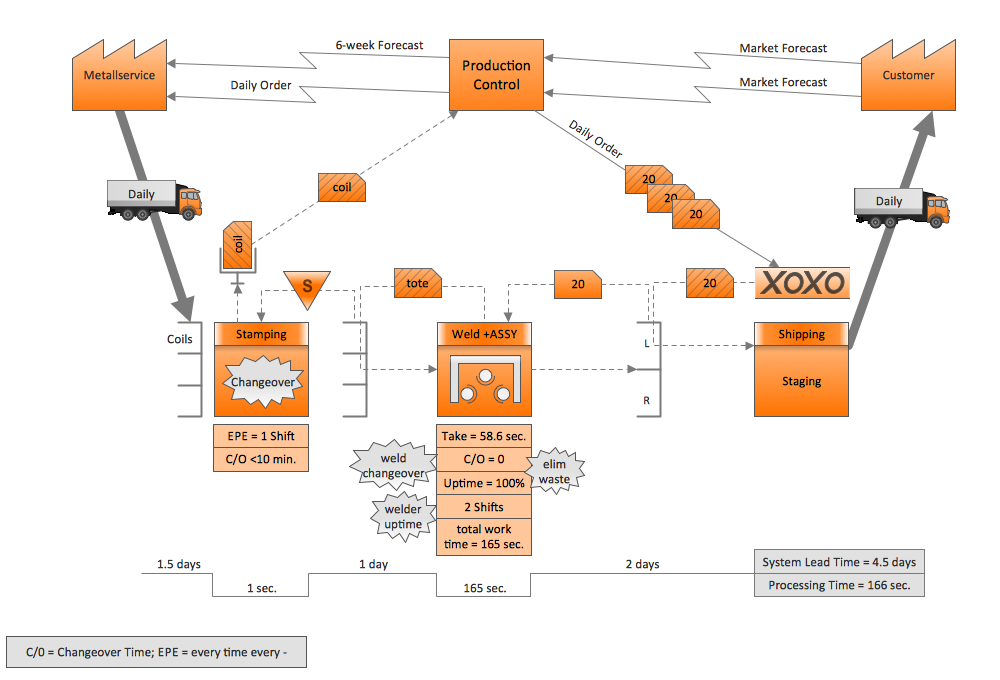
The Total Quality Management Diagram solution helps your organization visualize business and industrial processes. Create Total Quality Management diagrams for business process with ConceptDraw software.
Picture: Probability Quality Control Tools
Related Solution:
Use of various charts, diagrams and infographics is the most effective way of visual presenting information about healthy foods, healthy eating and healthy diet. ConceptDraw DIAGRAM diagramming and vector drawing software offers the Health Food solution from the Food and Beverage area of ConceptDraw Solution Park which is overfull of powerful drawing tools, libraries with ready-to-use vector objects and clipart, predesigned samples and examples which will help you easy design healthy foods illustrations.
Picture: Healthy Foods
Related Solution:
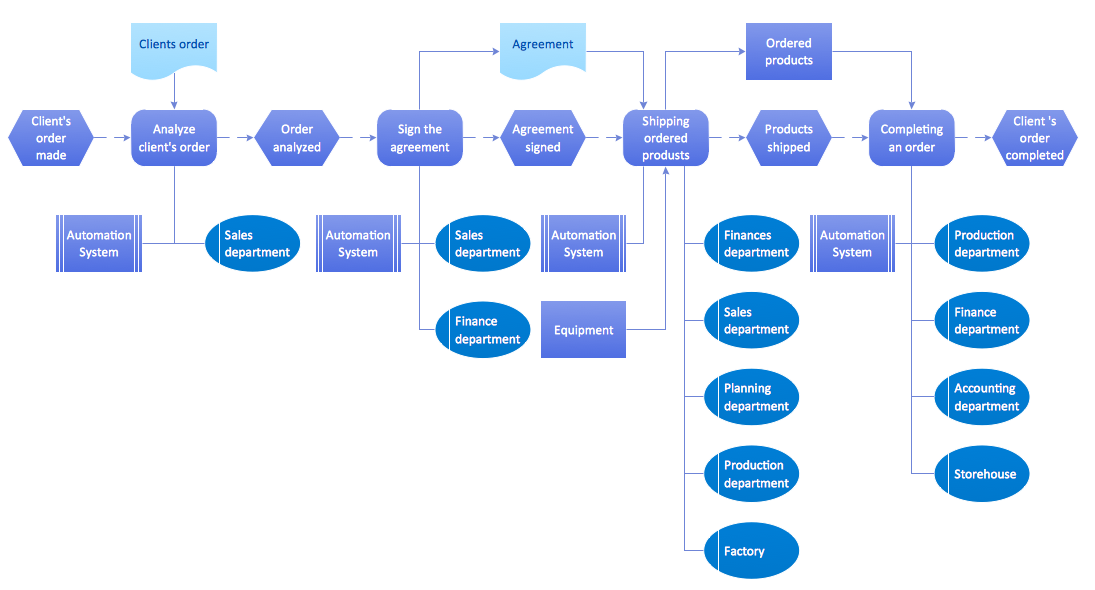
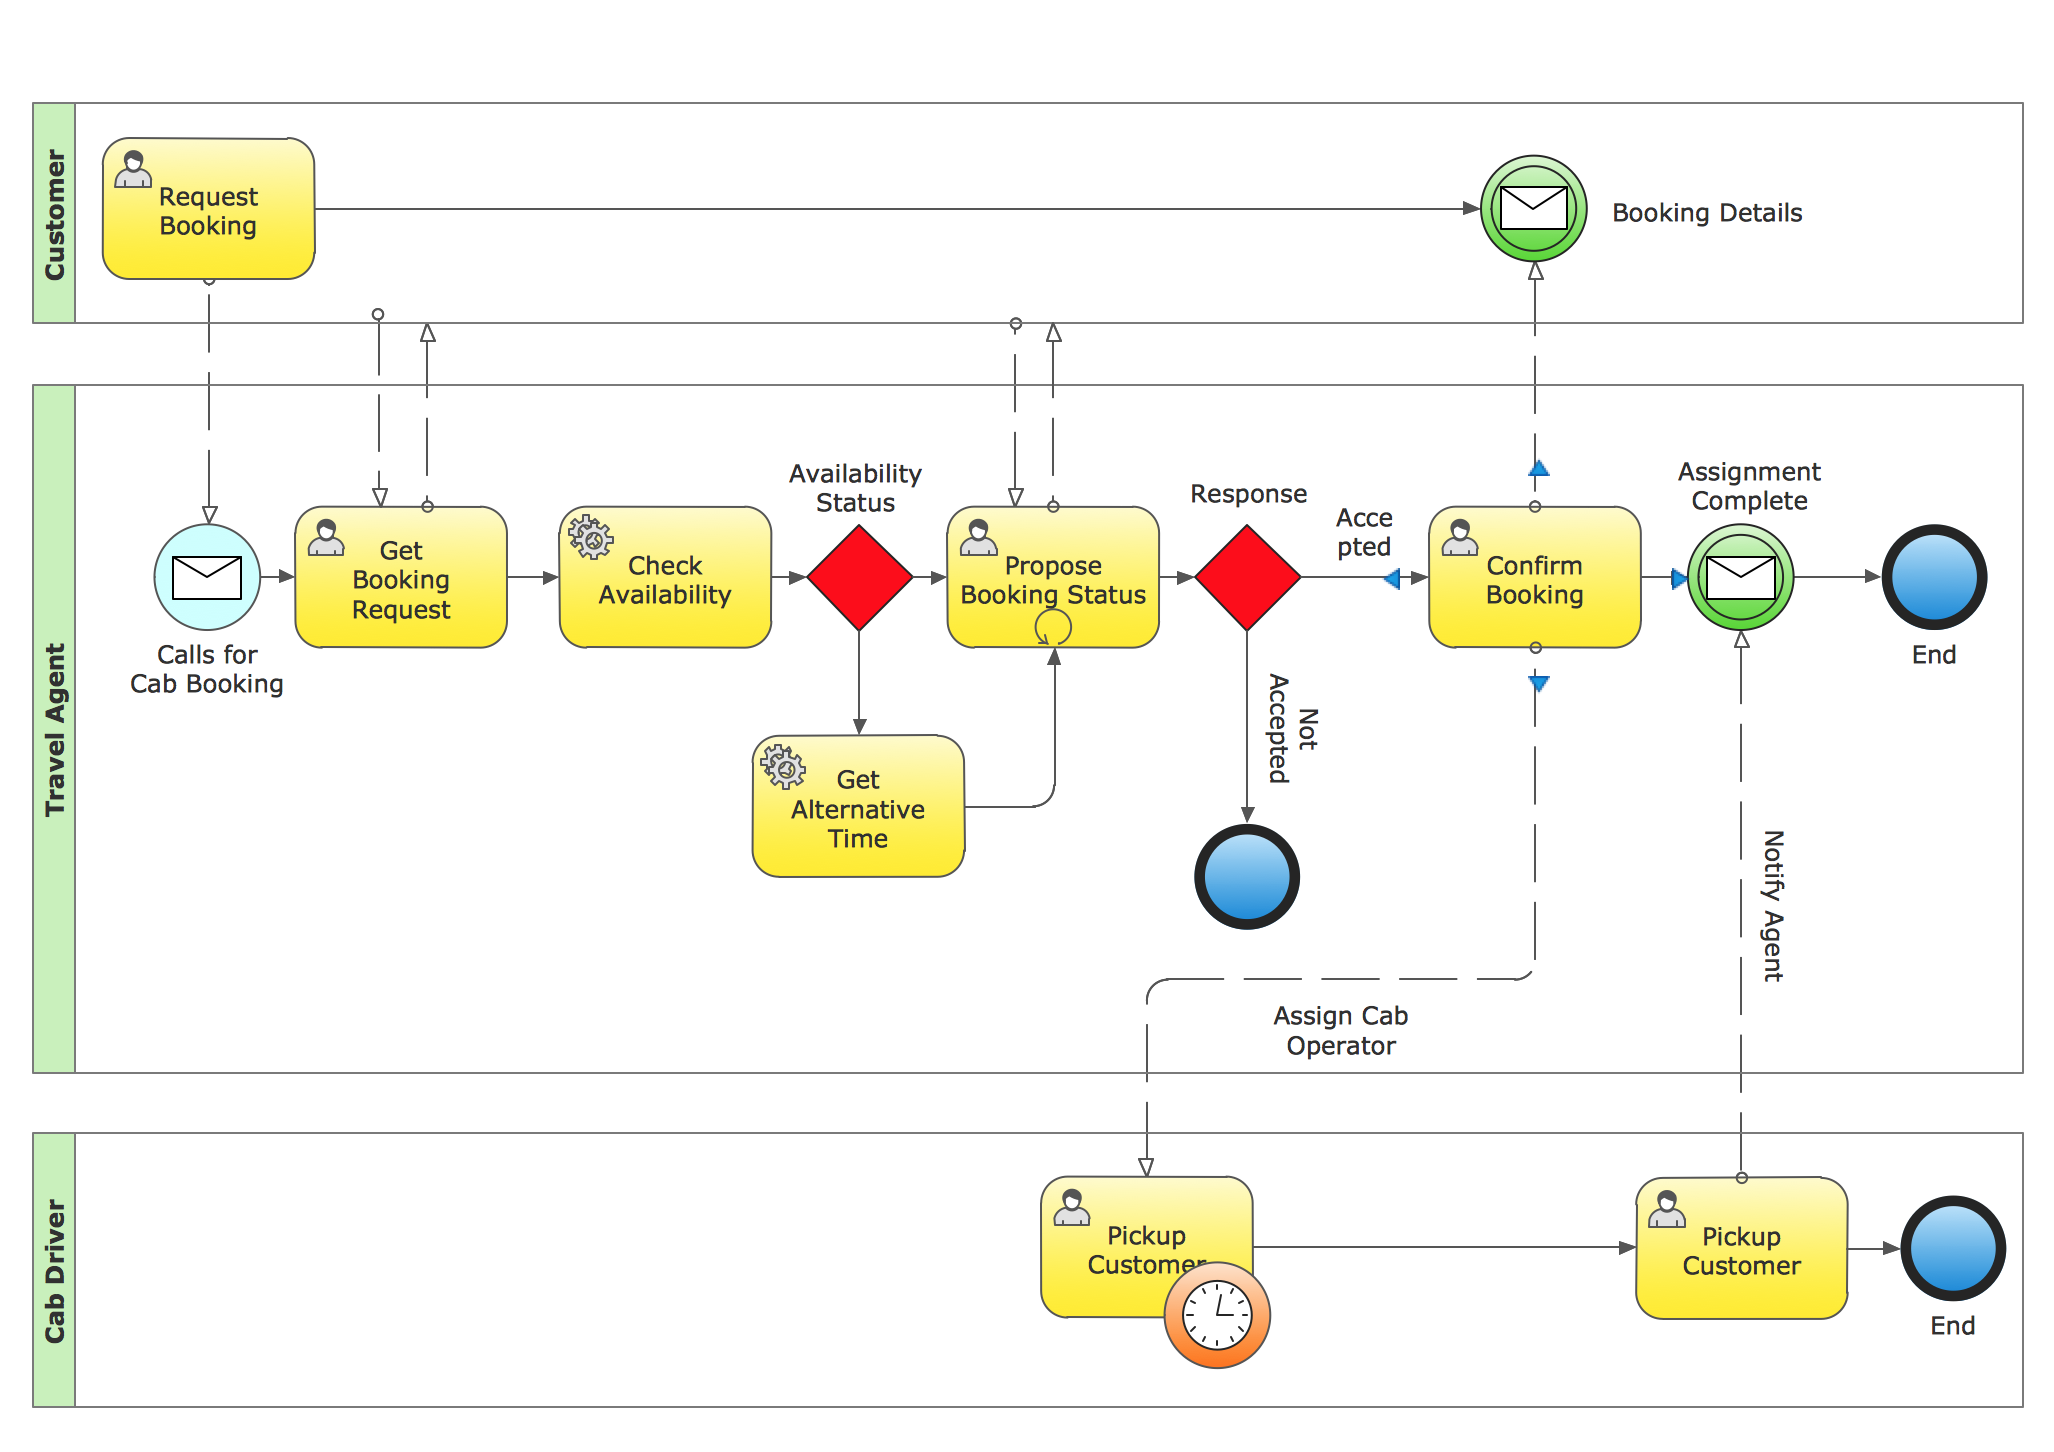
Take a look on an example of Cross-Functional-Flowchart, showing the software service cross-function process flowcharts among the different departments. It presents a simple flowchart among the customer, sales, technical support, tester and development.
Try now Flowchart Software and Cross-Functional library with 2 libraries and 45 vector shapes of the Cross-Functional Flowcharts solution. Then you can use built-in templates to create and present your software service cross-function process flowcharts.
Picture: Cross Functional Flowchart Examples
A Telecommunications network is a network of nodes, links, trunks and telephone switches that are connected, operated by telephone companies and realize telephone, audio, visual and data communications among the users. The telecommunications network can also include Internet, microwave, wireless equipment.
This example was created in ConceptDraw DIAGRAM using the Computer and Networks Area of ConceptDraw Solution Park and shows the Telecommunications network.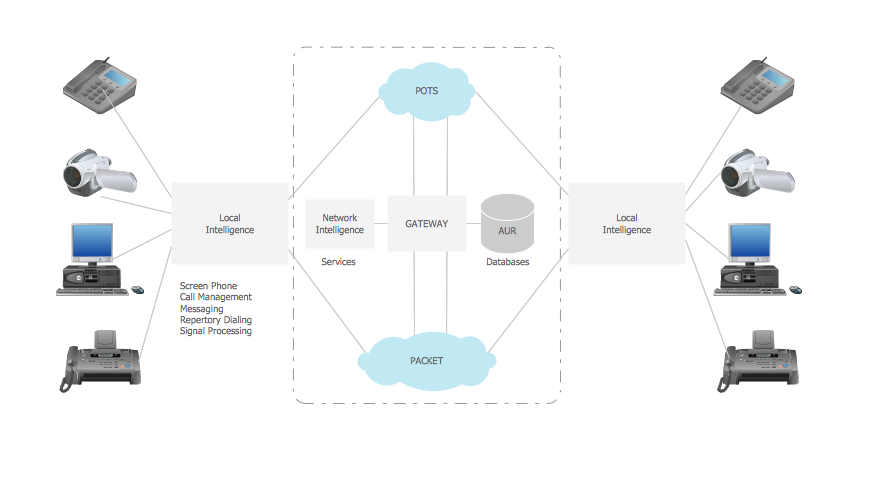
Picture: Telecommunication networks. Computer and Network Examples
Related Solution:
Create your own Linux audit flowcharts using the ConceptDraw DIAGRAM diagramming and vector drawing software extended with the Audit Flowcharts solution from the Finance and Accounting area of ConceptDraw Solution Park.
This flowchart example describing auditd, the linux audit tool.
Picture: Linux Audit Flowchart Example. Flowchart Examples
Related Solution:
 Audit Diagram
 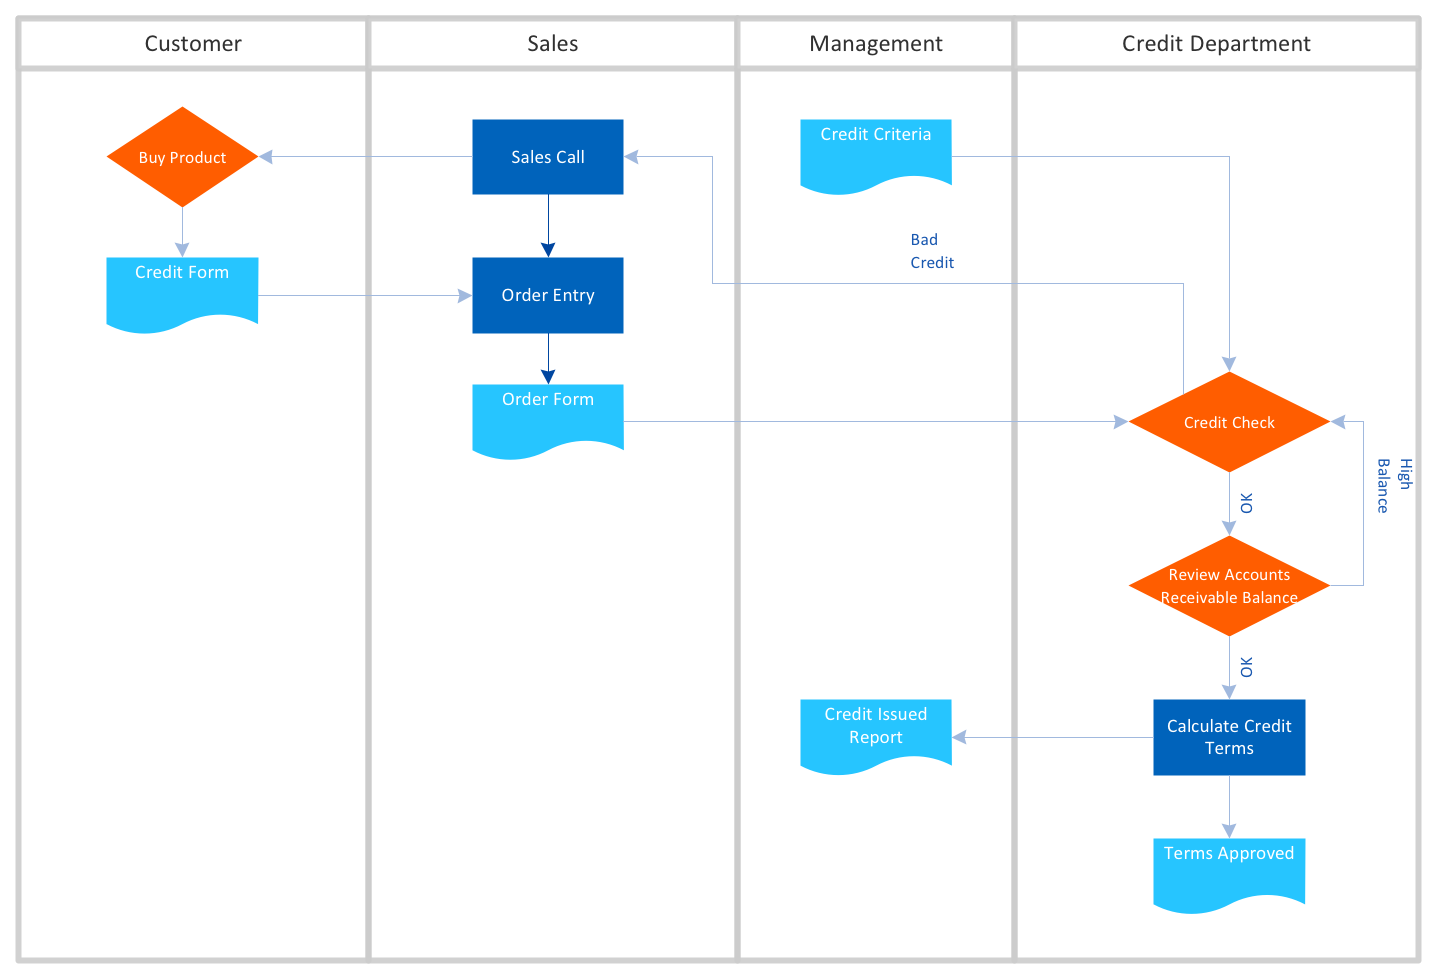 Basic Flowchart


/Diagramming-Chen-ERD-Sample61.png)