
Pic.1 Scientific Symbols Chart
This Scientific Symbols Chart shows the objects of geometric figures of the Solid Geometry library.
Use ConceptDraw DIAGRAM diagramming and vector drawing software with Mathematics Solution to design your own mathematic illustrations quick and easy.
The documents of ConceptDraw DIAGRAM ector graphic documents. They are available for reviewing, modifying or converting to a variety of formats: image, HTML, PDF file, MS PowerPoint Presentation, Adobe Flash or MS Visio.
See also Samples:
TEN RELATED HOW TO's:
Network Topology in communication networks, a topology is a usually schematic description of the arrangement of a network, including its nodes and connecting lines. There are two ways of defining network geometry: the physical topology and the logical topology.
Network Topology Mapper offers extensive drawing tools professional-looking network diagrams quickly and easily allowing you to clearly represent and communicate network architecture, topology, and design to engineers, stakeholders and end-users.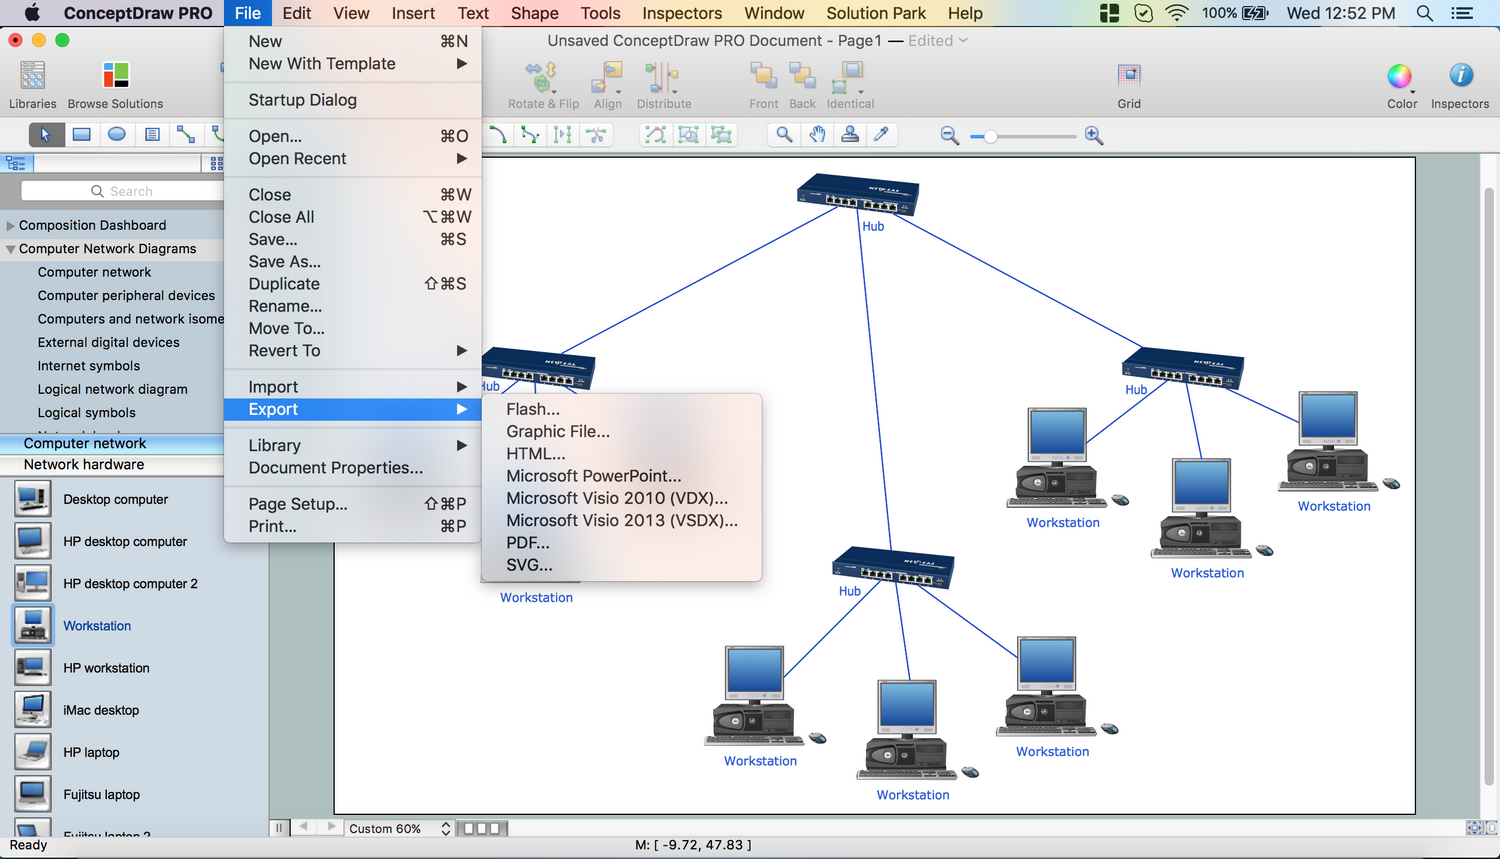
Picture: Network Topology Mapper
Related Solution:
Data base diagrams describes inter-related data and tables. It describes roles and relationships, internal and external dependencies, data exchange conventions and structures of knowledge domain.
ConceptDraw Software provides number of data-base chart libraries including major 49 vector symbols. Use these DFD flowchart symbol libraries to design data-base structure and models, use it to design data base process-oriented models, or simple data-oriented models. The are special drawing tools for making data flowcharts, data process diagrams, structured analysis diagrams, and information flow diagrams.
Picture: Database Flowchart Symbols
Related Solution:
The first step to optimize a workflow is to get its visual depiction. Then you can analyse and optimize the workflow making changes to your workflow diagram. We recommend to use ConceptDraw DIAGRAM software extended with the Workflow Diagram solution to visualize and optimize your workflow. It allows you produce easy-to-change scalable vector graphic workflow and then present it to your team or partners.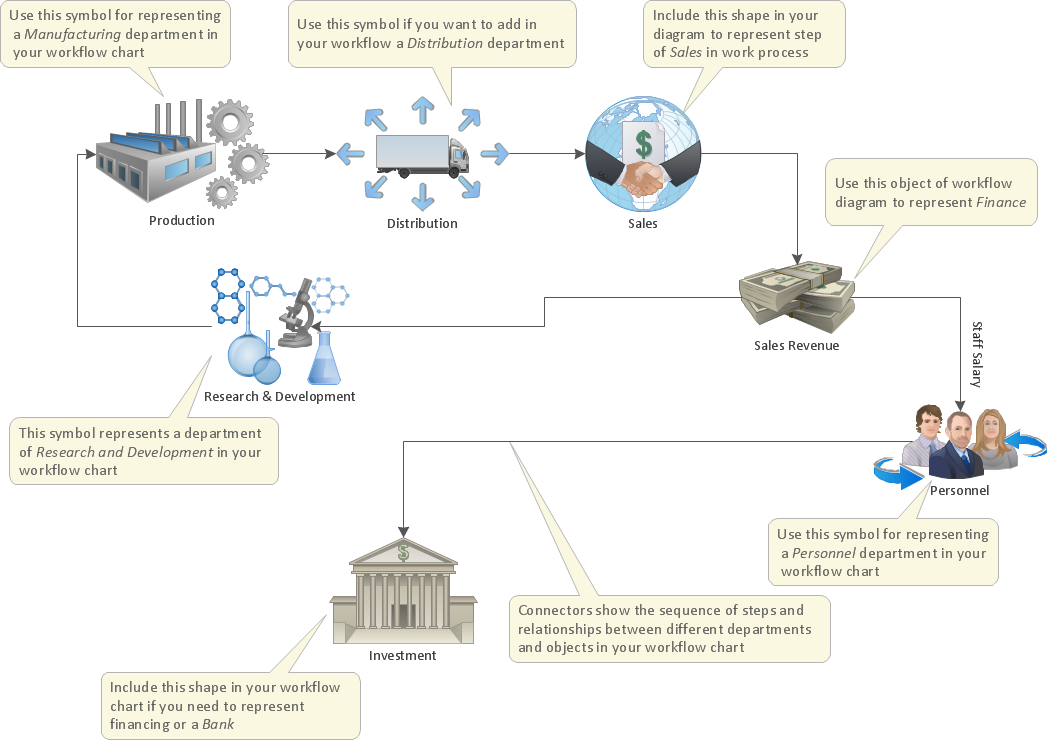
Picture: Optimize a Workflow
Related Solution:
The question how to create a column chart have a simple answer. Use ConceptDraw tips to find out how to create a column chart depicts your data the best way.
Picture: How to Create a Column Chart
Related Solution:
Event-Driven Process Chain flowcharts for improvement throughout an organisation.
ConceptDraw DIAGRAM is a software for making EPC flowcharts to provide business process modelling. Its excellent business process improvement tools.
Picture: An Event-driven Process Chain (EPC) - flowchart used for business process modelling
Related Solution:
Any information system receives data flows from external sources. In order to visualize them there is a list of data flow diagram symbols that describes how the system components cooperate. If you want to create a data flow diagram, ConceptDraw DIAGRAM Solution Park has DFD Library that contains both Yourdon and Gane-Sarson notations.
This figure shows the content of vector libraries, delivered with ConceptDraw solution for data flow diagram (DFD). There are three libraries composed from about 50 vector objects used to make data flow diagrams.
They include a complete set of objects utilized by Yourdon-Coad and Gane-Sarson notations - two primary notations that are apply for data flow diagramming. Also, one can discover additional "Data flow diagram (DFD)" library that provides a data flow diagram elements for designing level 1 and context-level data flow diagrams.
Picture: Data Flow Diagram Symbols. DFD Library
Related Solution:
This sample shows the Spider Chart that represents the budget and spending for one organization and allows to compare them. The multivariate data are represented on the Spider Chart as a two-dimensional chart with four or more variables displayed on the axes that start in one point. The Spider Charts are used in the management, business and sport.
Picture: Spider Chart Template
Drawing the diagrams we try to find in help the powerful software and now we have the ConceptDraw DIAGRAM. The ability easily create the SDL diagrams is made possible thanks to unique Specification and Description Language (SDL) Solution from the Industrial Engineering Area of ConceptDraw Solution Park. This solution extends ConceptDraw DIAGRAM 2 libraries - SDL Connectors and SDL Diagrams that contain 70 predesigned SDL flowchart symbols.
Picture: SDL Flowchart Symbols
Related Solution:
Action Plan - For the action planning define people and groups involvement in corrective actions by roles, identify logical sequences of scheduled actions and critical path of problem solving, identify possible risks of action plan and propose preventive actions.
ConceptDraw Office suite is a software for decision making and action plan.
Picture: The Action Plan
ConceptDraw DIAGRAM diagramming and vector drawing software extended with Physics solution from the Science and Education area is the best for creating: physics diagrams, pictures which describe various physical facts and experiments, illustrations of various electrical, mechanical and optic processes, of any complexity quick and easy.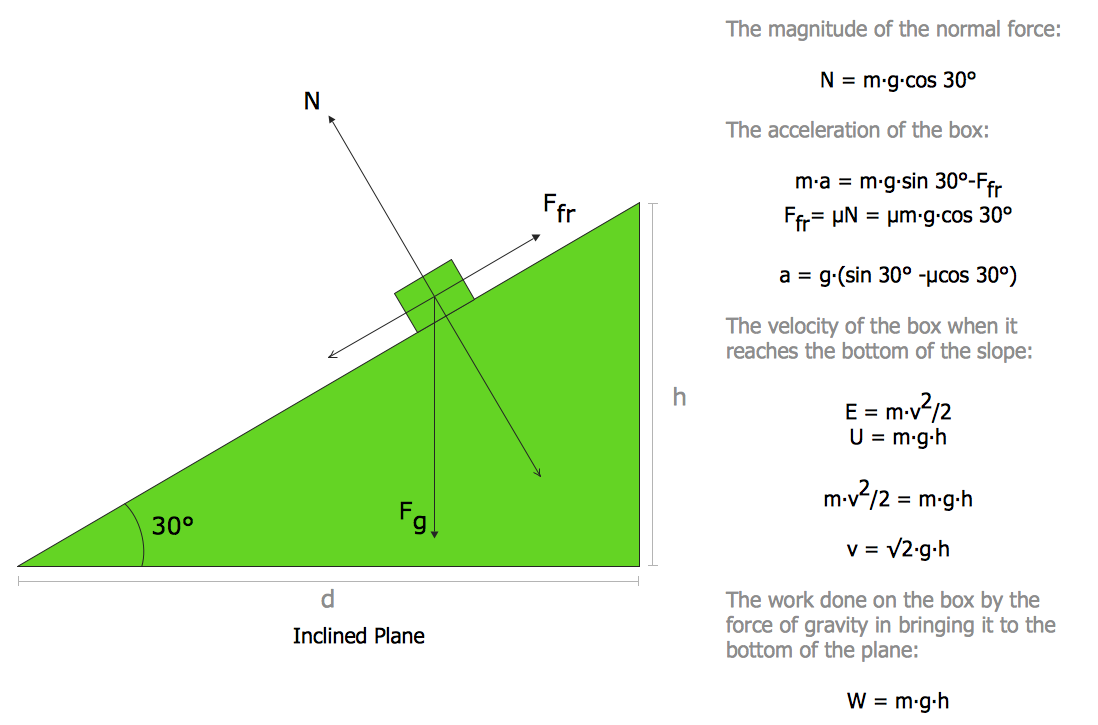
Picture: Physics Diagrams
Related Solution: