Cross-Functional Flow Chart sample: Trading Process Diagram.
This example created with ConceptDraw DIAGRAM - Drawing Software for Vertical Cross Functional Flowchart.
TEN RELATED HOW TO's:
Flowcharts are used to represent accounting information in a system. In ConceptDraw software there are special symbols that are used to create accounting flowcharts.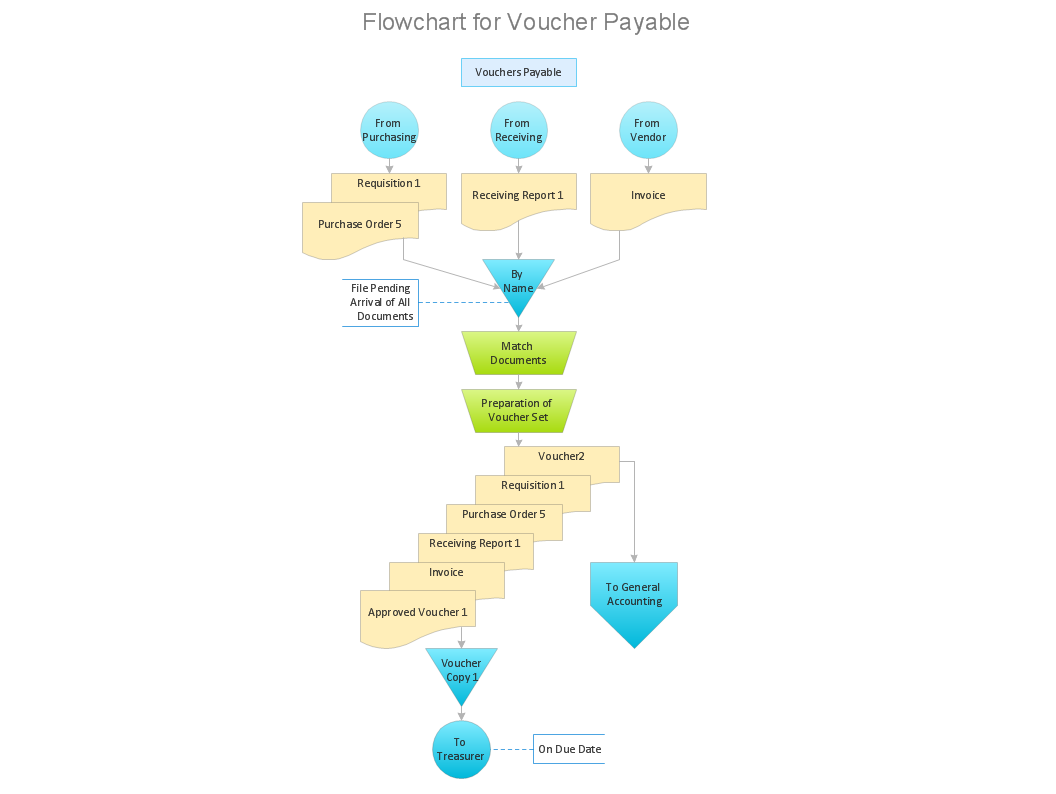
Picture: Why Flowchart is Important to Accounting Information System?
Related Solution:
In case you need to make a plan for your own future hotel or to do it for someone else, then you can always find the way to make such template very quickly and to have a very good looking result in the end. Whichever type of the hotels you want to illustrate in a way of a floor plan, you can always do it with ConceptDraw DIAGRAM drawing application.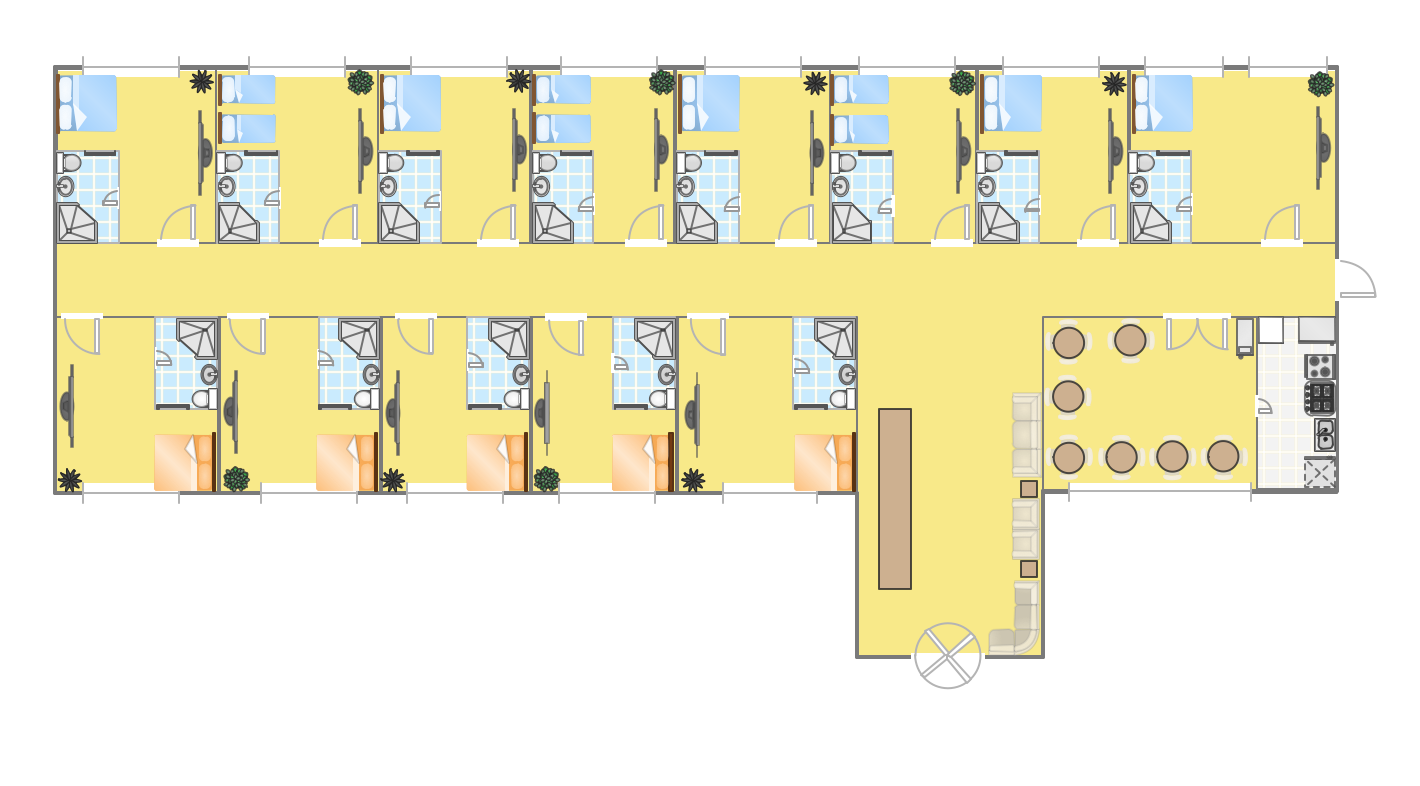
Picture: Hotel Plan. Hotel Plan Examples
Related Solution:
ConceptDraw DIAGRAM is the beautiful design software that provides many vector stencils, examples and templates for drawing different types of illustrations and diagrams.
Mathematics Solution from the Science and Education area of ConceptDraw Solution Park includes a few shape libraries of plane, solid geometric figures, trigonometrical functions and greek letters to help you create different professional looking mathematic illustrations for science and education.

Picture: Scientific Symbols Chart
Related Solution:
Create flowcharts, organizational charts, bar charts, line graphs, and more with ConceptDraw DIAGRAM.
Picture: Basic Diagramming
Related Solution:
A key point of conference success is the ability to see slides in real time, and hold documented discussions during the meeting. Remote Presentation for Skype is a new solution allows real-time presenting that benefits work groups who need collaborate by web meetings.
Picture: How To Make the Right Decision in Projects
Related Solution:
ConceptDraw DIAGRAM extended with Windows 8 User Interface solution from the Software Development area is the best gui software. Using the drawing tools, libraries of vector objects, graphical user interface examples that offers Windows 8 User Interface solution, you will easily design the Windows 8 user interfaces and Windows 8 UI design patterns of any complexity.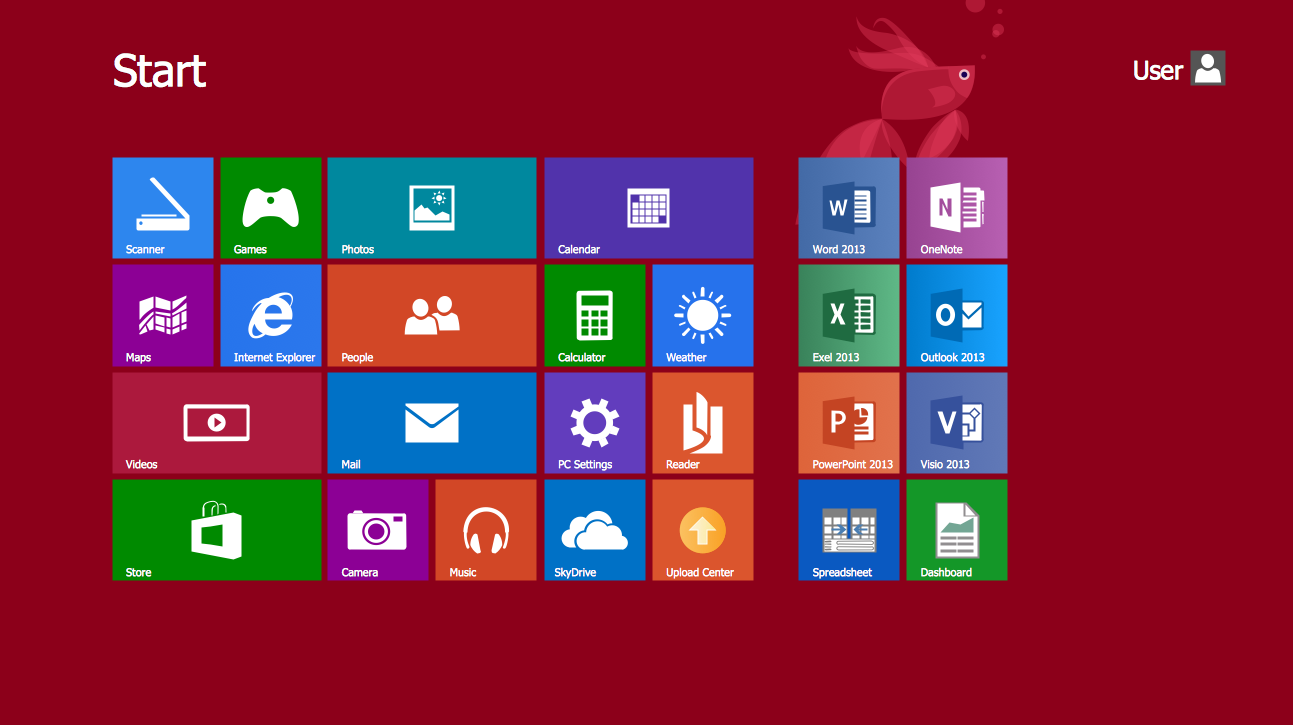
Picture: Graphical User Interface Examples
Related Solution:
An architectural design is a technical drawing of a building. Creating of the architectural design is the important part in the architecture and building. It is a way for the architects to represent their ideas and concepts, to develop the design idea to the concrete proposal. It' very convenient for architects to create the architectural design using the computer software.
СonceptDraw DIAGRAM is a powerful CAD drawing software. Using the Floor Plans Solution from the Building Plans area of ConceptDraw Solution Park you can create professional looking architectural designs quick, easy and effective.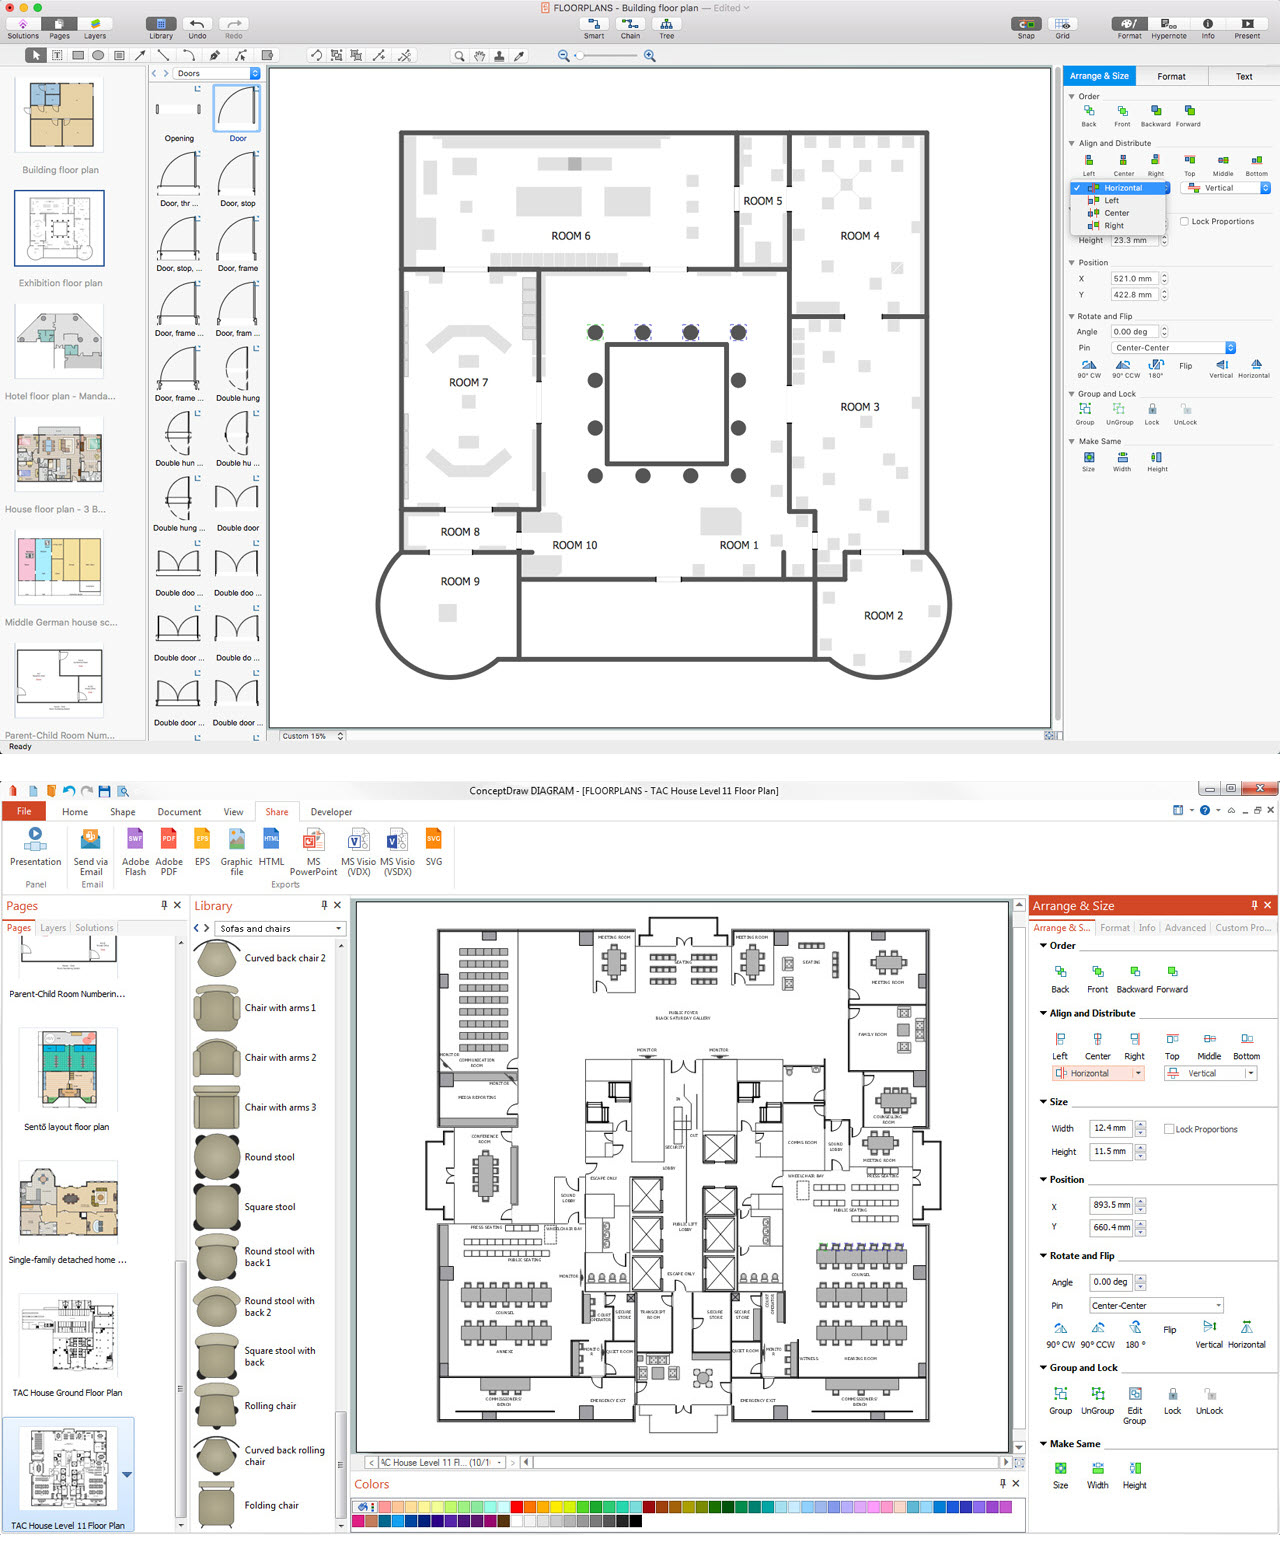
Picture: CAD Drawing Software for Architectural Designs
Related Solution:
When you are drawing a cross-functional flowchart with ConceptDraw Arrows10 Technology - you get it easily and fast.
ConceptDraw Template library has more than enough versatility to draw any type of diagram with any degree of complexity.
You will get a cross-functional flowchart with basic shapes which can be drawn in minutes, as the result.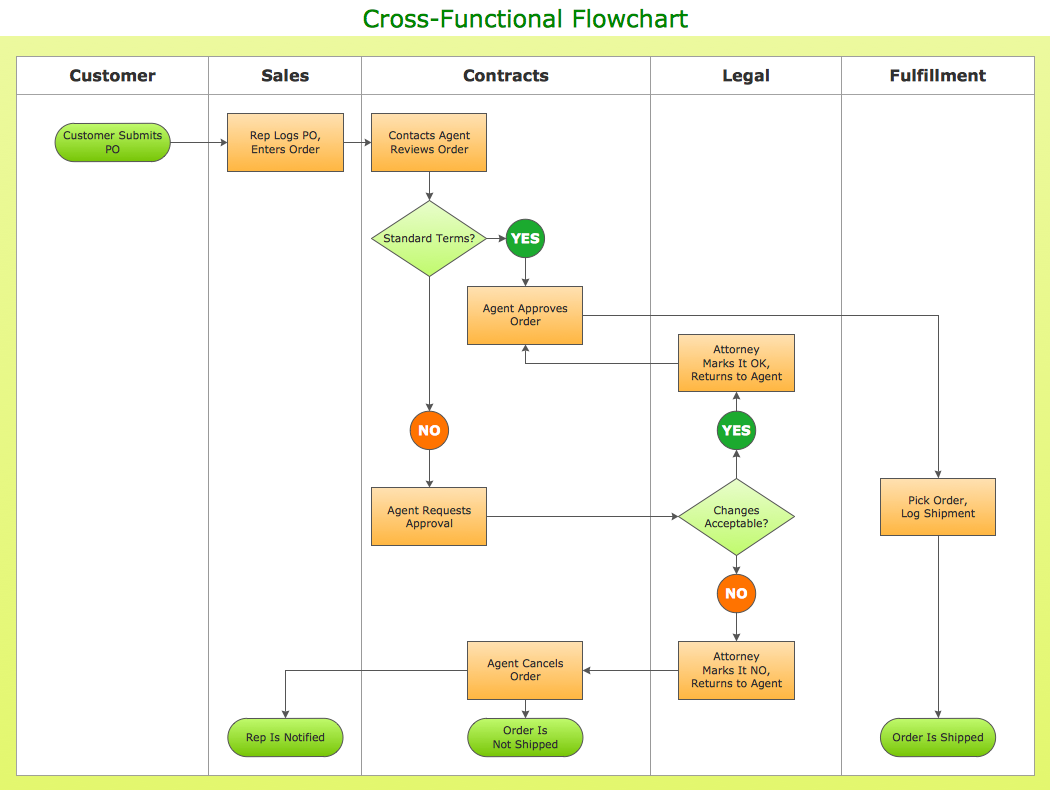
Picture: Cross Functional Flowchart Shapes
Perfect charts and graphics diagramming software with rich examples and template. ConceptDraw is ideal to draw Charts and Graphics.
Picture: Basic Diagramming
Related Solution:
ConceptDraw helps you to start designing your own UML Collaboration Diagrams with examples and templates.
Picture: Diagramming Software for Design UML Collaboration Diagrams
