Made with
ConceptDraw
DIAGRAM 18

Swim Lane Flowchart Symbols

Swim lanes are visual elements (parallel lines) which divide the diagram into the lanes for visually distribution the processes, sub-processes of a business process, decisions at these lanes and widely used at Flowcharts, Flow Diagrams and Maps, Process Flow Diagrams and Process Models, Cross-Functional Flowcharts, BPMN and UML diagrams.

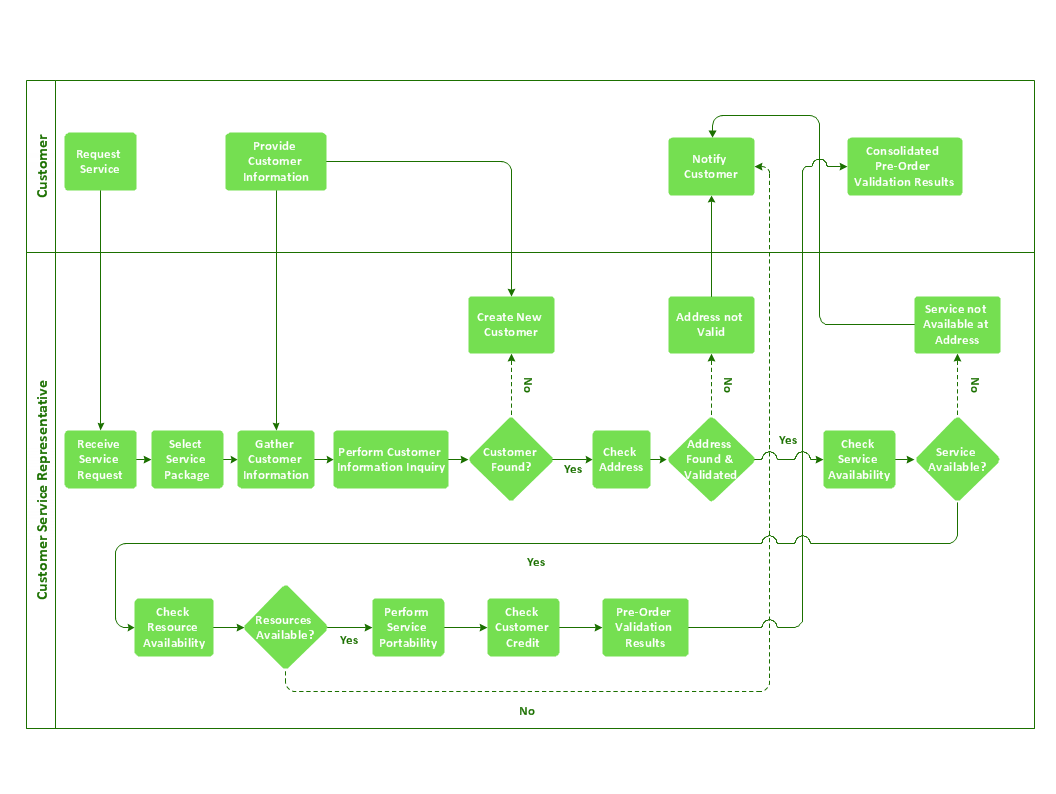
Swim Lane Diagrams are one of the most popular way of description complex processes with multiple participants and an essential part of flowcharting. Swim lanes can be arranged horizontally or vertically, depending on the type of Process Flow Diagram, requirements, convenience or personal taste. The lanes are marked with names, each lane is allocated for one person, actor, group, or department and contains the steps performed by it, tasks and sub-processes. The arrows between the lanes represent transmission of information or materials between the subprocesses. So, the Swim Lane Flowchart depicts in details the whole process, the roles, responsibilities and dependencies of each person or group.

The ability to quick and simply create professional-looking Swim Lane Flowcharts and Swim Lane Process Maps is made possible owing the powerful Business Process Diagram and Business Process Mapping solutions from the Business Processes area of ConceptDraw Solution Park. Pay please your attention for the Swimlanes and Swimlanes BPMN 1.2 libraries from the Business Process Diagram solution and for the Swim Lanes library from the Business Process Mapping solution. These libraries contain the set of special professionally developed swim lane flowchart symbols - single, multiple, vertical and horizontal lanes which are the perfect basis for your Swim Lane Flowcharts of processes, algorithms and procedures.

Swim Lane Flowchart Symbols *

Example 1. Swim Lane Flowchart Symbols

The Swimlanes library from the Business Process Diagram solution contains 20 elements of vertical/horizontal pools and lanes, and flows; Swimlanes BPMN 1.2 library from the Business Process Diagram solution contains 8 vector elements; Swim Lanes library from the Business Process Mapping solution contains 12 vector elements.

Swimlanes BPMN 1.2 Library Design Elements

Example 2. Swimlanes BPMN 1.2 Library Design Elements

Use the corresponding type of predesigned swim lane element according to the type of the diagram you want to draw, dragging it from the suitable library to the document page.

Swimlanes BPMN 2.0 Library Design Elements

Example 3. Swimlanes BPMN 2.0 Library Design Elements

Additionally you can find and use the swim lane elements included to other ConceptDraw's libraries, such as Cross-Functional Flowcharts library from the Cross-Functional Flowcharts solution, UML Activity library from the Rapid UML solution, Bank UML Activity Diagram library from the ATM UML Diagrams solution, and some others, which are needed for designing the corresponding types of diagrams and flowcharts.

Swim Lanes Library Design Elements

Example 4. Swim Lanes Library Design Elements

Take the benefit from the ConceptDraw's RapidDraw and Action features that allow to concentrate your attention on the diagram content, not on the drawing process. Use the Rapid Draw button on the Shape toolbar to activate the RapidDraw mode and then add each next object using the RapidDraw arrows and choosing new object from the pop-up menu when you bring the mouse cursor over already created object.

The object's Action menu at the object's right top corner offers the set of commands which allow easy modify this object.

Applying of ConceptDraw's RapidDraw and Action features

Example 5. Applying of ConceptDraw's RapidDraw and Action features

Apply also the Line, Fill, Shadow, Text and Align tools to format your diagram objects to easy make your diagrams, flowcharts and maps accurate, bright, pictorial and attractive.

Business Process Swim Lane Flowchart

Example 6. Business Process Swim Lane Flowchart

It is incredibly convenient to start drawing the Swim Lane flowcharts and diagrams with predesigned templates and samples great quantity of which is developed by professionals and offered at ConceptDraw STORE.

Business Process Diagram and Business Process Mapping solutions

Example 7. Business Process Diagram and Business Process Mapping solutions

Use the offered variety of swim lane flowchart symbols from the libraries of Business Process Mapping and Business Process Diagram solutions for ConceptDraw DIAGRAM diagramming and vector drawing software and also collection of professionally developed Diagrams, Maps and Swim Lane Flowchart samples and templates from ConceptDraw STORE to get the perfect results in flowcharting design quick, easy and effective.


EIGHT RELATED HOW TO's:
ConceptDraw Pyramid Diagram software allows drawing column charts using predesigned objects or drawing tools. In ConceptDraw Pyramid Diagram software you can find a complete set of column chart tools and objects.How to Create a Pyramid Diagram *
Picture: How to Create a Pyramid Diagram
Related Solutions:
A model of a system is defined as a set of hierarchical diagrams representing the asynchronous process of data transformation from the moment it is input to the system to the moment it is output to the user. To demonstrate how a process transforms the initial data, you should design a data flow diagram using a DFD Library included in ConceptDraw DIAGRAM Solution Park. Start your diagramming experience now! You can use this library of symbols related to data flow diagrams (DFD) to design data-oriented or process-oriented models along with data process diagrams. This vector objects library It is a part of ConceptDraw solution designed for data flow diagramming, along with corresponding samples and templates. A data flow diagram is a 2D flowchart that depicts the sequence of particular activities and operations operations and activities which is accompanied by the dynamic flow of some data.Design Data Flow. DFD Library *
Picture: Design Data Flow. DFD Library
Related Solution:
You need to draw Authority Matrix Diagram quick and easy? Design it with ConceptDraw DIAGRAM! ConceptDraw DIAGRAM extended with Seven Management and Planning Tools solution from the Management Area is the best Authority Matrix Diagram Software.Authority Matrix Diagram Software *
Picture: Authority Matrix Diagram Software
Related Solution:
For documenting the Cloud Computing Architecture with a goal to facilitate the communication between stakeholders are successfully used the Cloud Computing Architecture diagrams. It is convenient and easy to draw various Cloud Computing Architecture diagrams in ConceptDraw DIAGRAM software with help of tools of the Cloud Computing Diagrams Solution from the Computer and Networks Area of ConceptDraw Solution Park.Cloud Computing Architecture Diagrams *
Picture: Cloud Computing Architecture Diagrams
Related Solution:
Bubble diagrams solution extends ConceptDraw DIAGRAM software with templates, Using ConceptDraw Connectors, you can make a bubble chart in moments. Using ConceptDraw you will be able to make a bubble chart from the ready ConceptDraw library objects or make your own objects. The created diagram can represent ideas organization, in brainstorming processes, by teachers for explaining difficult ideas or for presentations.How To Make a Bubble Chart *
Picture: How To Make a Bubble Chart
Related Solution:
A process flow chart is a sequence diagram on events, actions, tasks and decisions that are visualized in a form of inputs and outputs. Such flow chart involves a defined number of standard symbols and notation keys used to help one understand and pass the information. Process flow charts have become a day-to-day tool for chemical engineers, technologists and production engineers as well as software developers. However, their use has recently increased in other areas such as business, manufacturing and, especially a service sector.Example Process Flow Chart
Picture: Example Process Flow Chart
Related Solution:
Flow chart is a diagrammatic representation of an algorithm and essential part of planning the system. Flow charts are widely used in technical analysis and programming for easy writing programs and explaining them to others. So, one of the most popular type of flow charts is Technical Flow Chart. Technical Flow Chart can be drawn by pencil on the paper, but it will be easier to use for designing a special software. ConceptDraw DIAGRAM diagramming and vector drawing software extended with Flowcharts Solution from the Diagrams Area of ConceptDraw Solution Park will be useful for this goal.Technical Flow Chart *
Picture: Technical Flow Chart
Related Solution:
Process mapping helps with sharing business results and reorganizing workflow. In almost every case, after creating a sales process flowchart the steps that are redundant become obvious for a manager. It's easy to find a flowchart examples that will help in developing one for your business. This sales process flowchart consists of a sequence of steps that represent a simple sale process. Each step is shown graphically by a rectangle representing processing steps or an activity, or a diamond representing a decision. These rectangles are linked by arrows, that indicate the direction of the sales workflow. ConceptDraw Sales Flowcharts solution delivers a the full set of classical flowchart notation symbols, along with sales-related icons and pictograms.Sales Process Flowchart
Picture:
Sales Process Flowchart
Flowchart Examples
Related Solutions:
ConceptDraw
DIAGRAM 18