Business People Clipart
Business people clipart - Vector clipart libraryThe vector stencils library Business people clipart is included in the Business and Finance solution from Illustration area of ConceptDraw Solution Park. Use it to make professional looking documents, presentations and websites, advertising, project management illustrations, or any design that requires clipart of currency, money, office, time, contacts and collaboration. The vector stencils library Business people clipart includes 12 images:
|
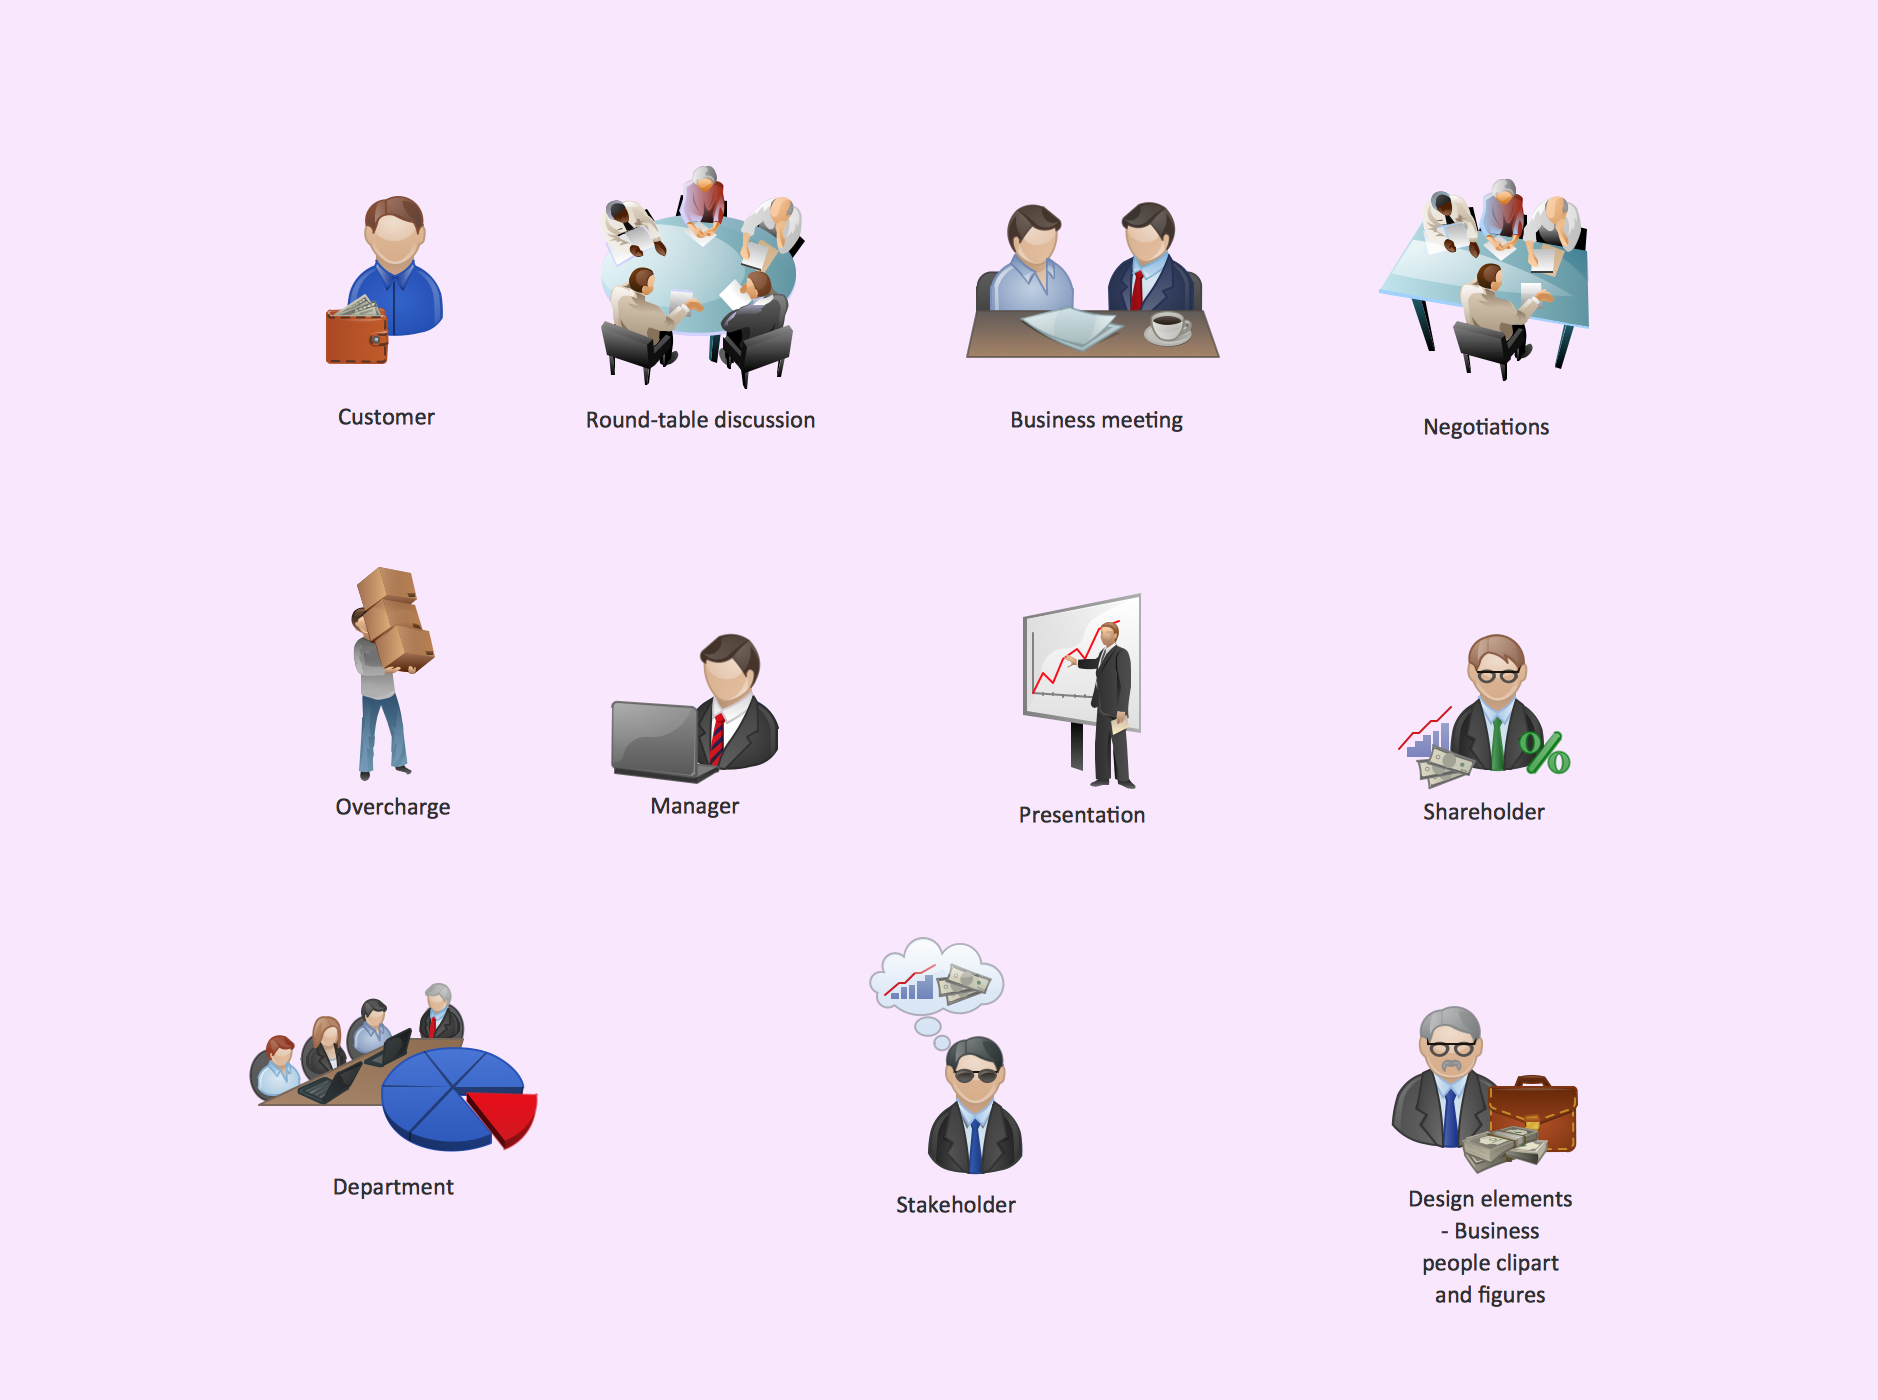
Pic.1 Business People Clipart
This document "Business people clipart" are vector graphic document. They are available for reviewing, modifying, or converting to a variety of formats (PDF file, MS PowerPoint, MS Visio, and many other graphic formats) from the ConceptDraw DIAGRAM Solution Park.
See also Samples:
- Illustration — Aerospace and Transport
- Illustration — Artwork
- Illustration — Audio, video, media
- Illustration — Business and finance
- Illustration — Computers and communications
- Illustration — Manufacturing
- Illustration — Nature
- Illustration — People
- Illustration — Presentation clipart
- Illustration — Safety and security
- Science & Education — illustrations
TEN RELATED HOW TO's:
ConceptDraw DIAGRAM is a professional software for building flowcharts quickly with auto-connect technology.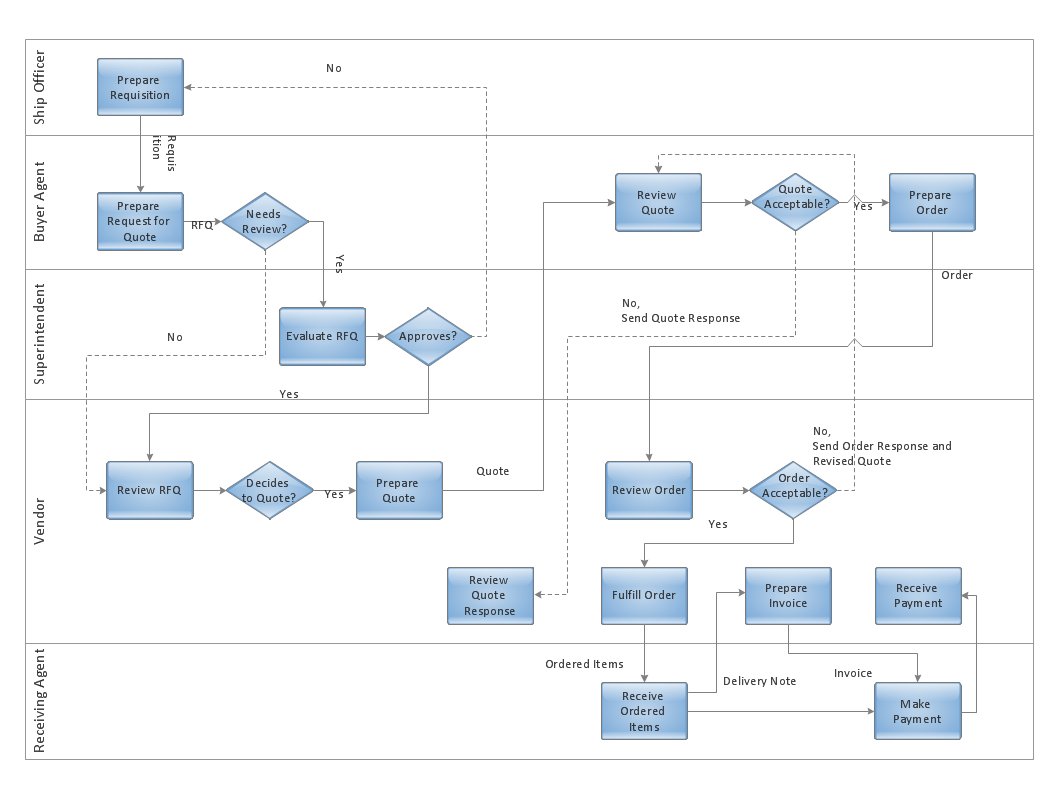
Picture: Build a Flowchart Quickly With AutoConnect
Related Solution:
Start design your own flowchart with ConceptDraw DIAGRAM and accomplish great results at the moment.
Picture: Draw Flowcharts with ConceptDraw
Related Solution:
ConceptDraw DIAGRAM is the best BPMN software for ✔️ modeling business processes, ✔️ graphical documenting processes, ✔️ analysis processes, ✔️ optimization business processes, ✔️ identifying inefficiencies, ✔️ efficient decision-making based on created Business Process Diagrams and Business Process Models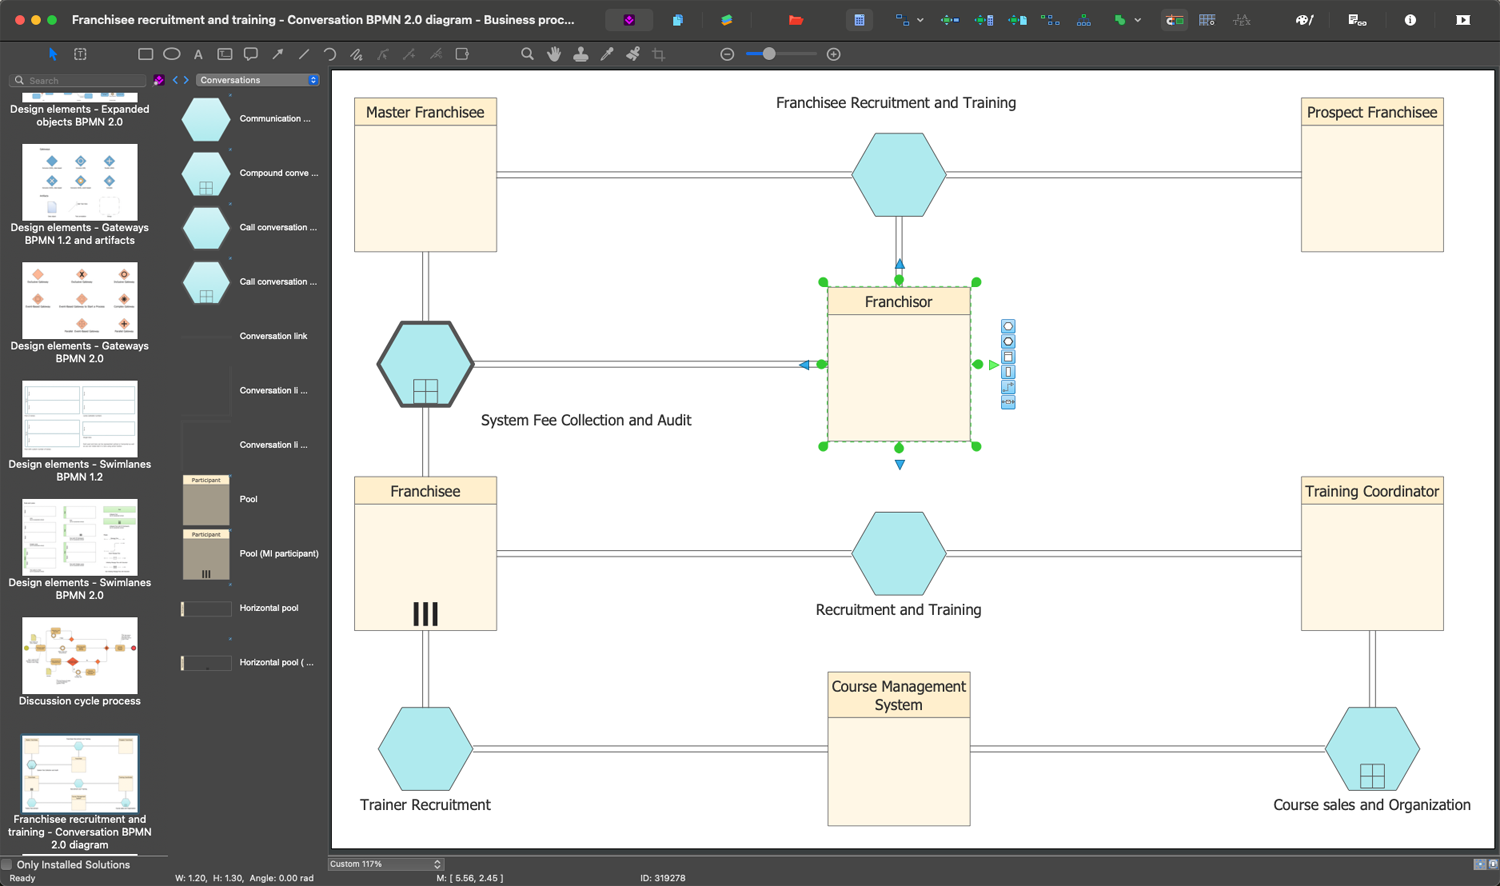
Picture: The Best Business Process Modeling Software: Comprehensive Guide
Related Solution:
ConceptDraw gives the ability to draw Flowchart documents. Flowcharts solutionis a powerful tool that extends ConceptDraw application for drawing business flowcharts.
ConceptDraw DIAGRAM vector diagramming and business graphics software enhanced with with templates, green and interactive flowchart makers, samples and stencil libraries from ConceptDraw Solution Park which all focused to help with drawing flowcharts, block diagrams, bar charts, histograms, pie charts, divided bar diagrams, line graphs, area charts, scatter plots, circular arrows diagrams, Venn diagrams, bubble diagrams, concept maps, and others.
Picture: The Best Flowchart Software Available
Related Solution:
All about prototyping. GUI Prototyping with ConceptDraw. Download prototyping software.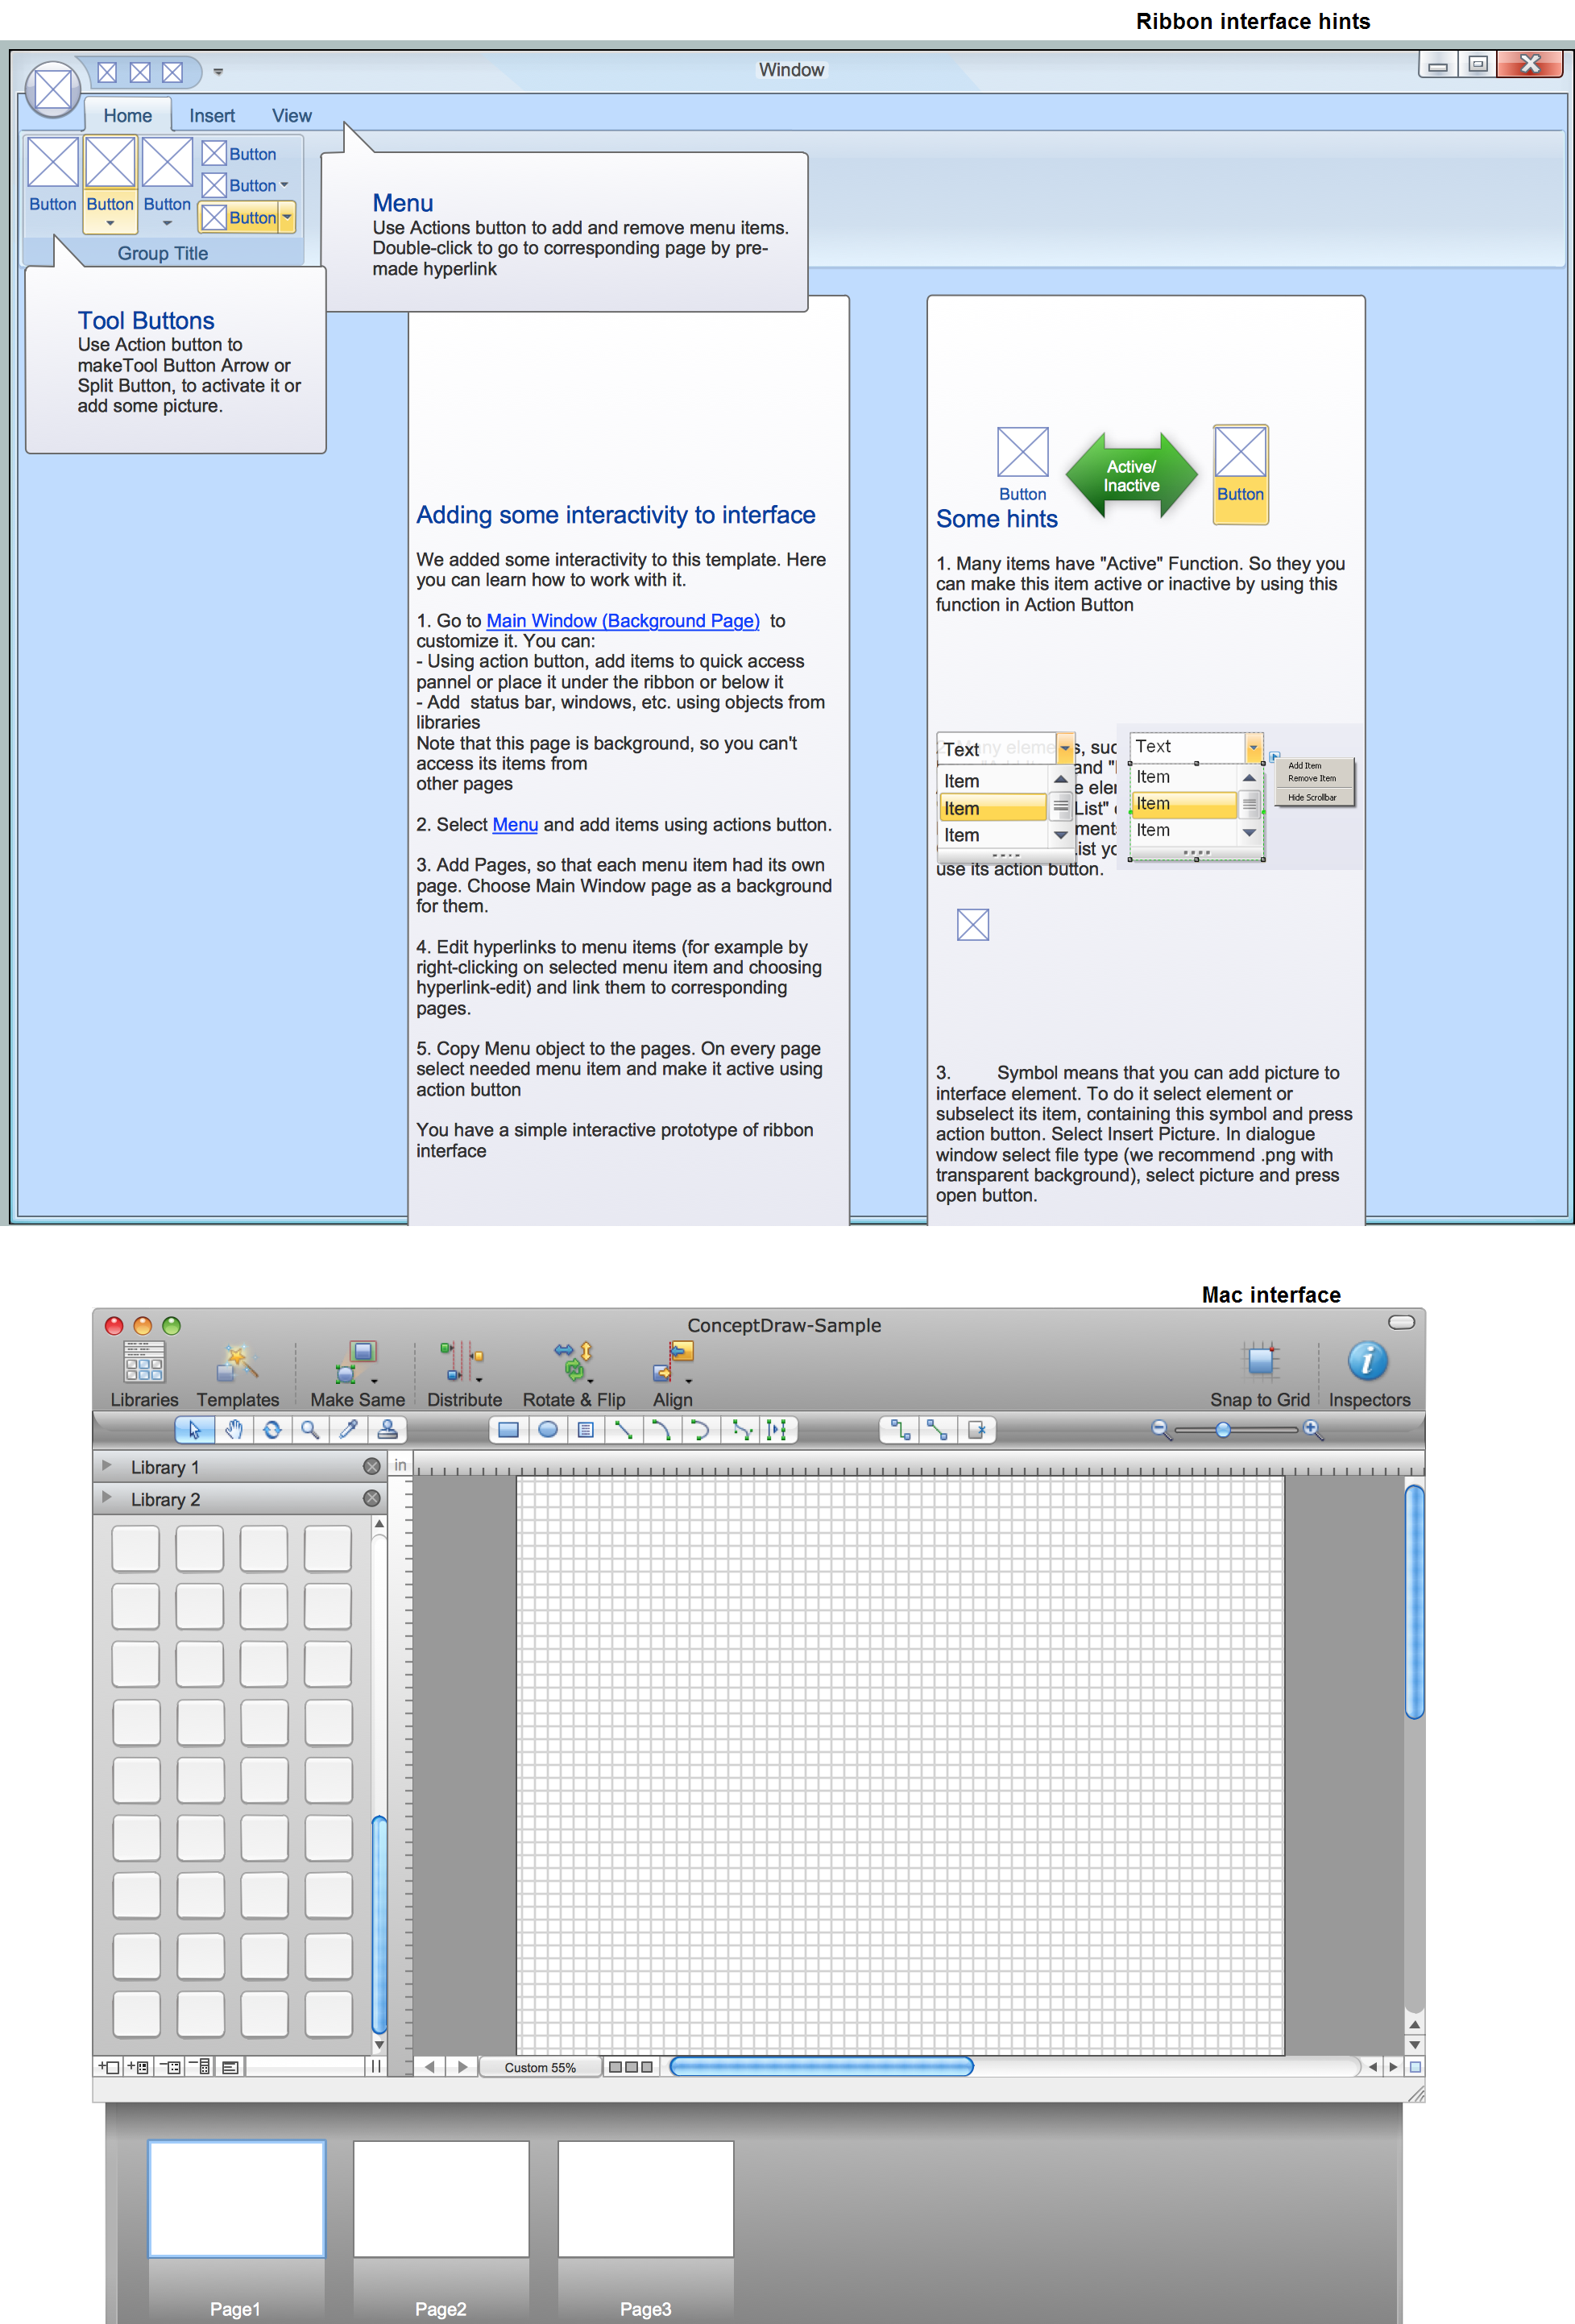
Picture: GUI Prototyping with ConceptDraw DIAGRAM
Office Concepts for the premises design have some specifics which are accounted by designers and architects at the construction and renovation of office buildings. Use ConceptDraw DIAGRAM extended with Office Layout Plans Solution from the Building Plans Area for simple and effective designing of various office plans.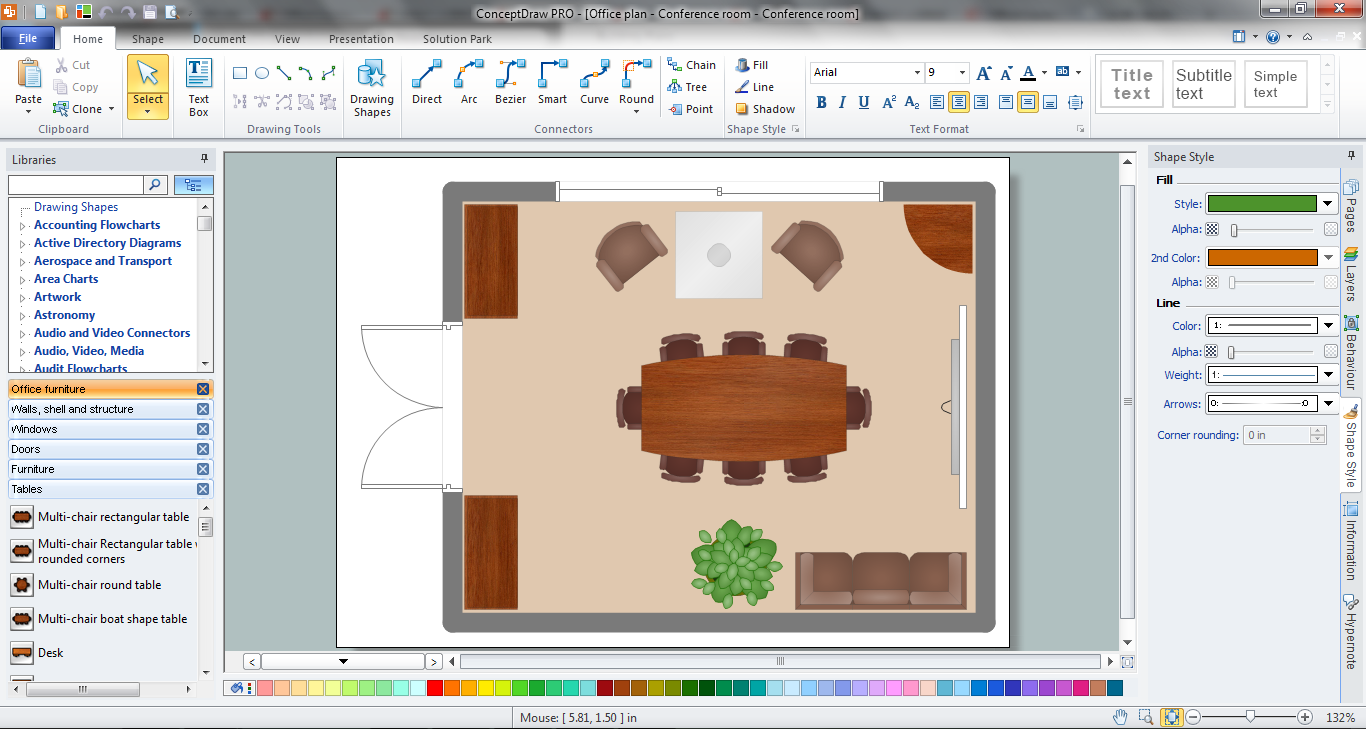
Picture: Office Concepts
Related Solution:
Everyone who starts the construction, repair or remodeling of the home, flat or office, is facing with a need of visualization its ideas for visual explanation how all should to be for the foreman and construction team. It is incredibly convenient to use for this professional home architect software. ConceptDraw DIAGRAM software enhanced with Floor Plans solution provides a lot of built-in drawing tools which allow you quick and easy create design plans for the home of your dreams.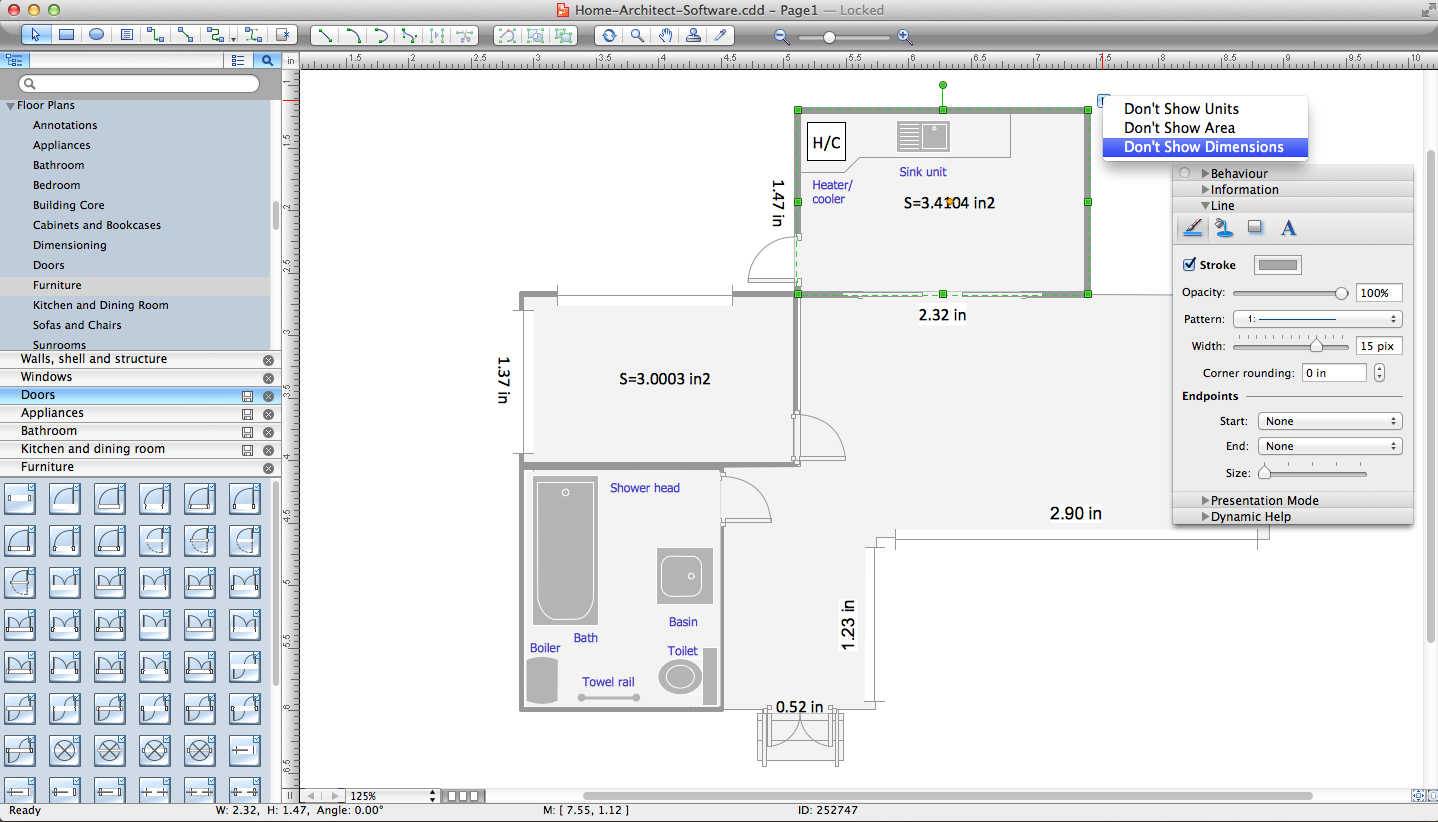
Picture: Home Architect Software. Home Plan Examples
Related Solution:
You need design Cylinder Venn Diagram? Nothing could be easier with ConceptDraw DIAGRAM software.
Picture: Cylinder Venn Diagram
Related Solution:
An event-driven process chain diagram is a flowchart used in business process analysis. It evolved from Architecture of Integrated Information Systems (ARIS) and utilised in the business process improvement and analysis. It is also used to facilitate enterprise resource planning.
An EPC diagram is a complex flowchart that shows different business processes through various workflows. The workflows are seen as functions and events that are connected by different teams or people, as well as tasks that allow business processes to be executed.
ConceptDraw DIAGRAM is a software for making EPC diagrams that allows managers visually present business process models for making decisions for business.
Picture: How to Draw EPC Diagram Quickly
Related Solution:
When we think about programming, we usually imagine sleepless nights spent on writing kilobytes of code. However, from another point of view, Software development with ConceptDraw DIAGRAM makes a programmer's life endlessly easier. This tool is unique to fulfill all your needs in short period of time.
Over the recent years object-oriented methodology has become more and more widespread. Thanks to this methodology developers manage to deal with growing complexity of applications. More and more programs are written in such programming languages as C++, Java, Visual Basic and Object Pascal. However, the complexity of the designed systems imposes extended requirements as to design of graphic documentation. ConceptDraw possesses powerful tools for designing of technical documentation for object-oriented projects. The libraries included in the package allow to easily draw class hierarchies, object hierarchies and diagrams of data flows with the use of the most popular notations, including UML and Booch notations. And the library for projecting COM-interfaces will spare developers of ActiveX-servers a headache.
Picture: Software development with ConceptDraw DIAGRAM
ConceptDraw
DIAGRAM 18