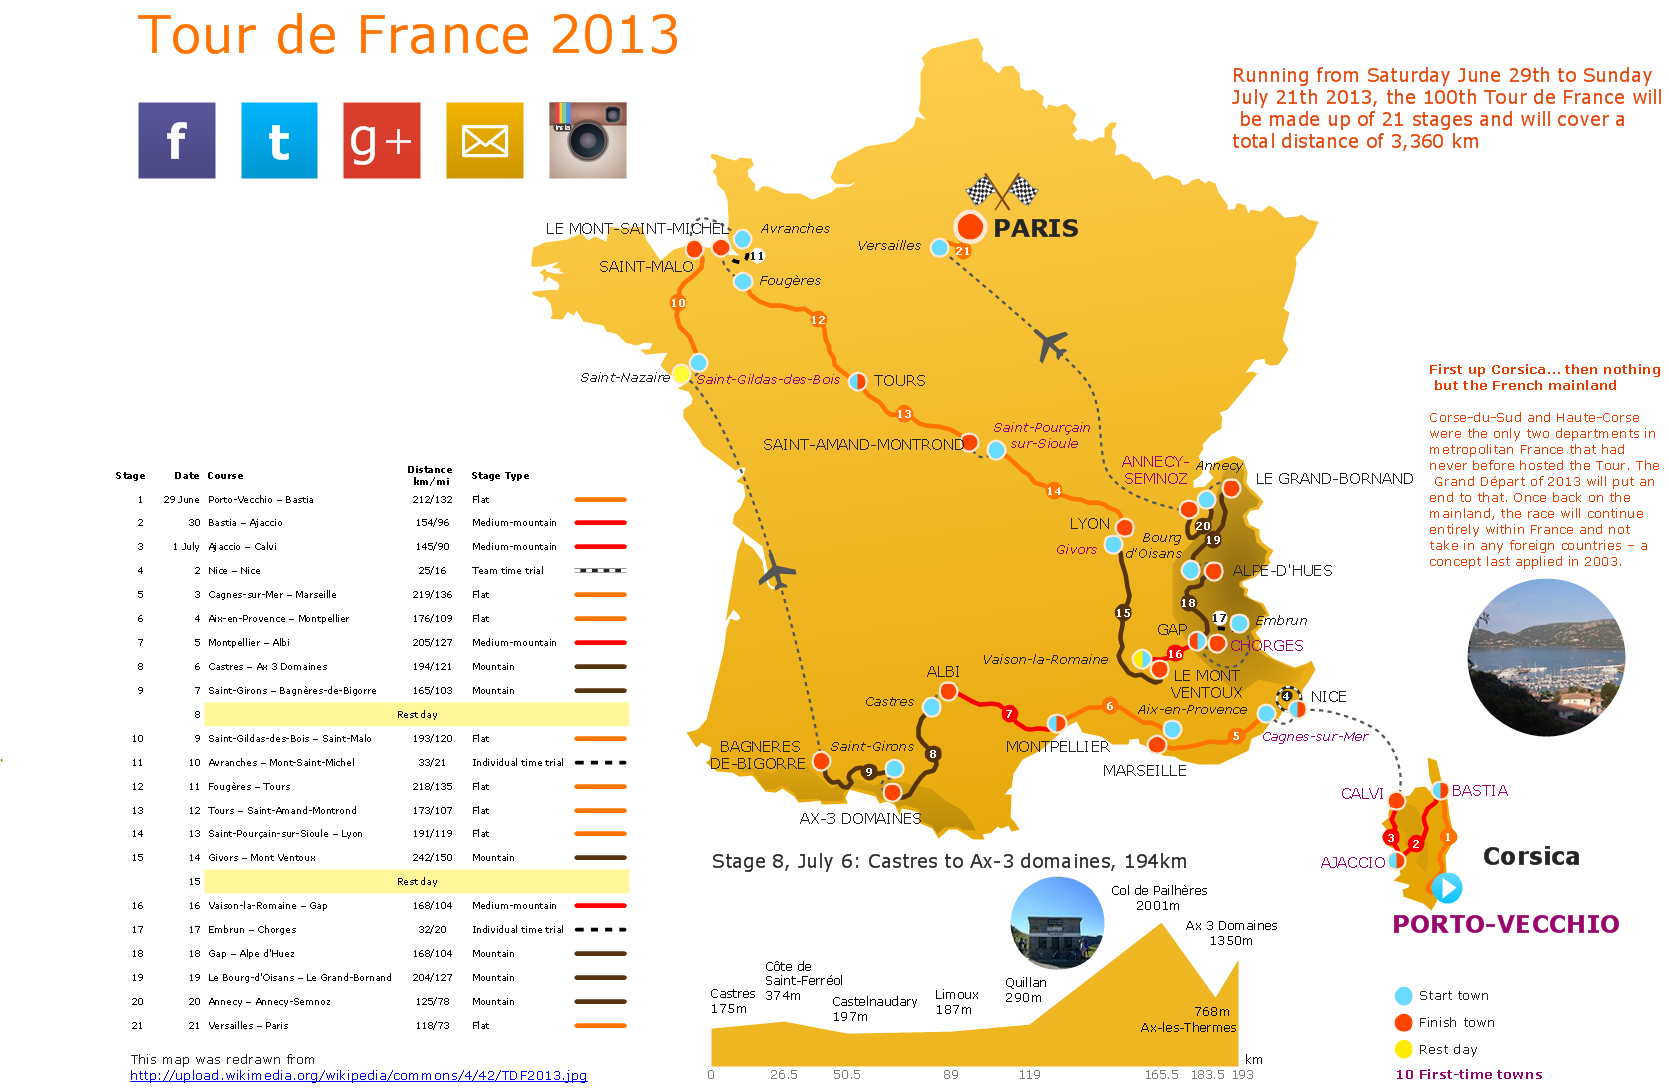
Sample 1. Spatial infographics - The 100th Tour de France 2013.
Solution Spatial Infographics from ConceptDraw Solution Park extends ConceptDraw DIAGRAM ector diagramming and business graphics software with easy-to-use spatial infographics drawing tools.
This solution contains spatial infographics samples, map templates to be filled in, and libraries of vector stencils for main design elements of spatial infographics.
Use this solution to draw your own geospatial infographics documents with thematic maps, road maps, directional maps and transport maps.
NINE RELATED HOW TO's:
You need create Reflective Ceiling Plan? What can be easier with ConceptDraw DIAGRAM diagramming and vector drawing software extended with Reflected Ceiling Plans Solution from the Building Plans Area.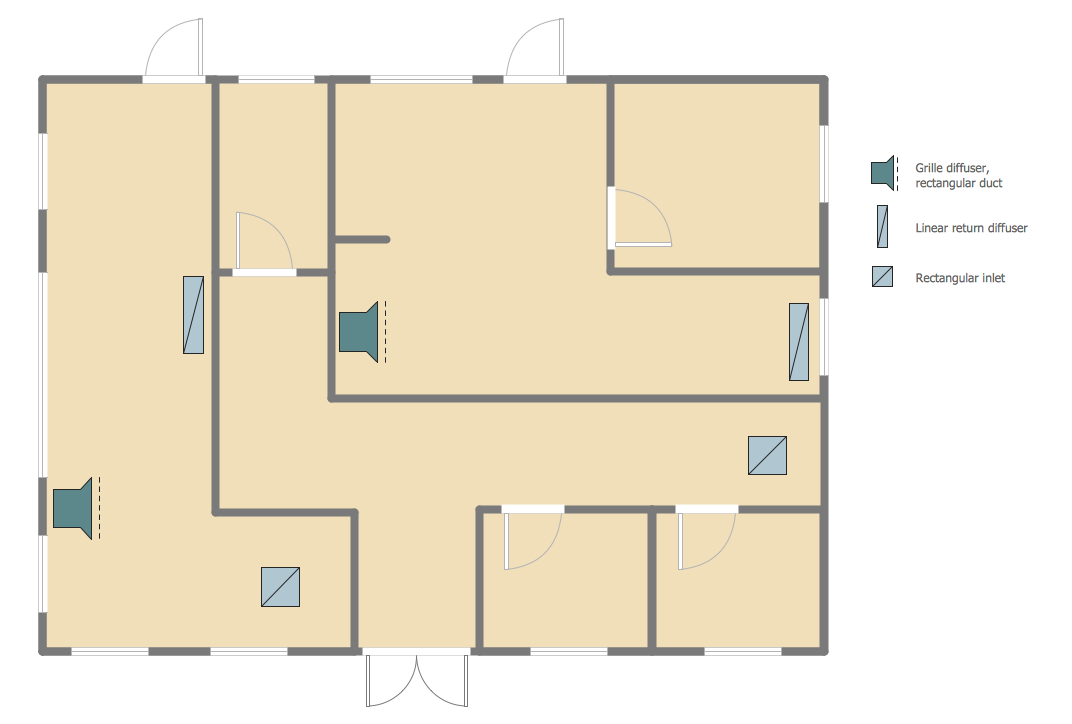
Picture: Reflective Ceiling Plan
Related Solution:
ConceptDraw DIAGRAM extended with Chemistry solution is effective for drawing various organic chemistry schemes, diagrams, illustrations thanks to the included collection of predesigned organic chemistry symbols
Picture: Organic Chemistry Symbols
Related Solution:
Talking about interior design, we usually mean apartments, houses or establishments. But there’s much more to this, for instance, interiors in warehouses, storage and distribution departments and machine shops also require designing. You can find all the necessary design elements such as cranes and forklifts in Plant Layout Plans solution ConceptDraw Solution Park.
This picture represents content of the Storage and Distribution library, providing the collection of vector images designed to plan layouts of industrial storage facilities (warehouses). Warehouse is a premises and equipment intended for the reception, distribution and storage of products manufactured at the plant, as well as to preparation the product for shipment to the consumer. This vector images library is supplied with ConceptDraw Plant Layout Plans solution. it will help to industrial architects and planners to design plans for industrial storage and shipping facilities.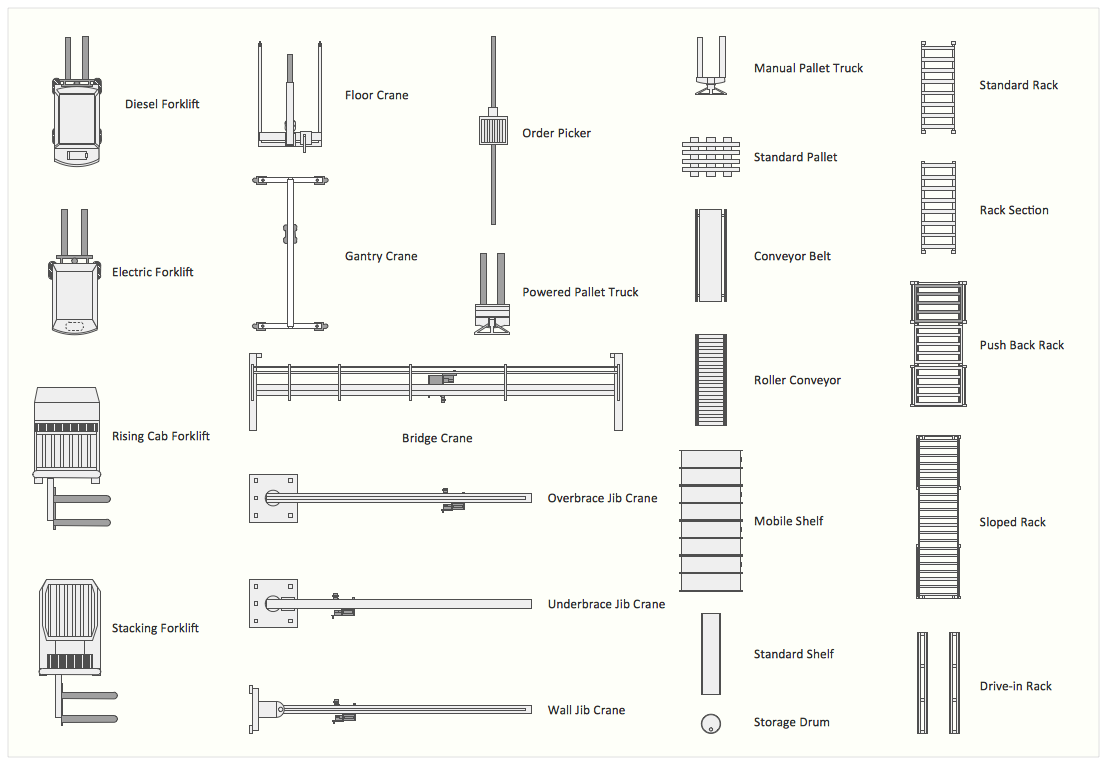
Picture: Interior Design. Storage and Distribution — Design Elements
Related Solution:
Analysis is very important part for every business, as it helps to understand the weakness and to see the opportunities, and SWOT is one of the most effective tools. To illustrate the multifunctionality of this tool, let’s imagine a SWOT sample in area of computers networking, which can be carried out to realize the pros and cons of some equipment, for example. Even a network topology or a administer can be a subject for this analysis.
This SWOT analysis matrix illustrate the sample of using this useful technique for comprehension of Strengths and Weaknesses, and for determining the Opportunities open to business and the Threats it encounters. Used in a business scope, it will help to create a perspective niche in the market for particular business. The ConceptDraw SWOT and TOWS Analysis solution gives a lot of templates of both SWOT and TOWS matrices that allow managers and marketers create custom diagrams to perform SWOT or TOWS analysis in context of a particular business.
Picture: SWOT Sample in Computers
Users can start drawing their own flowchart diagrams in fast and simple way with ConceptDraw software.
ConceptDraw DIAGRAM is the only professional diagramming software that works on both Windows and Macintosh platforms. All its documents and libraries are 100% compatible and can be exchanged hassle-free between the platforms.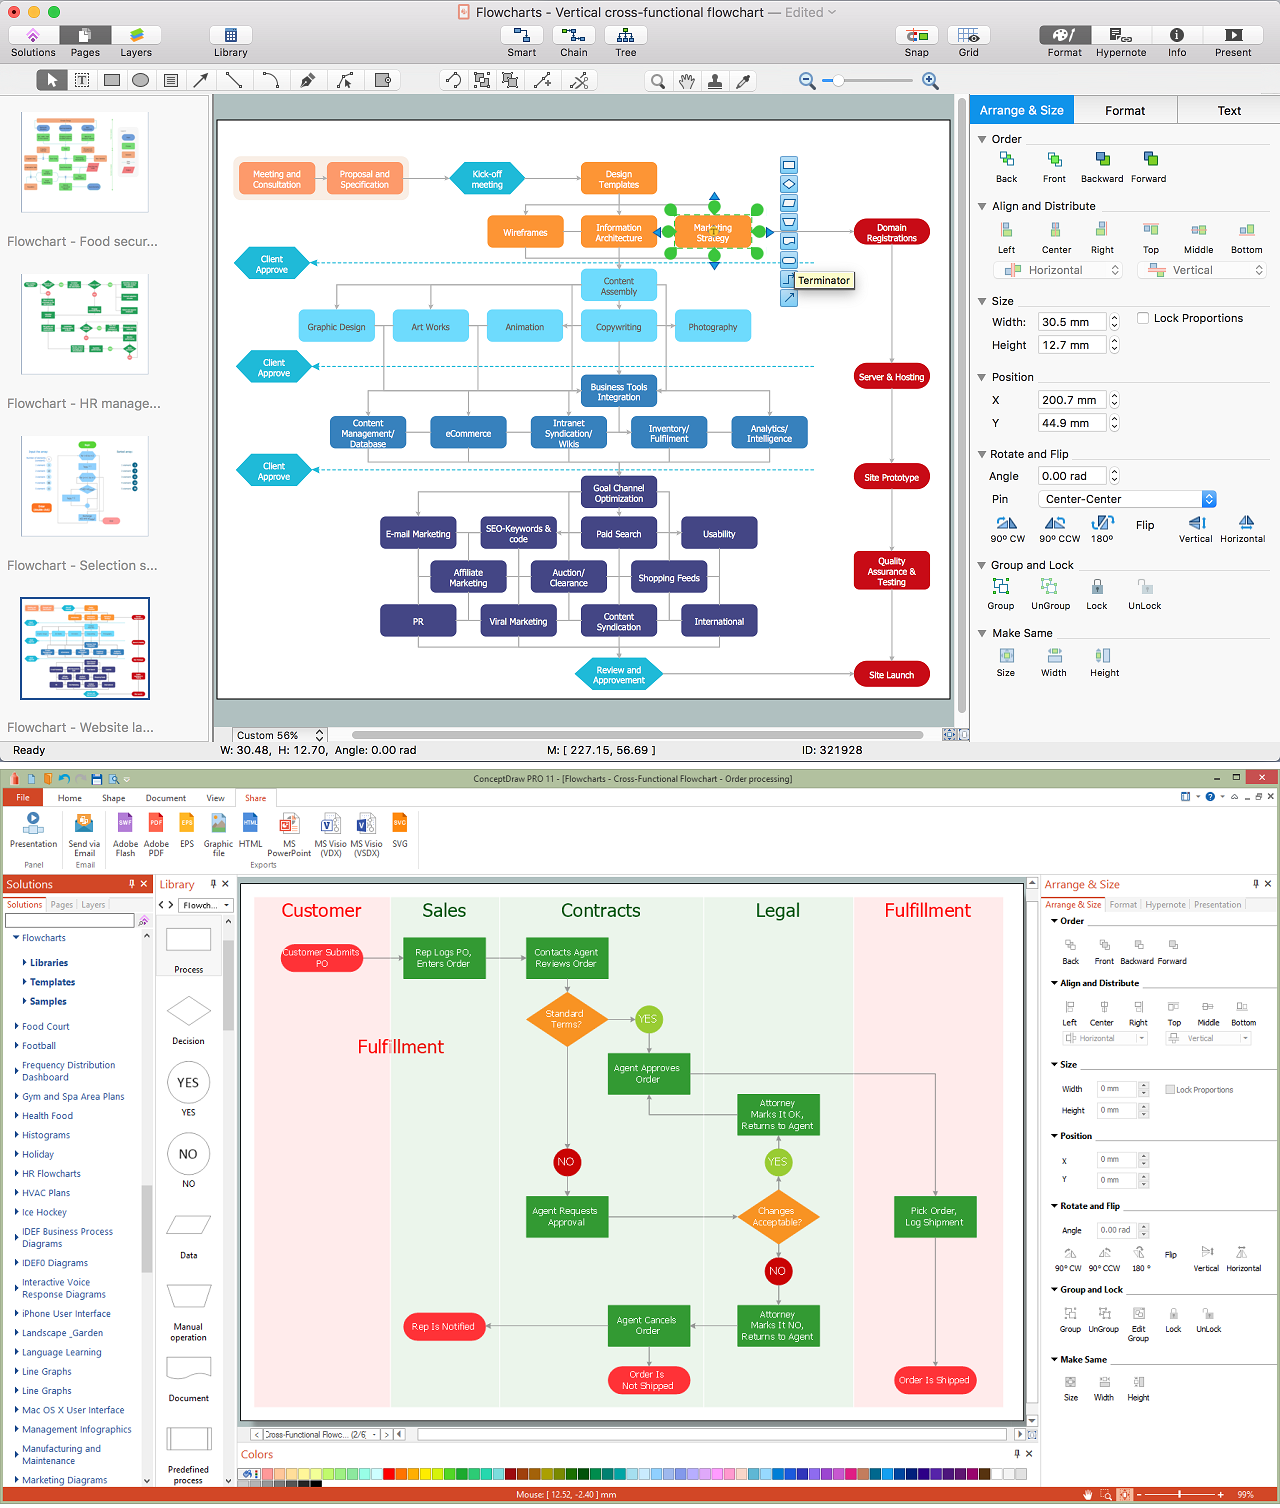
Picture: Create a Flow Chart
Related Solution:
Data modelling will help you to study and analyze business processes in your organization for optimization and increase of effectiveness and production.
Picture: Data modeling with ConceptDraw DIAGRAM
Arkansas is a state located in the Southern region of the United States.
The vector stencils library Arkansas contains contours for ConceptDraw DIAGRAM diagramming and vector drawing software. This library is contained in the Continent Maps solution from Maps area of ConceptDraw Solution Park.
Picture: Geo Map - USA - Arkansas
Related Solution:
Infographic Design Elements for visually present various geographically distributed information.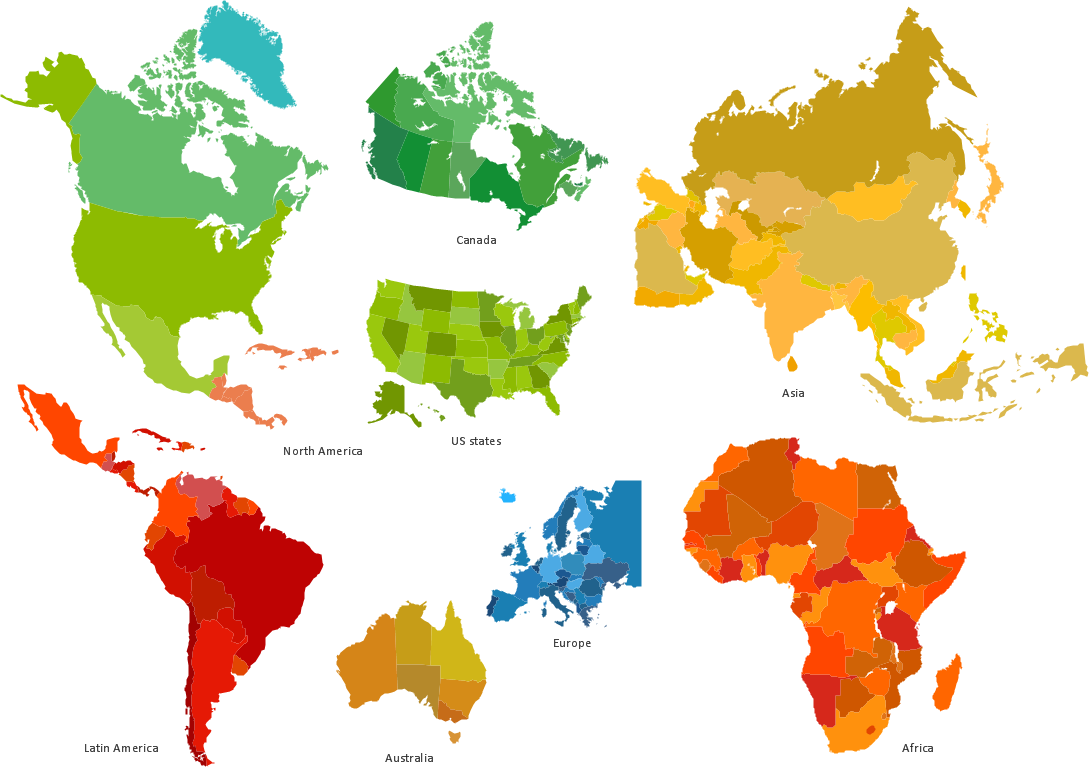
Picture: Spatial infographics Design Elements: Location Map
The vector stencils library Denmark contains contours for ConceptDraw DIAGRAM diagramming and vector drawing software. This library is contained in the Continent Maps solution from Maps area of ConceptDraw Solution Park.
Picture: Geo Map - Europe - Denmark
Related Solution: