Geo Mapping Software Examples - World Map Outline
This example shows the outline of the World Map. It was created in ConceptDraw DIAGRAM diagramming and vector drawing software using the Continent Maps Solution from the Maps area of ConceptDraw Solution Park.
It’s very simple, quick and convenient to draw visual and clear Geo maps in ConceptDraw DIAGRAM
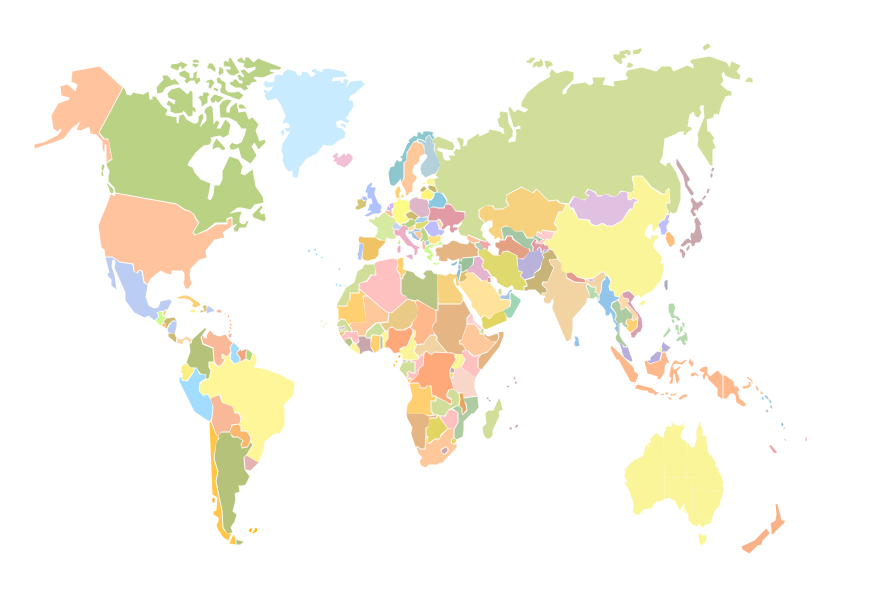
Use the ready-to-use predesigned objects, templates and samples from the Continent Maps Solution for ConceptDraw DIAGRAM to create your own professional looking Geo Maps quick and easy.
The Geo Maps produced with ConceptDraw DIAGRAM are vector graphic documents and are available for reviewing, modifying, and converting to a variety of formats (image, HTML, PDF file, MS PowerPoint Presentation, Adobe Flash or MS Visio).
See Also:
TEN RELATED HOW TO's:
Software for flowchart diagrams can help you: represents an algorithm or process, illustrates a solution to a given problem, represented process operations, analyzing a business process, designing a business process, documenting a business process, optimizing a business process.
The Flowcharts Solution from the Diagrams area of ConceptDraw Solution Park contains a wide set of predesigned templates, samples and 3 libraries.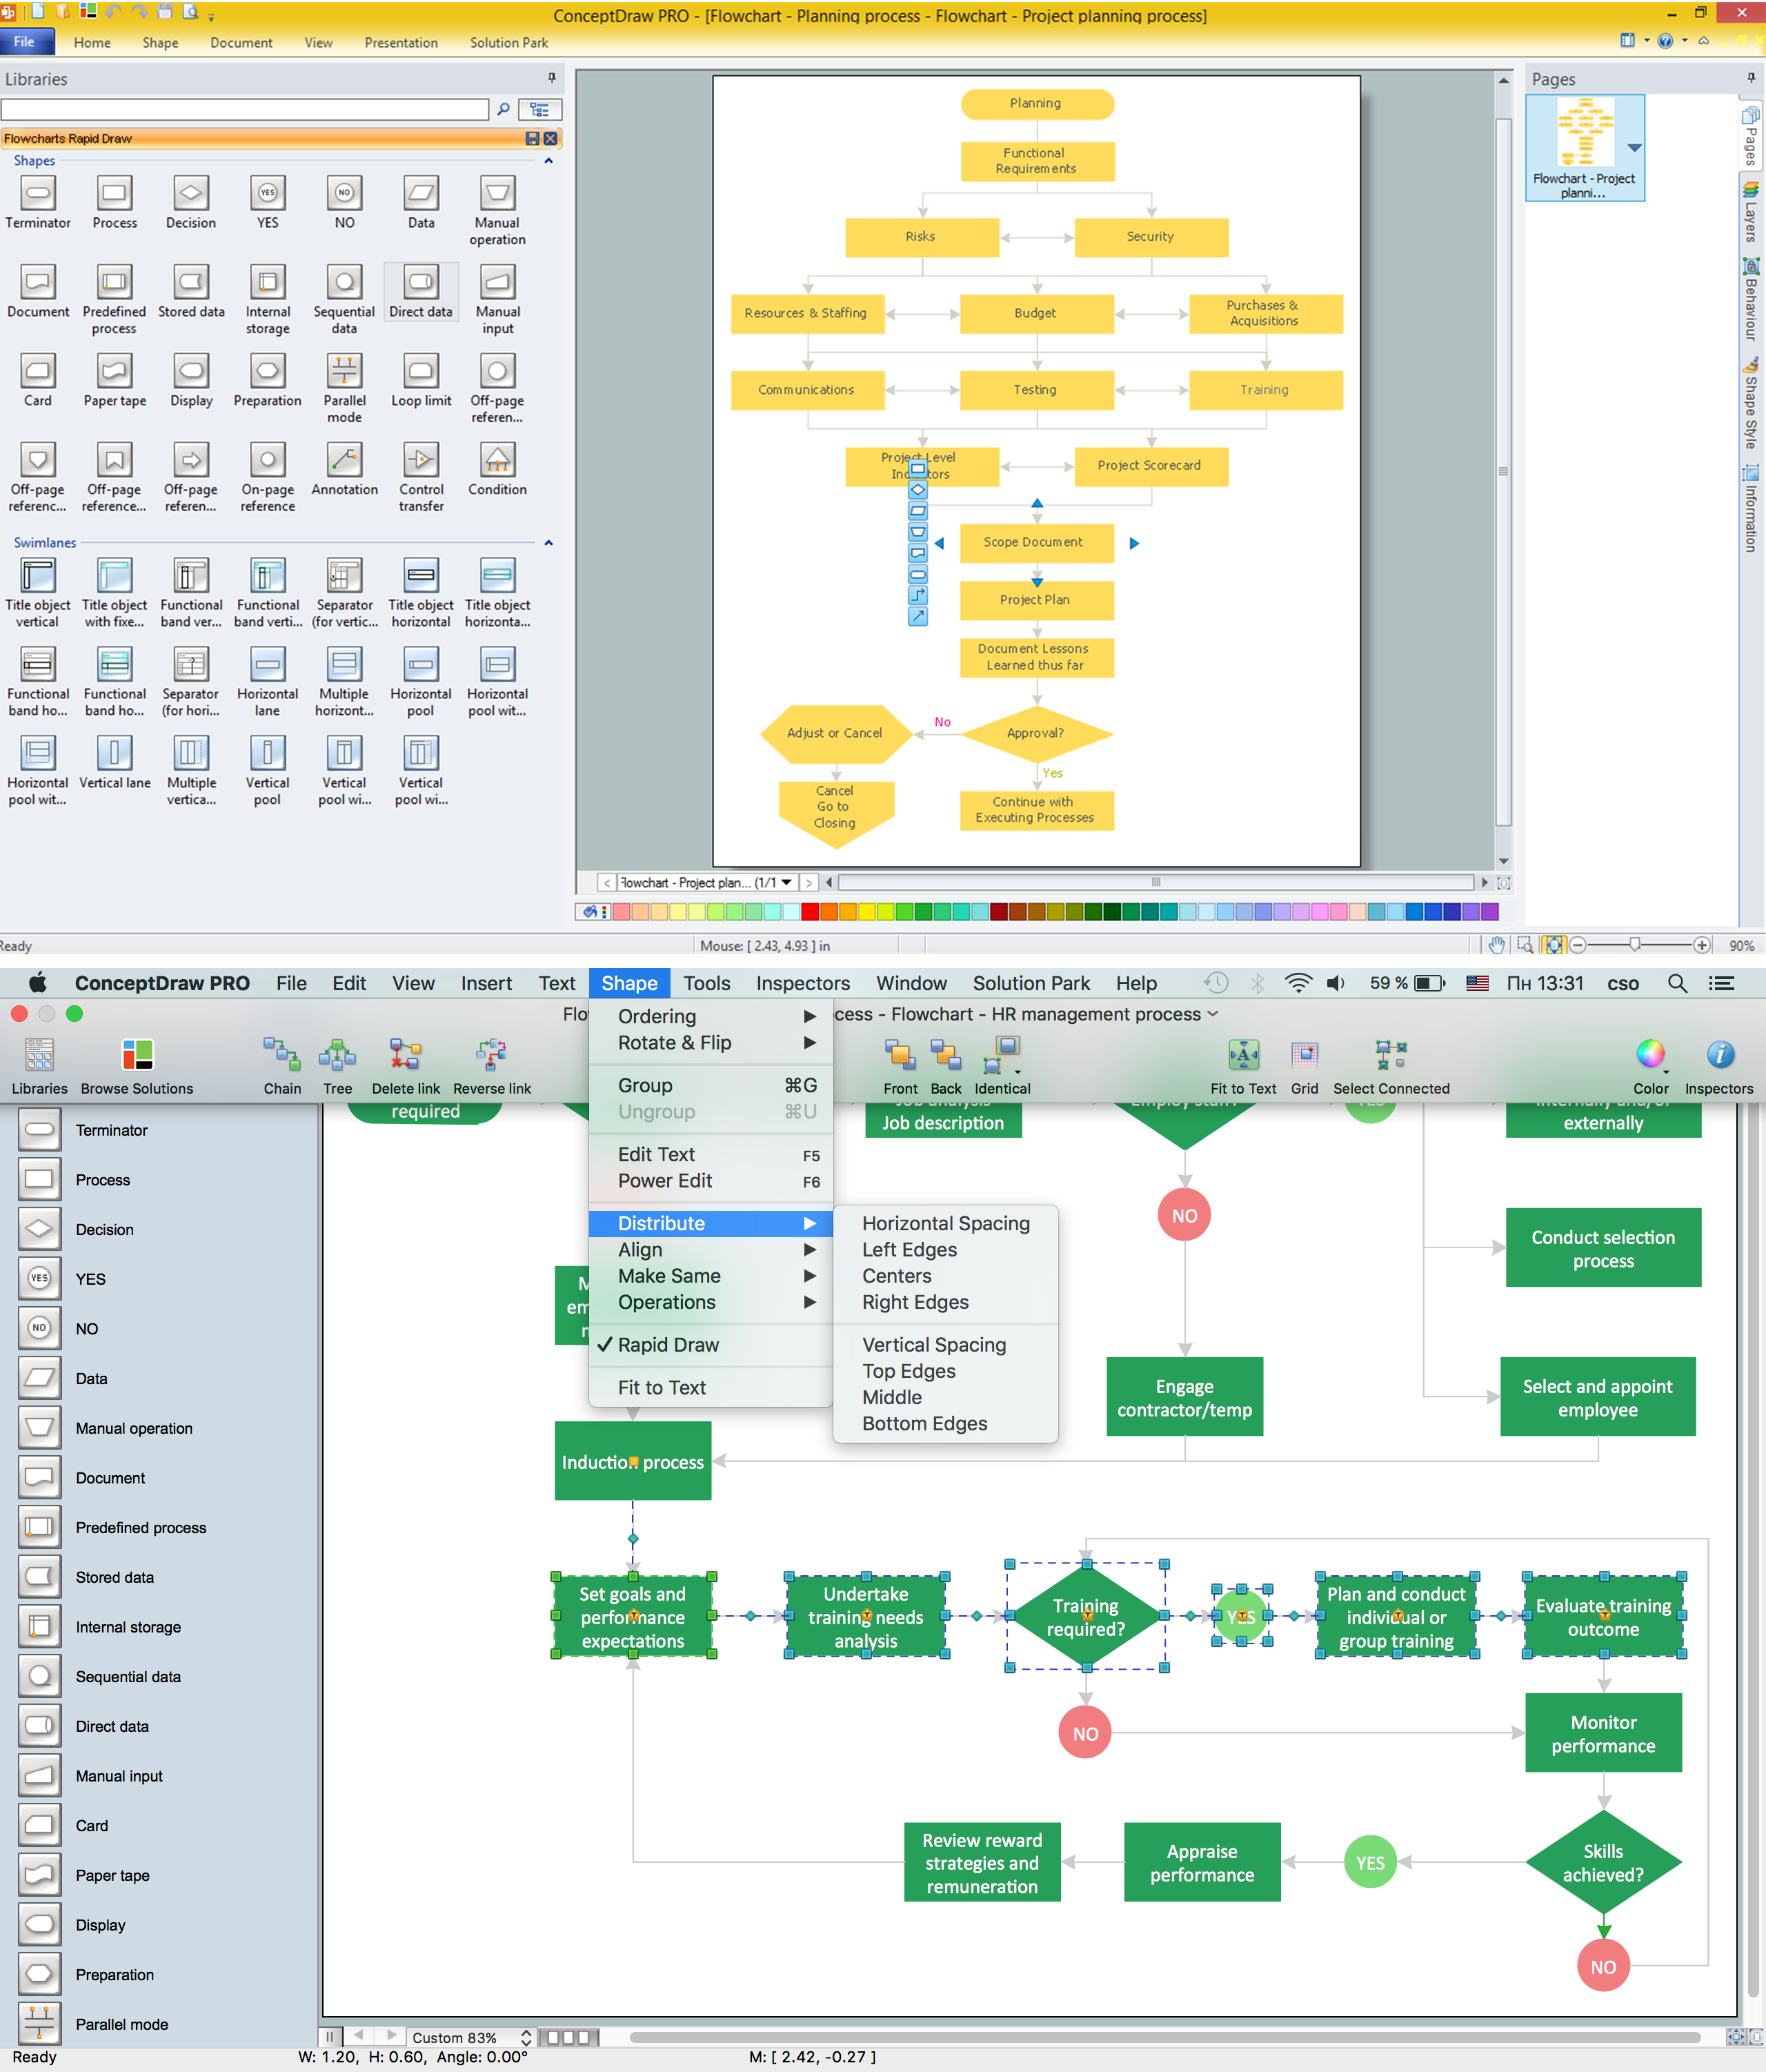
Picture: Software for flowchart diagrams
Related Solution:
Any factory needs a clear scheme of all the equipment used in the manufacture processes. So, if you want to place all your machines and equipment on one diagram, you need a good diagramming tool for that. For instance, you can find all the design elements you might need, such as lathes, milling machines or saws on ConceptDraw DIAGRAM Solution Park in Plant Layout Plans solution in appropriate libraries.
This drawing represents the Machines and Equipment library delivered by ConceptDraw Plant Layout Plans solution. This vector library is supplied along with other libraries related to industrial architecture planning and interior design.
Just planning the proper facilities in a proper right place, allows to manufacture a product in the most effective and economic way. Objects containing in these libraries will be helpful for architects and engineers dealing with industrial buildings design. They are intended to use for designing layouts of plants, warehouses, manufacturing workshop etc.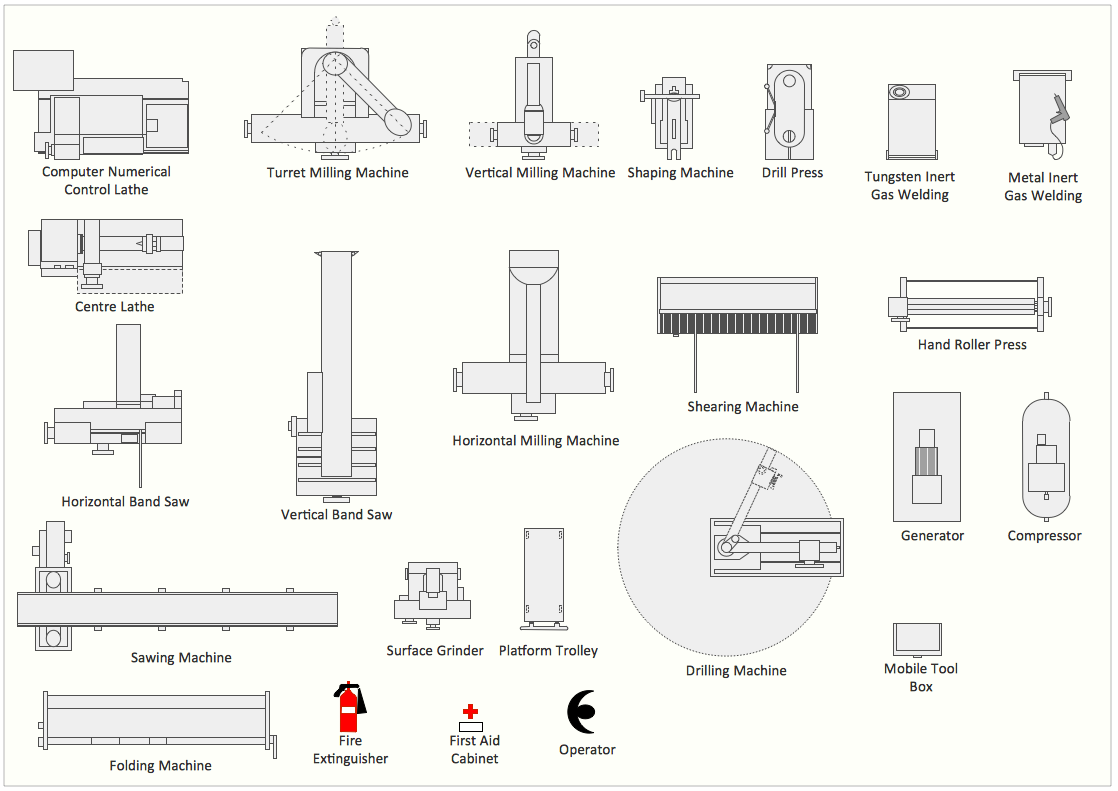
Picture: Interior Design. Machines and Equipment — Design Elements
Related Solution:
Process mapping helps with sharing business results and reorganizing workflow. In almost every case, after creating a sales process flowchart the steps that are redundant become obvious for a manager. It's easy to find a flowchart examples that will help in developing one for your business.
This sales process flowchart consists of a sequence of steps that represent a simple sale process. Each step is shown graphically by a rectangle representing processing steps or an activity, or a diamond representing a decision. These rectangles are linked by arrows, that indicate the direction of the sales workflow. ConceptDraw Sales Flowcharts solution delivers a the full set of classical flowchart notation symbols, along with sales-related icons and pictograms.
Picture:
Sales Process Flowchart
Flowchart ExamplesRelated Solutions:
Accounting Data Flow from the Accounting Flowcharts Solution visually describes the financial accounting process, shows the accumulated information about transactions and events for creating the balance sheet and the final income statement.
Accounting Flowcharts Solution contains also a wide variety of templates and samples that you can use as the base for your own Accounting Flowcharts of any complexity.
Picture: Accounting Data Flow from the Accounting Flowcharts Solution
Related Solution:
A flowchart is a simple but very functional tool when it comes to understanding a workflow or to removing unnecessary stages from a process. When drawing flowcharts, keep in mind that there are four common types of flowcharts, like document flowcharts and data flowcharts that show control over a data or document flow over a system. To show controls on a physical level, use system flowcharts. In addition, to show controls in a program, you can draw a program flowchart.
This flowchart diagram represents the piece of an article editing process, that involves the author and editor. It was created using the Basic Flowchart notation that consists from the basic flowchart symbols. The start and the end of the process are indicated with "Terminator" symbols. The "Process" symbols show the action steps consisting from making edits and searching for a compromise, when the author does not agree with the suggestions of the editor. The "Process" symbol is the general symbol in process flowcharts. The "Decision" symbol indicates a branching in the process flow. There are two branches indicated by a Decision shape in the current flowchart (Yes/No, Disagree/Agree). This basic flowchart can be used as a repeating unit in the workflow diagram describing the working process of some editorial office.
Picture: Types of Flowcharts
Related Solution:
Do you need to draw a check order process flowchart?
Use the intuitive product - ConceptDraw.
Picture: Check Order Process Flowchart. Flowchart Examples
Related Solution:
UML Use Case Diagram Taxi Service - This sample was created in ConceptDraw DIAGRAM diagramming and vector drawing software using the UML Use Case Diagram library of the Rapid UML Solution from the Software Development area of ConceptDraw Solution Park.
This sample shows the work of the taxi service and is used by taxi stations, by airports, in the tourism field and delivery service.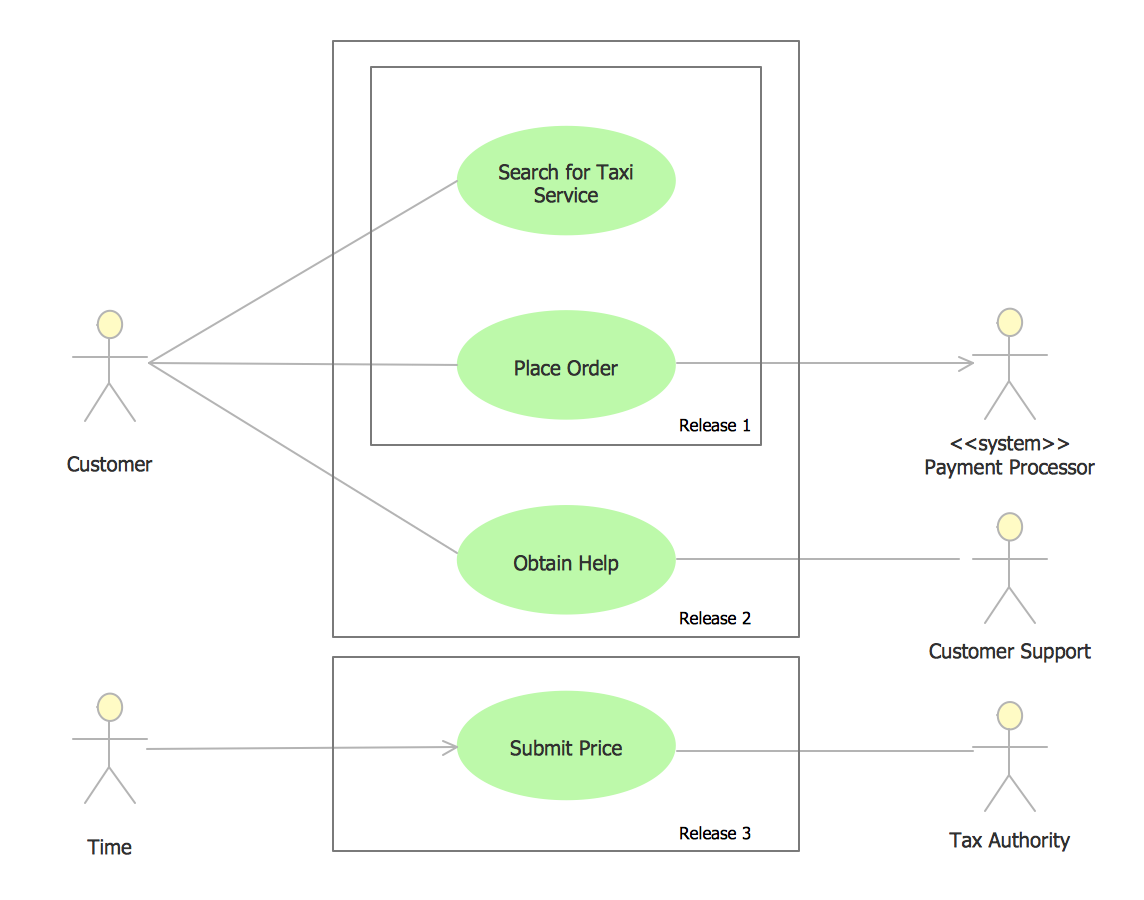
Picture: UML Use Case Diagram Example - Taxi Service
Related Solution:
Vector map is the best way to visually present a world, continents, islands, to display location and boundaries of countries and cities. ConceptDraw DIAGRAM diagramming and vector drawing software offers the Germany Map Solution from the Maps Area of ConceptDraw Solution Park - the best tool for fast and easy drawing vector map of Germany of any degree of detailing, and thematic cartograms and maps of Germany on its base.
Picture: Vector Map of Germany
Related Solution:
ConceptDraw DIAGRAM diagramming and vector drawing software extended with Target and Circular Diagrams solution from the Marketing area of ConceptDraw Solution Park is a powerful tool for Daily Schedule Chart design.
Picture: Daily Schedule Chart
Related Solution:
One of the stages of the problem's solving process scenario is Corrective Action Planning.
Corrective action planning define people and groups involvement in corrective actions by roles, identify logical sequences of scheduled actions and critical path of problem solving, identify possible risks of action plan and propose preventive actions.
Picture: Corrective Action Planning
ConceptDraw
DIAGRAM 18