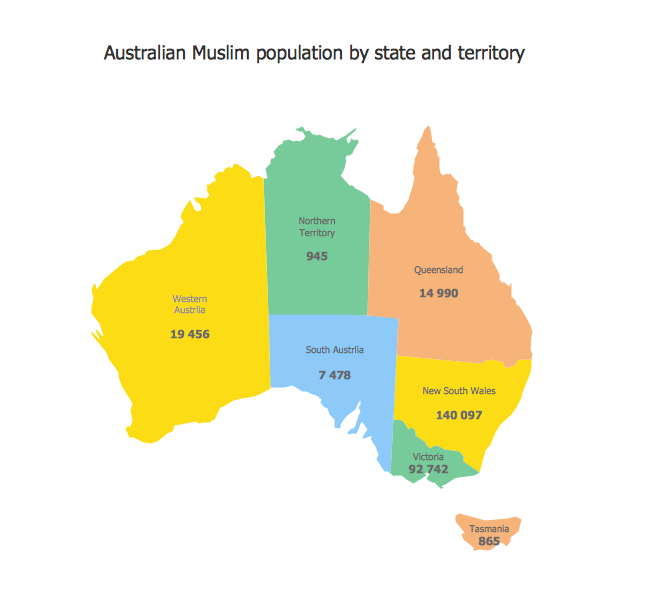
Sample 1. Australian muslim population by state and territory
This example was created using the Continent Maps Solution from the Maps area of ConceptDraw Solution Park and shows the distribution of the Muslim population by state and territory in Australia.
All maps produced with ConceptDraw DIAGRAM are vector graphic documents and are available for reviewing, modifying, and converting to a variety of formats (image, HTML, PDF file, MS PowerPoint Presentation, Adobe Flash or MS Visio).
See Also:
TEN RELATED HOW TO's:
Minnesota is a U.S. state in the Midwestern United States.
The vector stencils library Minnesota contains contours for ConceptDraw DIAGRAM diagramming and vector drawing software. This library is contained in the Continent Maps solution from Maps area of ConceptDraw Solution Park.
Picture: Geo Map — USA — Minnesota
Related Solution:
Yemen, officially known as the Yemeni Republic, is an Arab country located in Western Asia, occupying the southwestern to southern end of the Arabian Peninsula.
The vector stencils library Yemen contains contours for ConceptDraw DIAGRAM diagramming and vector drawing software. This library is contained in the Continent Maps solution from Maps area of ConceptDraw Solution Park.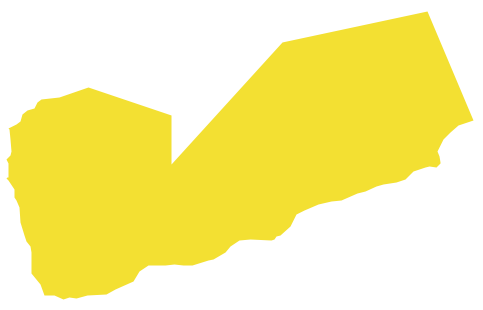
Picture: Geo Map - Asia - Yemen
Related Solution:
Start design your own flowchart with ConceptDraw DIAGRAM and accomplish great results at the moment.
Picture: Draw Flowcharts with ConceptDraw
Related Solution:
How to design USA map fast and easy? It is convenient to use special software. ConceptDraw DIAGRAM diagramming and vector drawing software includes the USA Maps Solution which was specially developed to make easier drawing process of USA Maps, Map of USA States, various USA thematic maps and cartograms.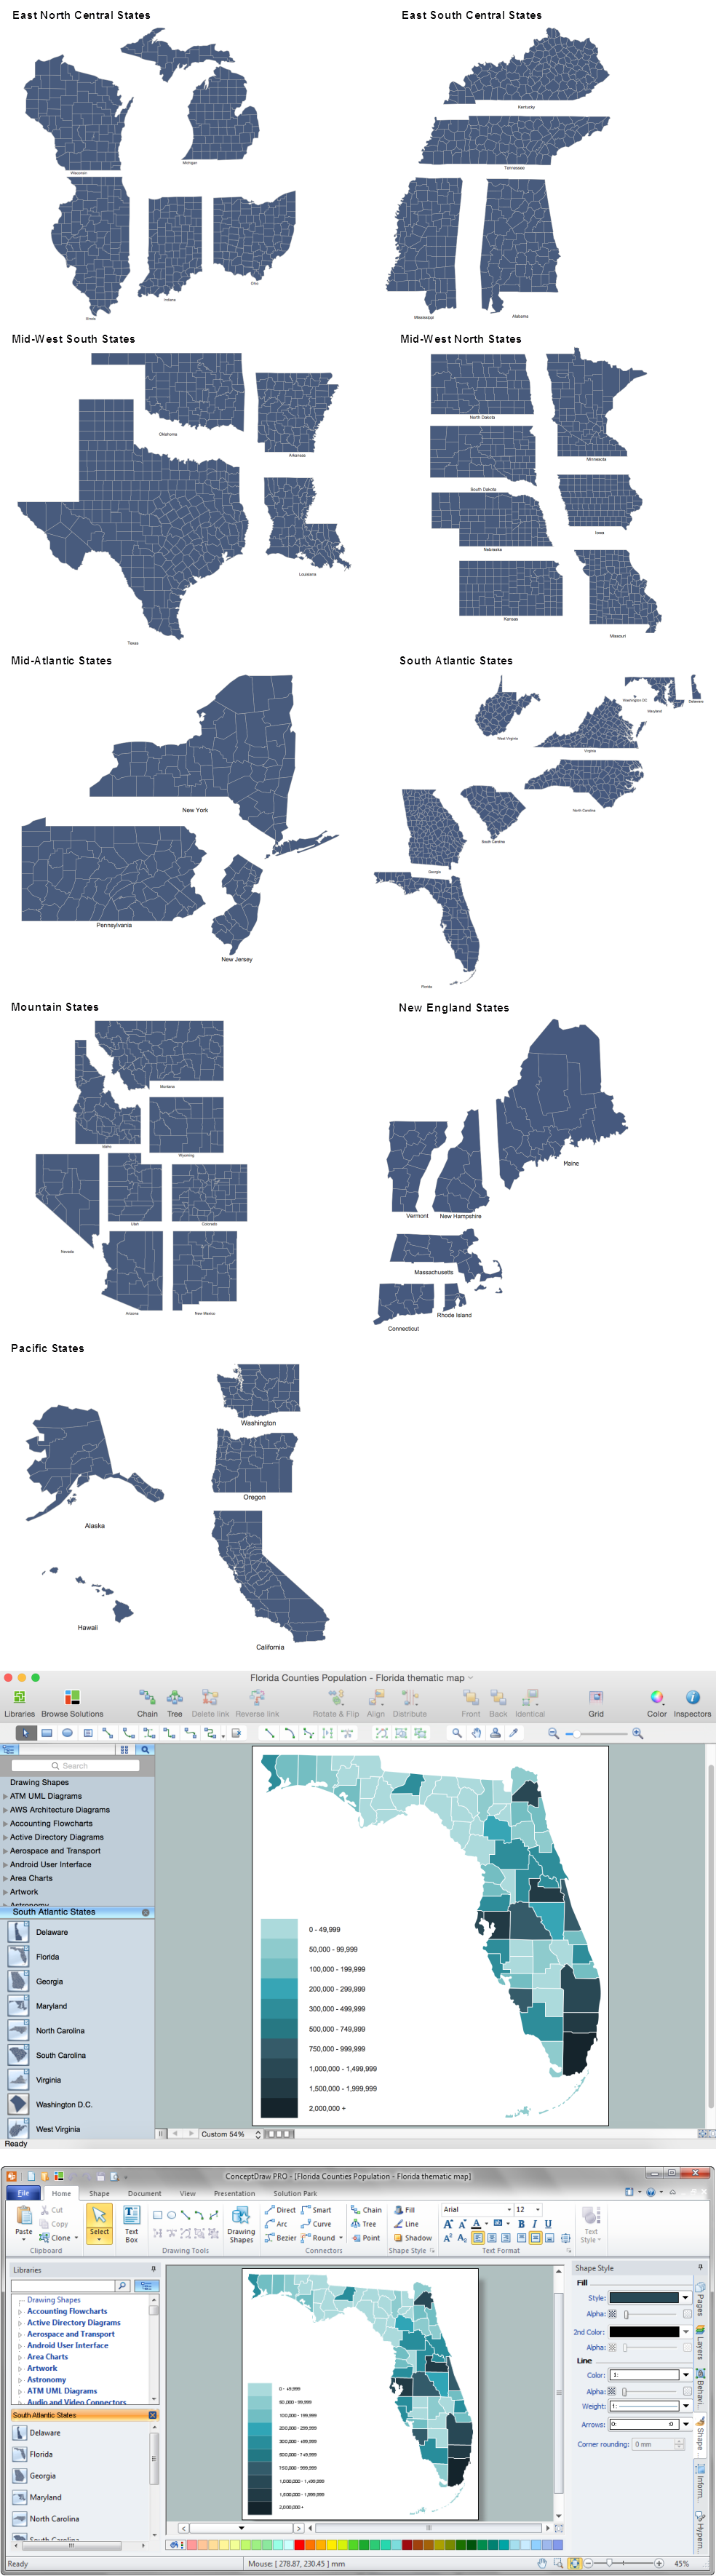
Picture: Map of USA States
Related Solution:
ConceptDraw DIAGRAM extended with Fire and Emergency Plans solution from the Building Plans area of ConceptDraw Solution Park lets you make a Fire Exit Plan of any complexity in minutes.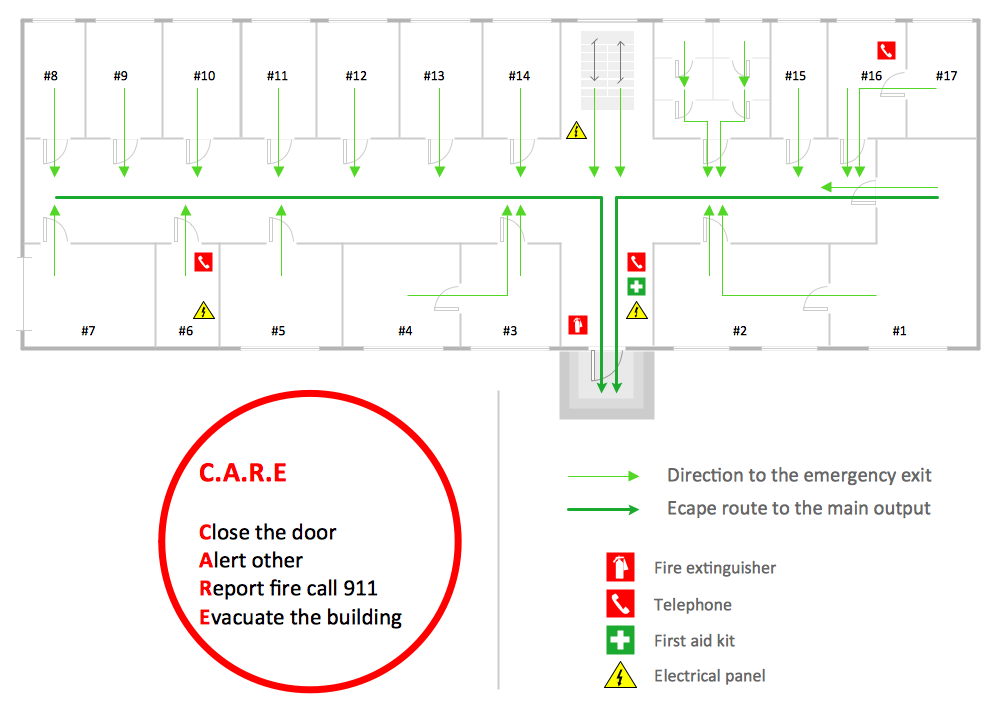
Picture: Fire Exit Plan
Related Solution:
ConceptDraw Infographics is a great visual tool for communicating the large amounts of data and graphic visualization and representations of data and information.
Picture: How tо Represent Information Graphically
Singapore, officially the Republic of Singapore, is a sovereign city-state and island country in Southeast Asia.
The vector stencils library Singapore contains contours for ConceptDraw DIAGRAM diagramming and vector drawing software. This library is contained in the Continent Maps solution from Maps area of ConceptDraw Solution Park.
Picture: Geo Map - Asia - Singapore
Related Solution:
Nature solution expands ConceptDraw DIAGRAM software with samples, templates and libraries of vector clip art for drawing of Nature illustrations.
Use Geography library of vector stencils to draw natural landscapes.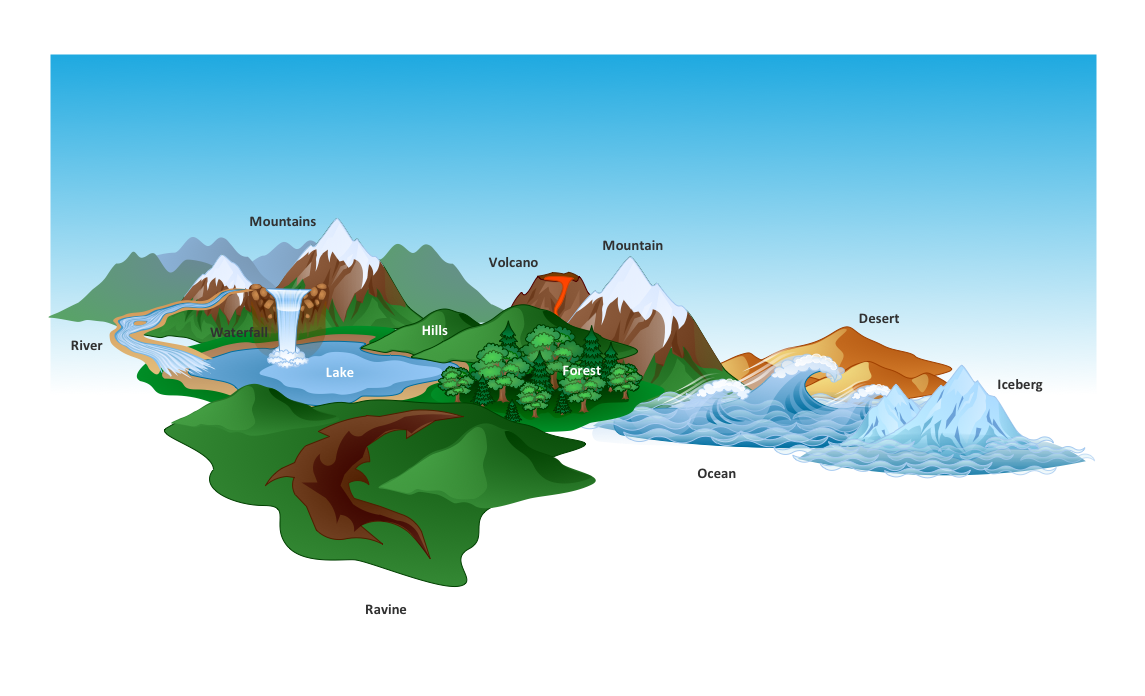
Picture: How to Draw a Natural Landscape
Create Spatial infographics with ConceptDraw using its excellent examples of infographic maps. We hope these can inspire and teach you!
Picture: Excellent Examples of Infographic Maps
Now it’s easy to share your visual documents with other people in a form most convenient for them.
ConceptDraw DIAGRAM can save your drawings and diagrams in a number of highly useful formats, including graphic files. You can save your drawing as a.PNG,.JPG, or other graphic format file.
Picture: Export from ConceptDraw DIAGRAM Document to a Graphic File