Map Infographic Tool
Infographics
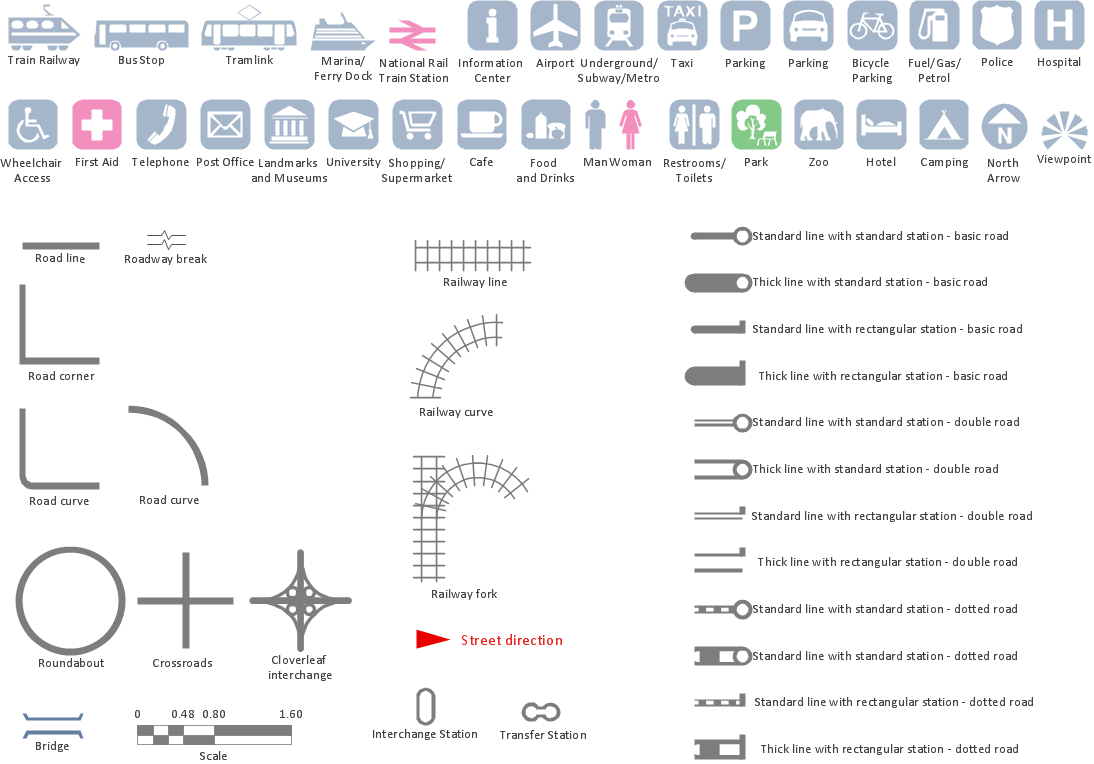
ConceptDraw DIAGRAM is a map infographic tool with more than 10 library objects that scalable vector images. The Spatial Infographics solution contains spatial infographics samples, map templates to be filled in, and libraries of vector stencils for main design elements of spatial infographics.
The addition of this new solution permits users to quickly and easily draw professional infographics that quickly orient viewers so they can be self-directed to a point of interest.
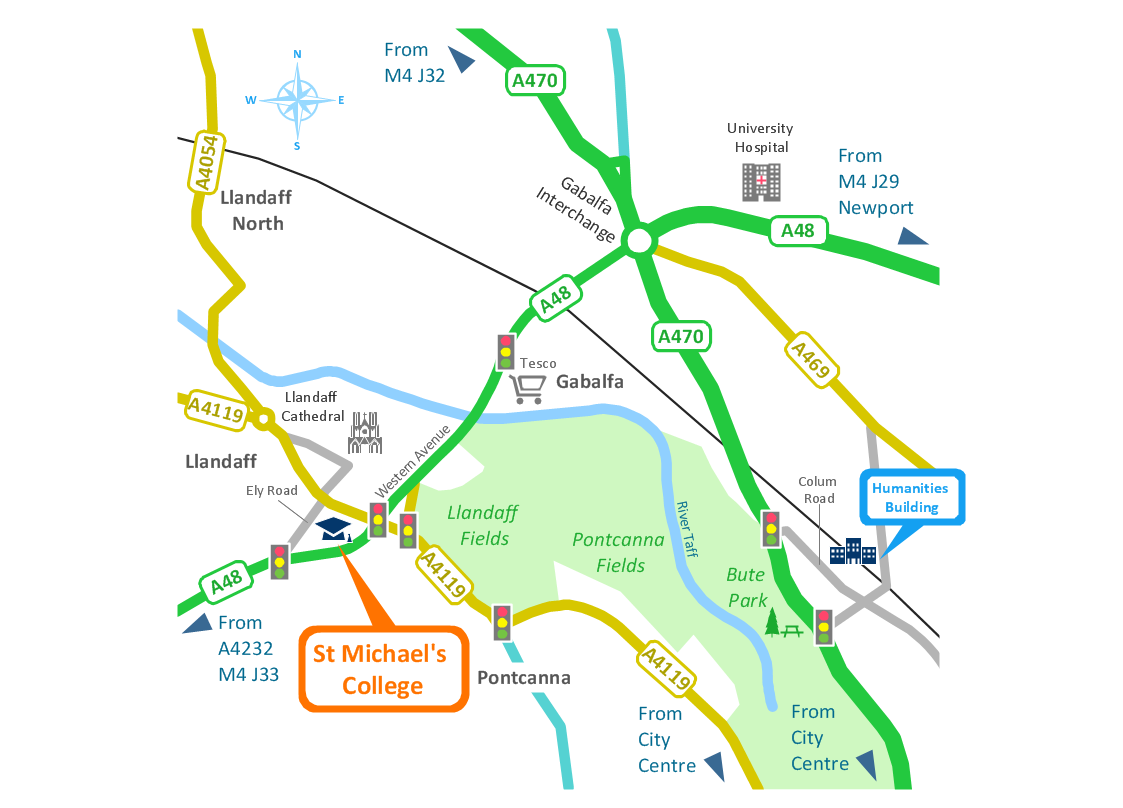
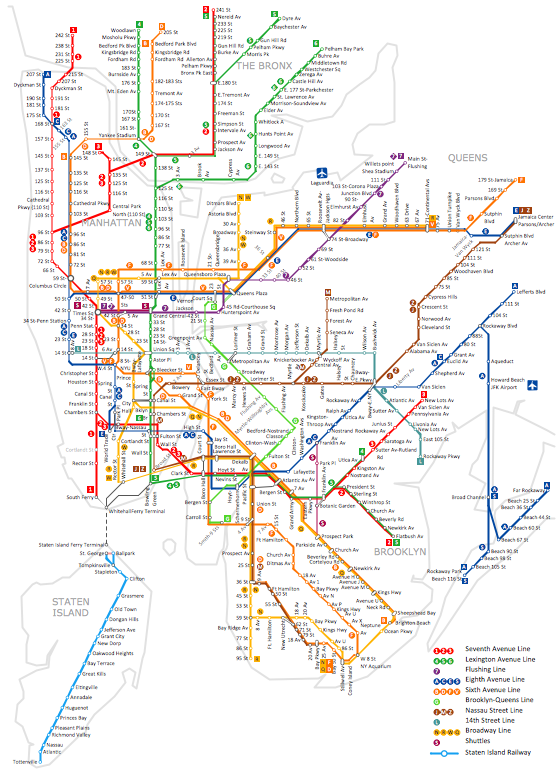
Sample 1. Conference centre location map - Spatial infographics.
Solution Spatial Infographics from ConceptDraw Solution Park extends ConceptDraw DIAGRAM ector diagramming and business graphics software with easy-to-use spatial infographics drawing tools.
This solution contains spatial infographics samples, map templates to be filled in, and libraries of vector stencils for main design elements of spatial infographics.
Use this solution to draw your own geospatial infographics documents with thematic maps, road maps, directional maps and transport maps.
SEVEN RELATED HOW TO's:
Business Processes description with ConceptDraw. Business-processes it allows to describe functional blocks, for example production and marketing. ConceptDraw lets creation of business processes description using IDEF0 and IDEF2 methods.
Picture: Business Processes description with ConceptDraw DIAGRAM
Related Solution:
Nowdays business people’s figures are most favourite vector illustrations among presenters and designers. It is easy to make them and use, but they can make your graphics look really good looking & eye catching.
Just check ConceptDraw business perople figusers pictures, you will see all kinds of silhouetes: Staff, Employed workers, Persons and Groups symbols.
Best popular vector pictures are: men, dancing people, business man.
Use human contours wise and it will help you to tell main idea of your design message.
Picture: Business People Figures
Related Solution:
Presentation tools. A convenient tool to present documents via Skype. Share your desktop, collaborate on documents in real-time and run a web conference one-on-one or one-to-many.
A tool for sharing and presenting business documents via Skype. Allows to present Microsoft® Word®, Microsoft PowerPoint®, Microsoft Project® and plenty mindmapping formats.
Picture: Presenting Documents with Skype
Related Solution:
Sample Pictorial Chart - Pictorial Infographics solution provides easy-to-use design infographics drawing tools, large collection of different sample infographics and infograms, sample pictorial chart and templates to be filled in, and 10 libraries with great quantity of predesigned vector pictograms.
Use Pictorial Infographics solution to draw your own design pictorial infographics documents quick and easy.
Picture: Sample Pictorial Chart. Sample Infographics
Related Solution:
ConceptDraw is a data visualization tool, which can help you to create a map infographics. Anyone can do this, it's that easy!
Picture: Map Infographic Tool
Informative and well-designed Infographics allows visually present various map containing information.
Picture: Informative and Well-Designed Infographics
Working with information can be quite tedious, furthermore, some data can be quite difficult to perceive without any graphic representation. So, to facilitate your work, you can use business diagrams, such as simple flowcharts or Gantt charts for project management and orgcharts for clarifying your company structure. You can use a proper software, like ConceptDraw Pro, draw them on paper, or use whiteboards, but it is more convenient to use a digital tool.
This diagram shows a cross-functional flowchart that was made fore telecom service provider. A workflow of a common telecommunication service provider has a rather branched structure. Thus, it is useful to have a flow chart to visualize the sequences and interrelations of the work flow steps. Business process flowchart contains 17 processes and 4 decision points,that are distributed through 2 lines depicting the participants involved. Also there are connectors that show the data flow within processes. This flowchart displays a detailed model of the telecom service trading process, as well as all participants in the process and how they interact with each other.
Picture: Business diagrams & Org Charts with ConceptDraw DIAGRAM