
Sample 1. Design elements - Continent and country maps.
Solution Spatial Infographics from ConceptDraw Solution Park extends ConceptDraw DIAGRAM ector diagramming and business graphics software with easy-to-use spatial infographics drawing tools.
This solution contains spatial infographics samples, map templates to be filled in, and libraries of vector stencils for main design elements of spatial infographics.
Use this solution to draw your own geospatial infographics documents with thematic maps, road maps, directional maps and transport maps.
TEN RELATED HOW TO's:
This sample shows the Spider Chart that represents the budget and spending for one organization and allows to compare them. The multivariate data are represented on the Spider Chart as a two-dimensional chart with four or more variables displayed on the axes that start in one point. The Spider Charts are used in the management, business and sport.
Picture: Spider Chart Template
One of the key roles at the attracting visitors in catering establishments of different formats plays their visual solution, design of advertising elements of fast foods and restaurants.
ConceptDraw DIAGRAM software enhanced with unique Food Court solution from the Food and Beverage area of ConceptDraw Solution Park allows to design inviting and attractive signboards, pictorial menus with appetizing food pictures.
Picture: Food Pictures
Related Solution:
Use Case Diagrams technology. IDEF4 standard implies not only graphical presentation but the additional information about diagrams of heredity, methods systematization and types which are contained in specifications.
Picture: IDEF4 Standard
ConceptDraw DIAGRAM is the beautiful design software that provides many vector stencils, examples and templates for drawing different types of illustrations and diagrams.
Mathematics Solution from the Science and Education area of ConceptDraw Solution Park includes a few shape libraries of plane, solid geometric figures, trigonometrical functions and greek letters to help you create different professional looking mathematic illustrations for science and education.

Picture: Scientific Symbols Chart
Related Solution:
ConceptDraw DIAGRAM is a software for making infographics illustrations. You can work with various components to build really impressive and easy-to-understand infographics design.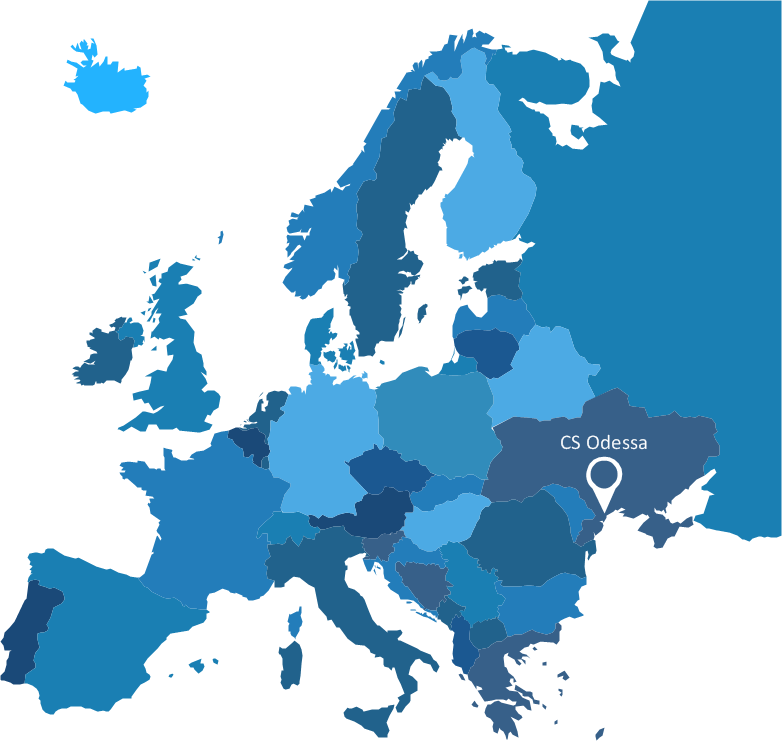
Picture: Spatial infographics Design Elements: Continental Map
Do you like infographics and data visualization? Creating infographics is super-easy with ConceptDraw.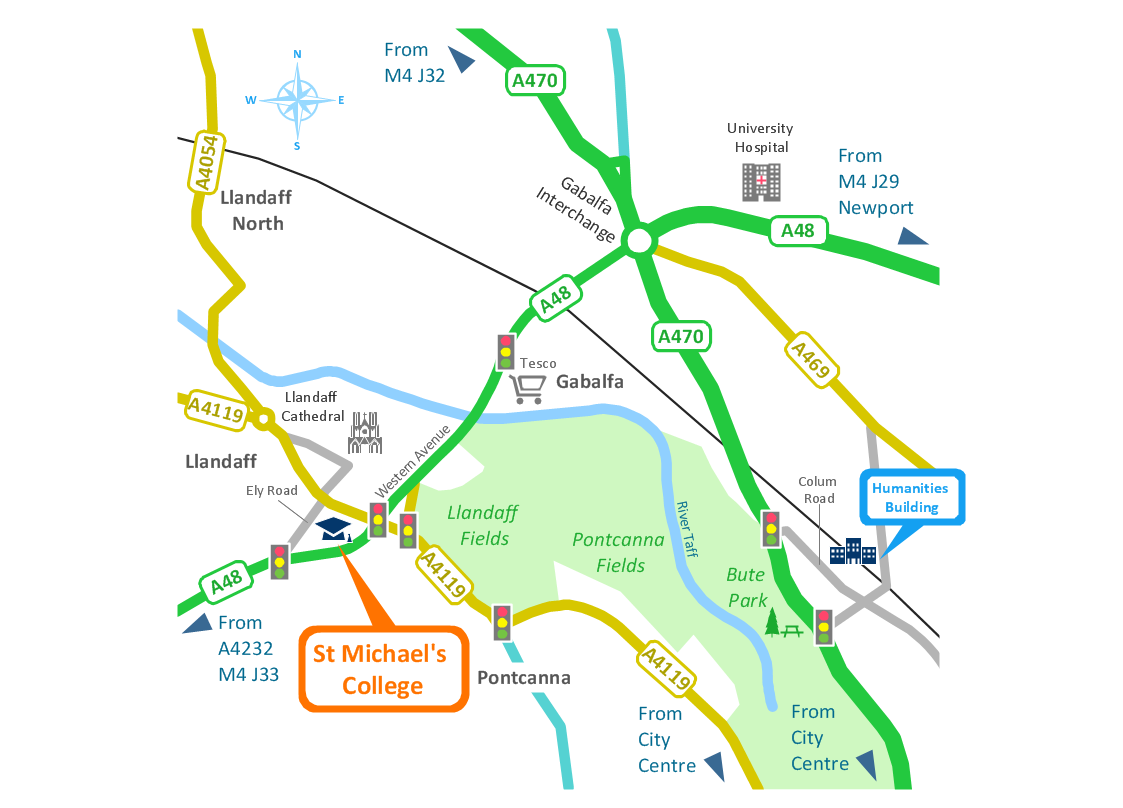
Picture: Spatial infographics Design Elements: Transport Map
Looking for the line graph examples you can simply go to the Line Graphs solution of ConceptDraw STORE to get those which were previously created especially for the ConceptDraw DIAGRAM users in order to simplify their work of making such charts.
Picture: Line Graph
Related Solution:
ConceptDraw DIAGRAM is the best program to make workflow diagrams. With the new Arrows10 technology it brings features allow you make workflow diagrams faster then ever before. These features allow you to focus on thinking, not drawing, that makes ConceptDraw DIAGRAM the best program to make workflow diagrams.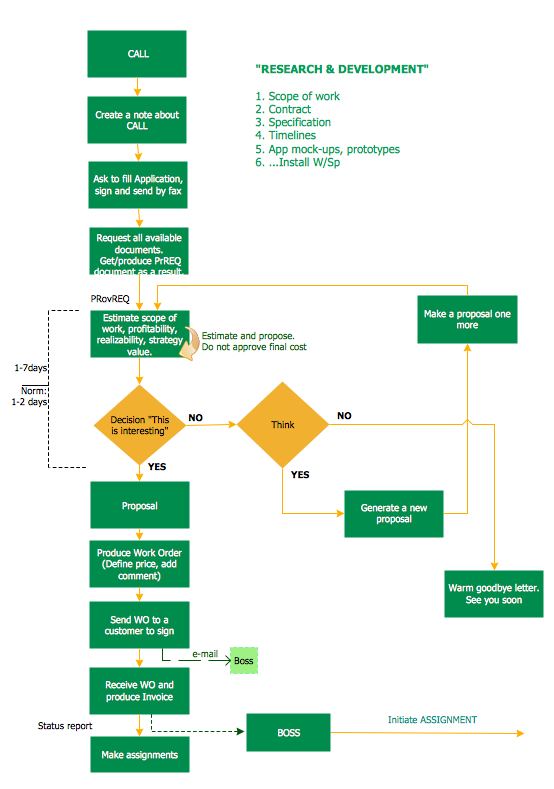
Picture: Best Program to Make Workflow Diagrams
Related Solution:
Do you like the professional schemes that you can find on the Internet? Take into account that the most part of them is made using the Best Flowchart Software and Flowchart Symbols. Try you own powers in creating such diagrams!
Flowcharts are the most business diagramming tool. If you are a business manager, you can use flow chart to depict work flow in your organization, develop the effective organizational structure and present the information to investors or other stakeholders. Combining the smart management solutions with ConceptDraw DIAGRAM diagramming engine delivers the set of comprehensive flowchart tools necessary to support professionals in their creativeness and business activity.
Picture: Best Flowchart Software and Flowchart Symbols
Related Solution:
While designing a conceptual data model, you should use appropriate software. For instance, ConceptDraw DIAGRAM is a user-friendly ER diagram tool that has a lot of samples and templates to facilitate your work. A clear entity-relationship diagram helps to define the relations between system’s components.
Software engineering is the section of a computer science engaged to design, realization, and support of complex software products. An ERD is a data modeling method that is widely applied in the software engineering practice. Commonly it is used for developing a structure of a a relational database. An entity relationship diagram is helpful for structuring and organizing databases that can be modeled using a relational structure. An entity relationship diagram is designed to depicts the interrelationships within the sets of entities which are accumulated in the database. Each entity represents a particular component of a data. Thus, ER diagrams depicts the logical structure of databases. ConceptDraw ER Diagrams solution provides software engineers with the professional tool for making entity-relationship diagrams.
Picture: Entity Relationship Diagram Software Engineering
Related Solution: