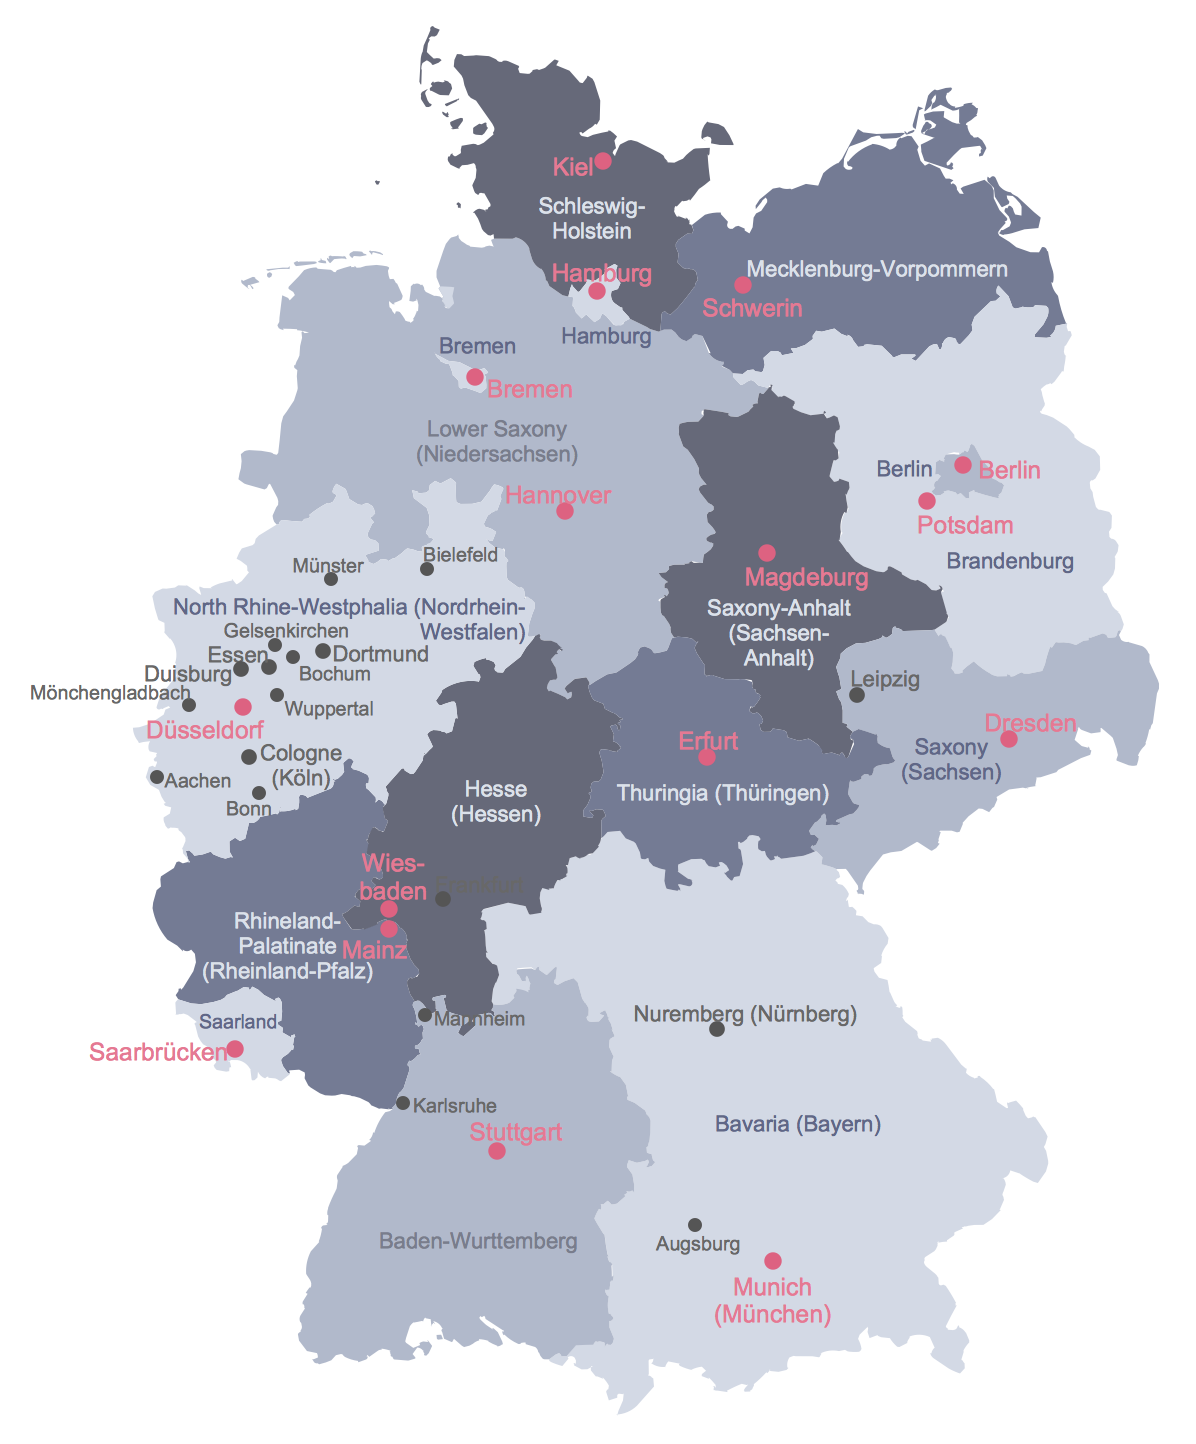
Example 1. Political Map of Germany
To quickly design the map of Germany in ConceptDraw DIAGRAM please turn your attention for the collection of scalable graphic objects included to the Germany library from the Germany Map Solution. All they are vector and let you design the large map of Europe with Germany on it, the whole map of Germany, or the maps of any Germany state literally in a few minutes.

Example 2. Germany Library Design Elements
Almost all of these objects possess an action feature - you can use the commands from the action menu to show/hide federal states and their names, capitals and major cities, regions and districts. Note that the list of action possibilities differs according of object.
Besides, the Germany Map solution includes also wide variety of predesigned samples which are available from ConceptDraw STORE. Each of them is easy printable map, and so ideal for using in various presentations and publications. Use successfully the Germany Map samples as are or as the base for your own maps.

Example 3. Map of Germany Districts
The samples you see on this page were created in ConceptDraw DIAGRAM software using the tools of the Germany Map solution. An experienced user spent 5 minutes creating each of these maps, all they are available from ConceptDraw STORE.
Use the Germany Map solution for ConceptDraw DIAGRAM software to design your own Map of Germany quick, easy and effective, and then successfully use it in your life or work activity.
All source documents are vector graphic documents. They are available for reviewing, modifying, or converting to a variety of formats (PDF file, MS PowerPoint, MS Visio, and many other graphic formats) from the ConceptDraw STORE. The Germany Map Solution is available for all ConceptDraw DIAGRAM users.
TEN RELATED HOW TO's:
Greece is strategically located at the crossroads of Europe, Asia, and Africa.
The vector stencils library Greece contains contours for ConceptDraw DIAGRAM diagramming and vector drawing software. This library is contained in the Continent Maps solution from Maps area of ConceptDraw Solution Park.
Picture: Geo Map — Europe — Greece
Related Solution:
If you want to find a way to understand complex things in minutes, you should try to visualize data. One of the most useful tool for this is creating a flowchart, which is a diagram representing stages of some process in sequential order. There are so many possible uses of flowcharts and you can find tons of flow charts examples and predesigned templates on the Internet. Warehouse flowchart is often used for describing workflow and business process mapping. Using your imagination, you can simplify your job or daily routine with flowcharts.
Warehouse flowcharts are used to document product and information flow between sources of supply and consumers. The flowchart provides the staged guidance on how to manage each aspect of warehousing and describes such aspects as receiving of supplies; control of quality; shipment and storage and corresponding document flow. Warehouse flowchart, being actual is a good source of information. It indicates the stepwise way to complete the warehouse and inventory management process flow. Also it can be very useful for an inventory and audit procedures.
Picture: Flow Chart Example: Warehouse Flowchart
Related Solution:
Building plans are usually very complicated and a hard work to do. It would be nice to use a proper drawing software to facilitate the task. Design a site plan quick and easily with all the stencils and samples from ConceptDraw libraries.
This drawing shows content of the ConceptDraw vector libraries related to the site planning and arrangement of the living environment. ConceptDraw delivers about 50 libraries containing near one and a half thousands vector objects that will help you to design territory arrangement plans and make the Site plan sketches. You can use the Parking and Roads library for designing a parking space, or drawing transport management schemes. The Site Accessories library provides a number of objects, that allow you to depict various equipment of vehicle access control, street lamps, benches, trash cans and other items of the street environment.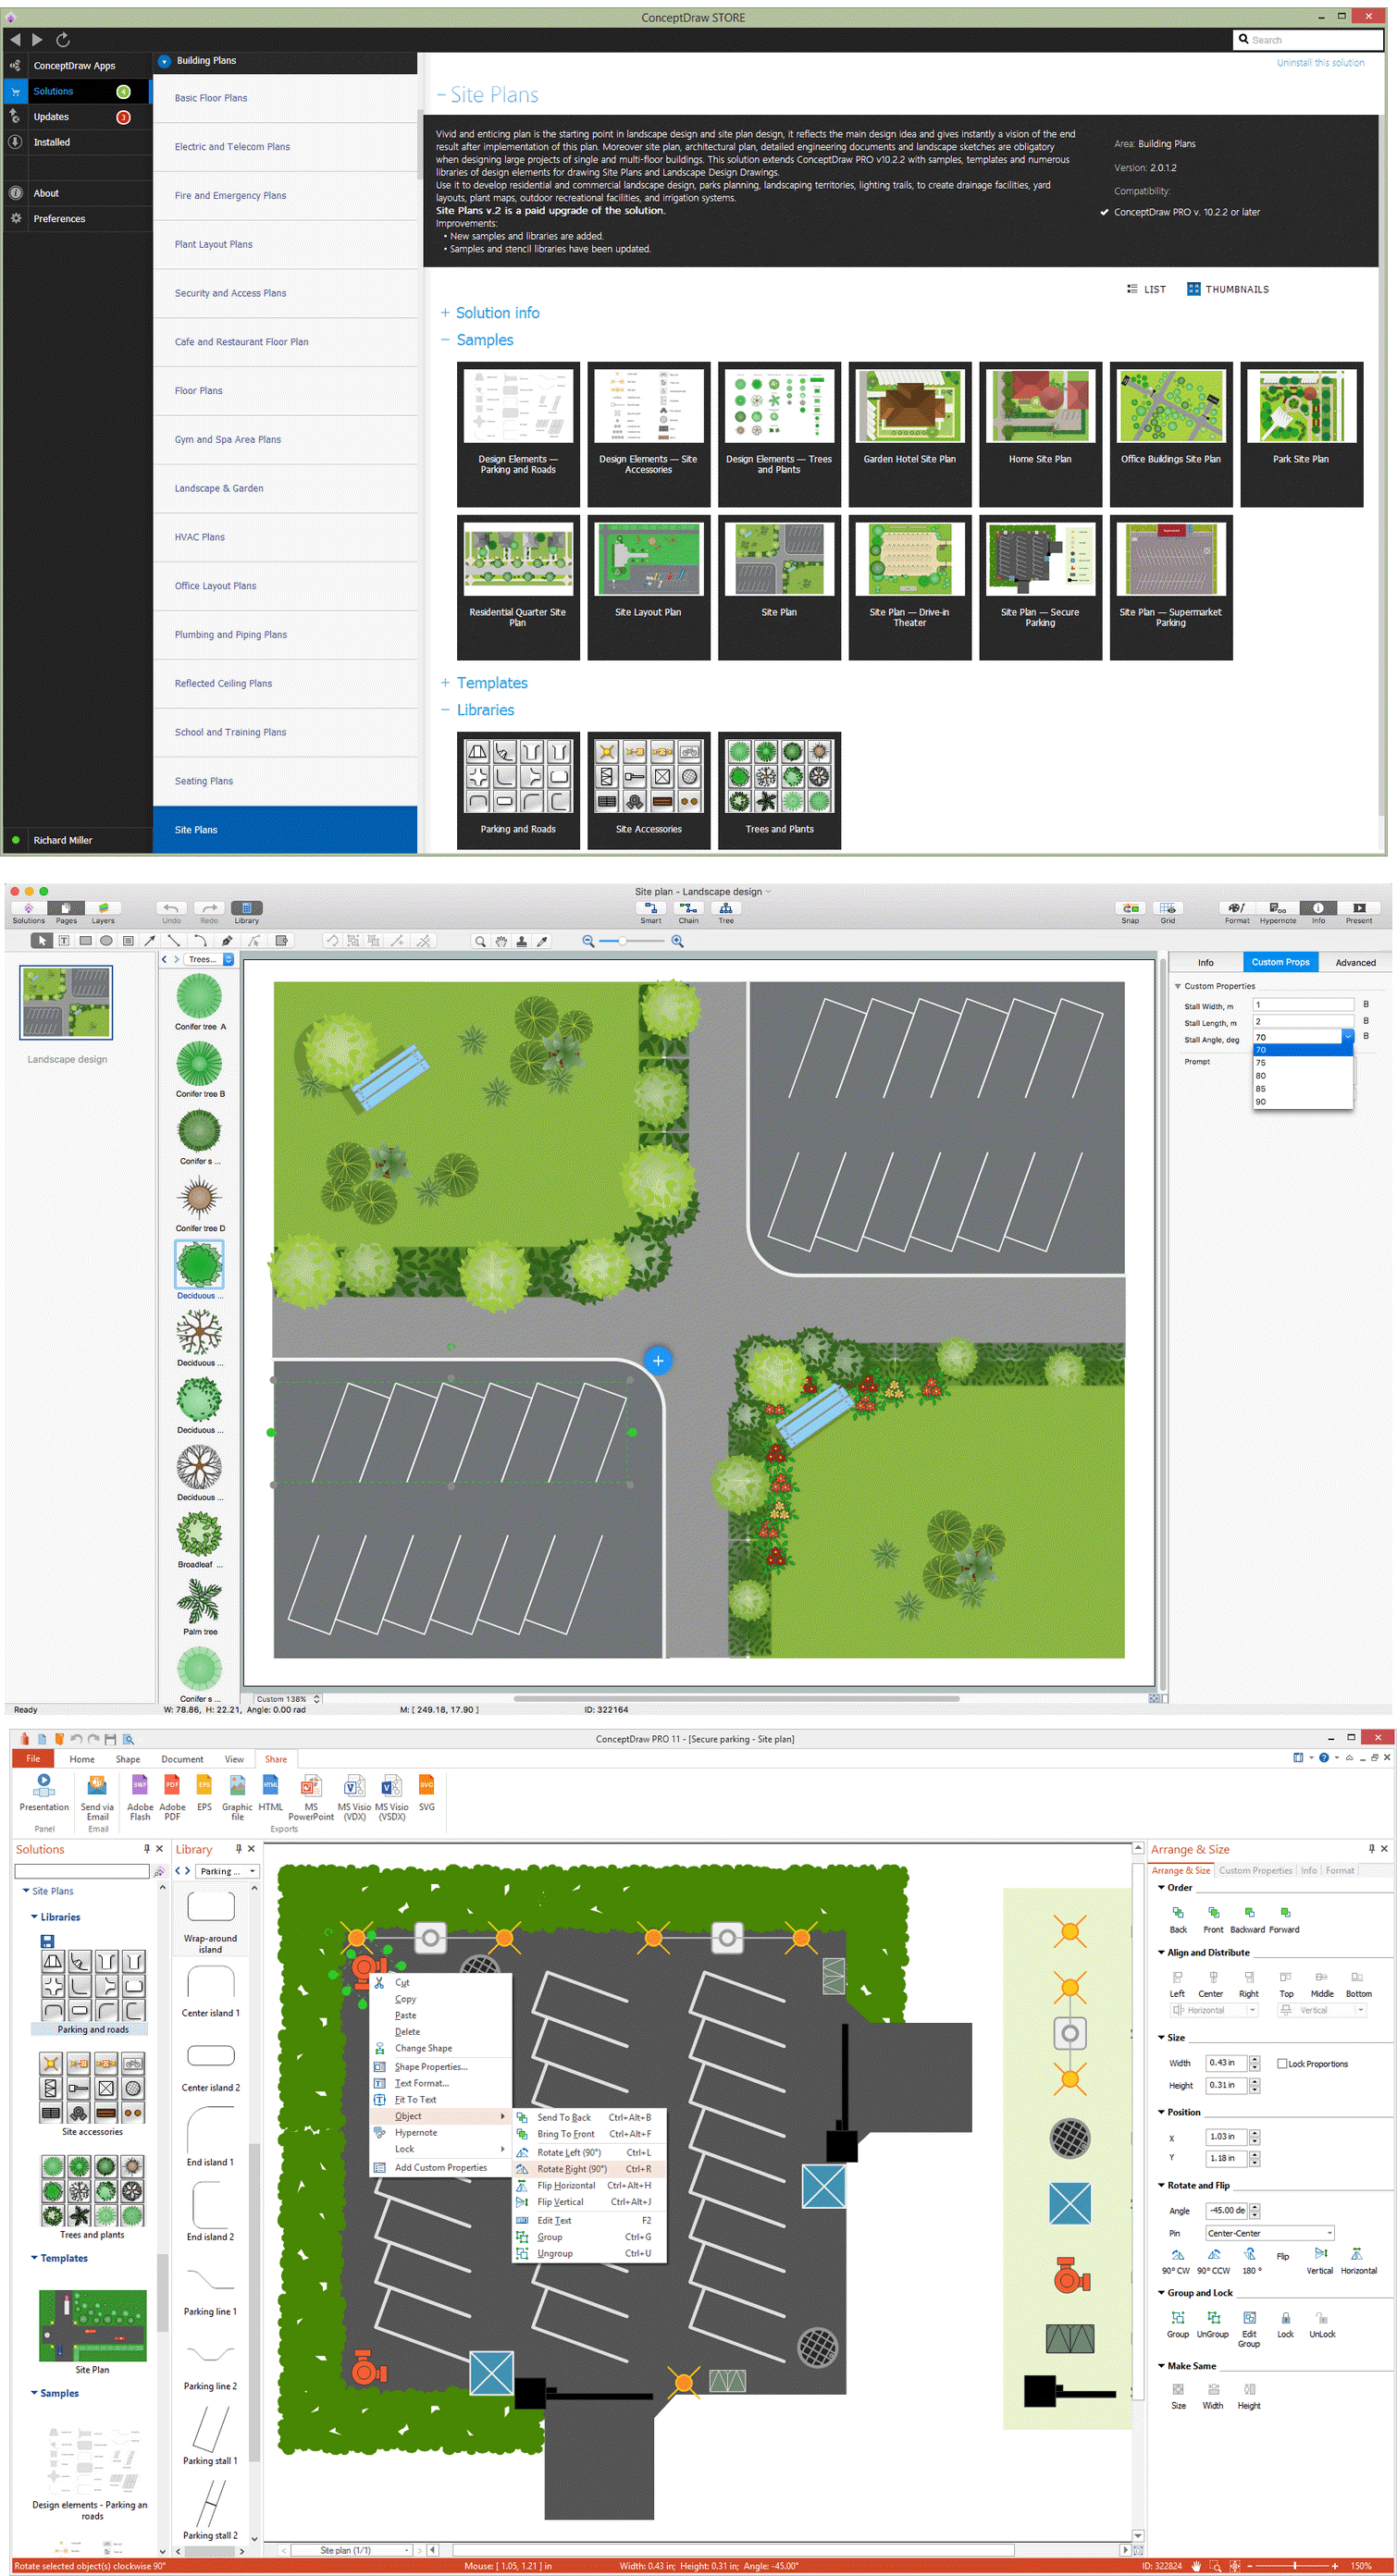
Picture: Building Drawing Software for Design Site Plan
Related Solution:
Event-Driven Process Chain Diagrams for improvement throughout an organisation.
ConceptDraw DIAGRAM - software that reduces the time needed to create a business process model.
Picture: Beauty of Event-driven Process Chain (EPC) diagrams
Related Solution:
ConceptDraw DIAGRAM is idea to draw the geological maps of World from the pre-designed vector geo map shapes.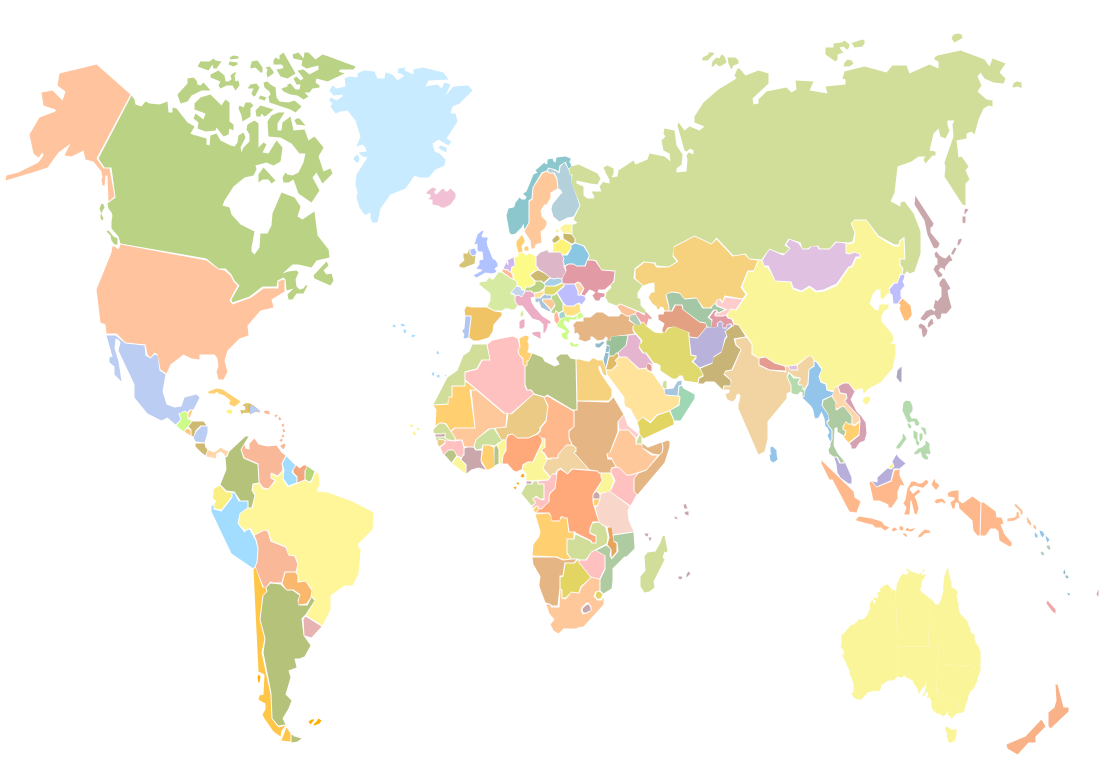
Picture: Geo Map - World
Related Solution:
Electrical Engineering Solution used together with ConceptDraw DIAGRAM drawing facilities makes short a work of drawing various electrical and electronic circuit schemes. A library of vector objects composed from symbols of Analog and Digital Logic elements of electric circuit includes 40 symbolic images of logic gates, bistable switches of bi-stable electric current, circuit controllers, amplifiers, regulators, generators, etc. All of them can be applied in electronic circuit schemes for showing both analog and digital elements of the circuit.
Electrical Engineering Solution used together with ConceptDraw DIAGRAM drawing facilities makes short a work of drawing various electrical and electronic circuit schemes. A library of vector objects composed from symbols of Analog and Digital Logic elements of electric circuit includes 40 symbolic images of logic gates, bistable switches of bi-stable electric current, circuit controllers, amplifiers, regulators, generators, etc. All of them can be applied in electronic circuit schemes for showing both analog and digital elements of the circuit.
Picture:
Electrical Diagram Symbols F.A.Q.
How to Use Electrical ConceptDraw Diagram Software
Related Solution:
It is impossible to imagine modern life and science without maps, they surround us anywhere, they are used in geography, history, politics, economics, and many other fields of science. ConceptDraw DIAGRAM diagramming and vector drawing software offers the USA Maps Solution from the Maps Area of ConceptDraw Solution Park with its collection of samples and libraries for easy drawing the Map of USA.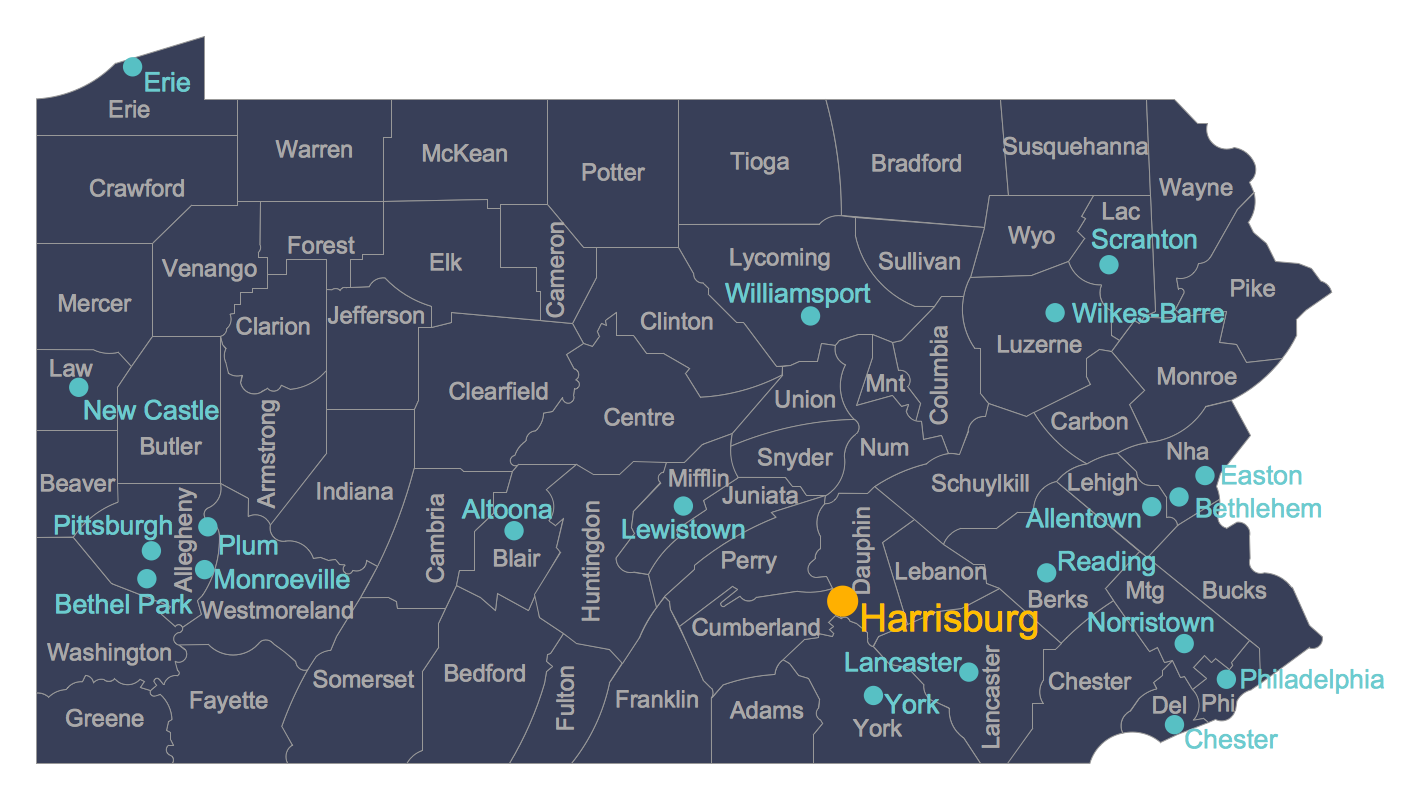
Picture: Map of USA
Related Solution:
The Saarland is one of the sixteen federal states (or Bundesländer) of Germany. The capital city is Saarbrücken.
Despite the fact that the maps surround us everywhere in our life, usually the process of their drawing is sufficienly complex and labor-intensive. But now, thanks to the ConceptDraw DIAGRAM diagramming and vector drawing software extended with Germany Map Solution from the Maps Area of ConceptDraw Solution Park, we have the possibility to make easier this process. Design fast and easy your own pictorial maps of Germany, map of Germany with cities, and thematic Germany maps in ConceptDraw DIAGRAM!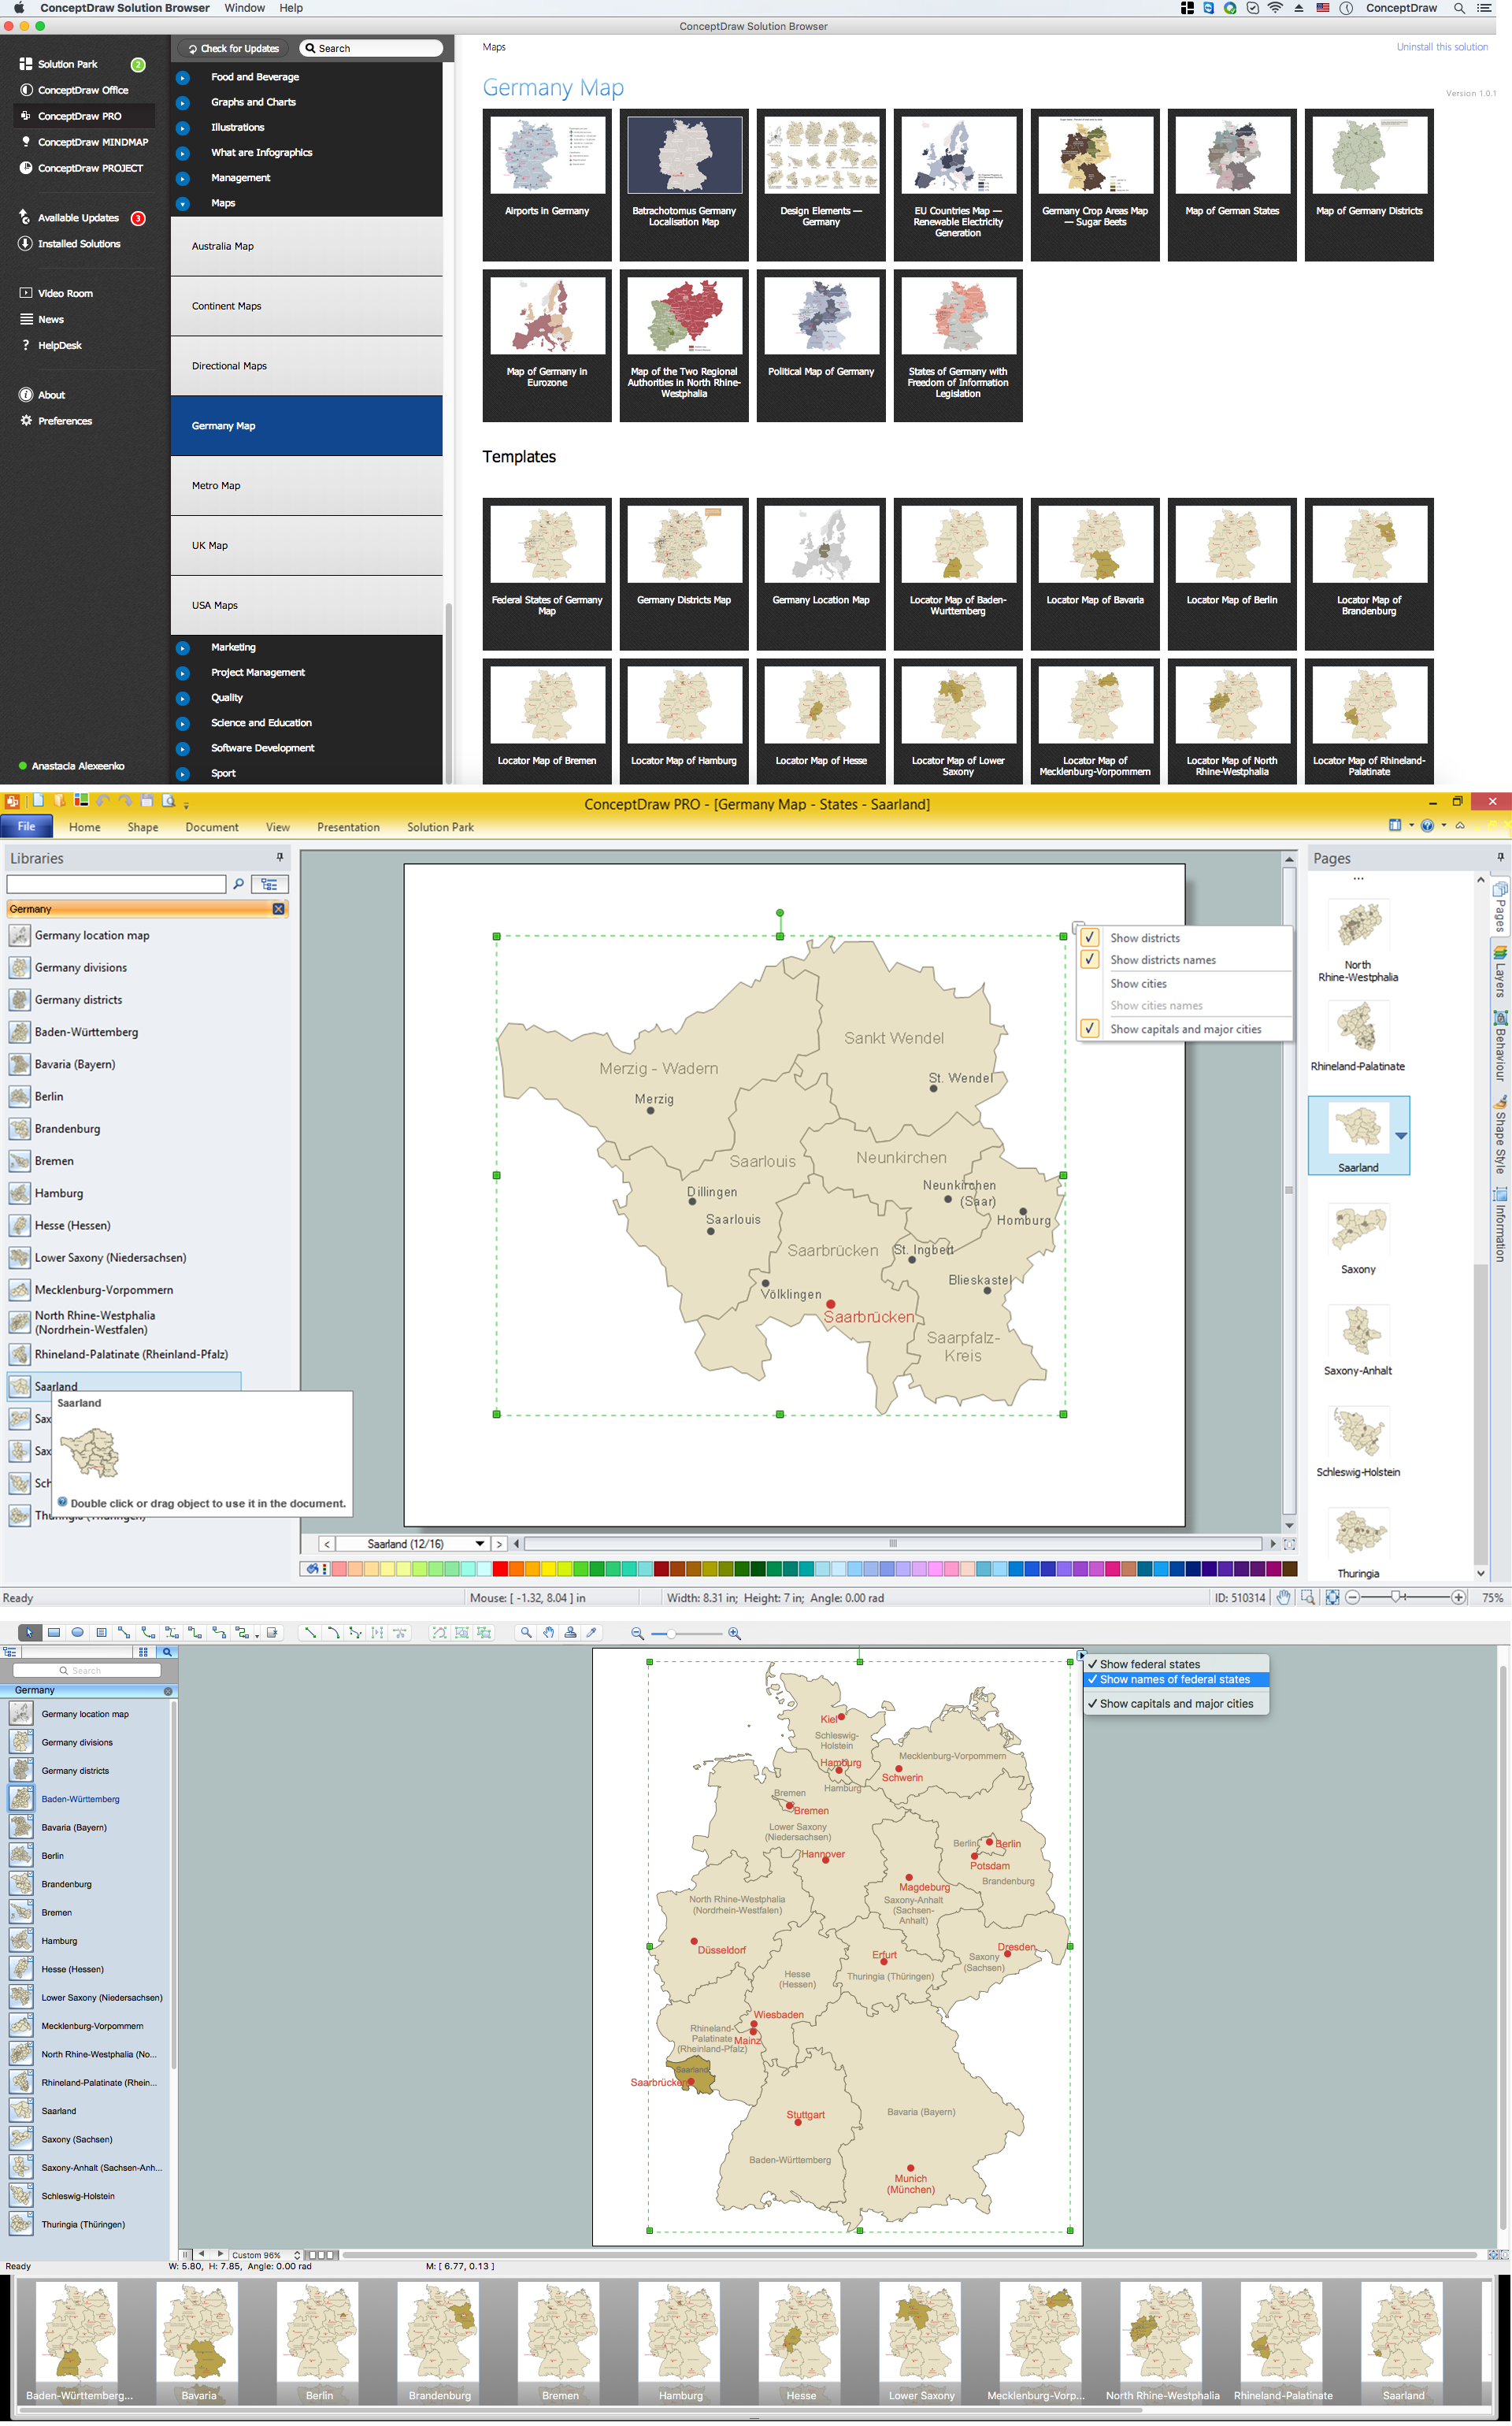
Picture: Map of Germany — Saarland State
Related Solution:
A circuit diagram is sometimes also called an elementary diagram, electronic schematic or electrical diagram circuits. It is essential in construction of any electronic equipment. Among many digital drawing tools available, ConceptDraw DIAGRAM is a leading circuits and logic diagram software, affording for easy and quick creation of even the most advanced and complex diagram designs. This makes it a perfect choice for computer science and any kind of electronic engineering.
This drawing includes the graphic symbols that may be in use while creating a logic circuit diagram. The diagrams of such kind are used in the electronics industry. The logic symbol depicts a device that realizes a Boolean type functions. Practically a logic symbol means transistor, diodes, relays, and other mechanical or optical details which provide function of closing or opening "gates". Totally the logic circuits can involve millions of gates. ConceptDraw Electrical Engineering solution gives the opportunity to create a circuit diagrams both simple and difficult.
Picture: Circuits and Logic Diagram Software
Related Solution:
New Jersey is a state in the Northeastern and Middle Atlantic regions of the United States.
The vector stencils library New Jersey contains contours for ConceptDraw DIAGRAM diagramming and vector drawing software. This library is contained in the Continent Maps solution from Maps area of ConceptDraw Solution Park.
Picture: Geo Map — USA — New Jersey
Related Solution:

