How should diagramming software work? Is it possible to develop a diagram as quickly as the ideas come to you?
The innovative ConceptDraw Arrows10 Technology included in ConceptDraw DIAGRAM is a powerful drawing tool that changes the way diagrams are produced.
While making the drawing process easier and faster.
ConceptDraw DIAGRAM is a powerful tool that helps you create a process map diagram quickly and easily. Fine-tuning the objects in ConceptDraw DIAGRAM allows you to create a really professional finished article. ConceptDraw Arrows10 Technology gives drawing connectors a smart behavior that provides quick and precise placement, allows for easy changes and automatic rearrangement.
A connection point is a special symbol on drawing shapes in ConceptDraw DIAGRAM. The connection point is intended as a target for connectors when working with objects in your diagram. By default, it lies exactly in the center of every shape, you can see this when the connection tool is selected.
There are additional invisible connection points in the center of each object’s side to facilitate making connections.
When using the connector tool you can make a connection by selecting a connection point of one object to another objects connection point. To verify you have hit the connection point it becomes displayed as a cross sign. Now your objects are connected! When moving objects inside of your diagram, connectors will stay pinned to the object’s center.
If you need to draw your connector from a specific point on an object that is not its center, you can create your own connection point. Just start drawing your connector starting at the newly selected connection point.
The start point will become red; this means that a new connection point has been created. Now your connector is pinned to this exact point. This works if you create a new connection point at an object’s border.
You can easily disconnect a connector from any point and connect it to another one. The first connection point will be deleted automatically.
There is also a Point tool, this can be used if you want to start your connector inside or outside the shape you wish to connect to.
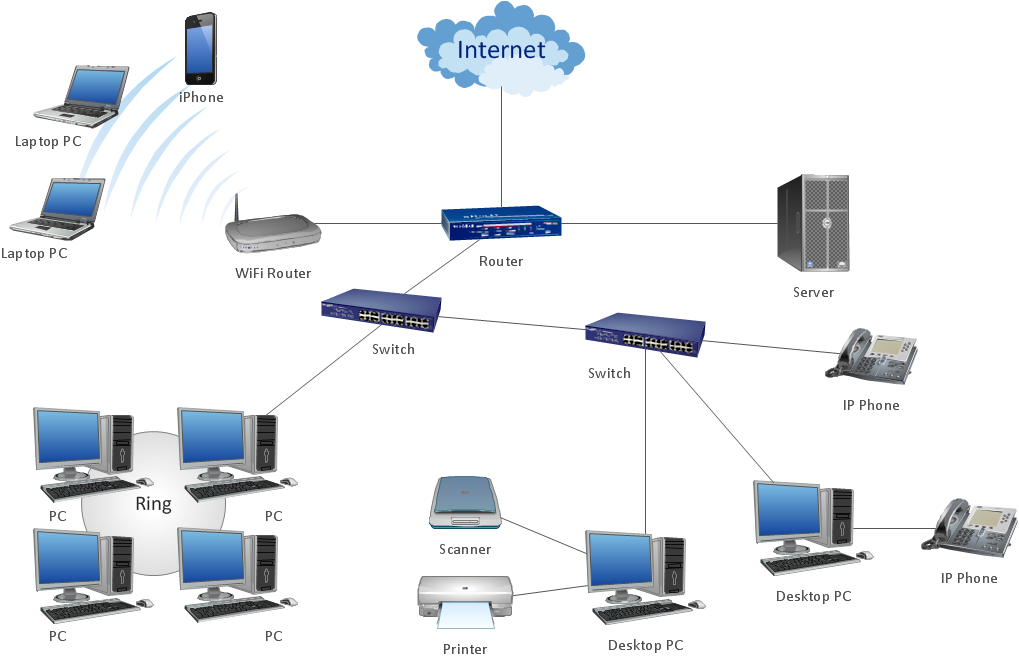
Sample 1. Common network diargam.
ConceptDraw DIAGRAM diagramming software provides vector shapes and connector tools for quick and easy drawing diagrams for business, technology, science and education.
Use ConceptDraw DIAGRAM enhanced with solutions from ConceptDraw Solution Park to create diagrams to present and explain structures, process flows, logical relationships, networks, and other visually organized information and knowledge.
ConceptDraw Network Drawing Software - Network design software for network drawings with abundant examples and templates.
Create computer network designs, diagrams and schematics using ConceptDraw.
Using ConceptDraw you will be able to create bubble diagrams from the ready ConceptDraw library objects or make your own objects. The created diagram can be saved and edited, objects can be moved and links between them will be automatically repainted after object moving because of using the ConceptDraw connectors.
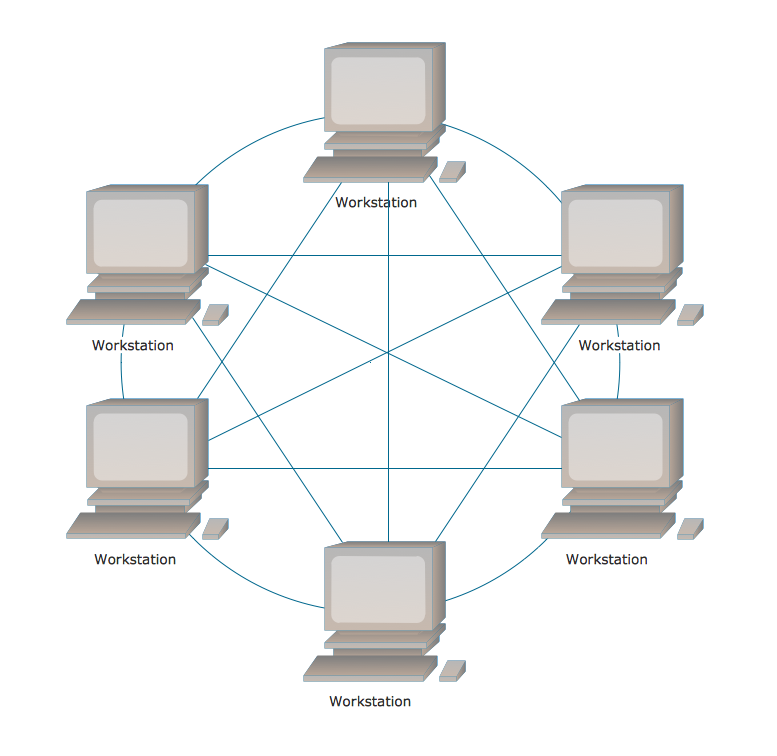
There are several basic topologies including bus, star, point-to-point, ring and a hybrid. Two computers can form a fully connected network topology, and as the number of network nodes increases, the network diagram gets more complicated. This type of topology is also called a full mesh.
This is a visual example of a computer network built using a mesh topology. This diagram presents the schematic structure of the full mesh network topology. A common mesh network topology means that each network device is connected with several points in the network, so if the one node of the network goes down, it does not cause an issue with an operability of the entire computer network. In a full mesh network topology, every computer or device in the network is interconnected with each of the other devices in the network.
Explore practical flowchart examples including business process diagrams, workflow charts, swimlane flowcharts, and IT troubleshooting flows. Review common patterns and start from ready templates.
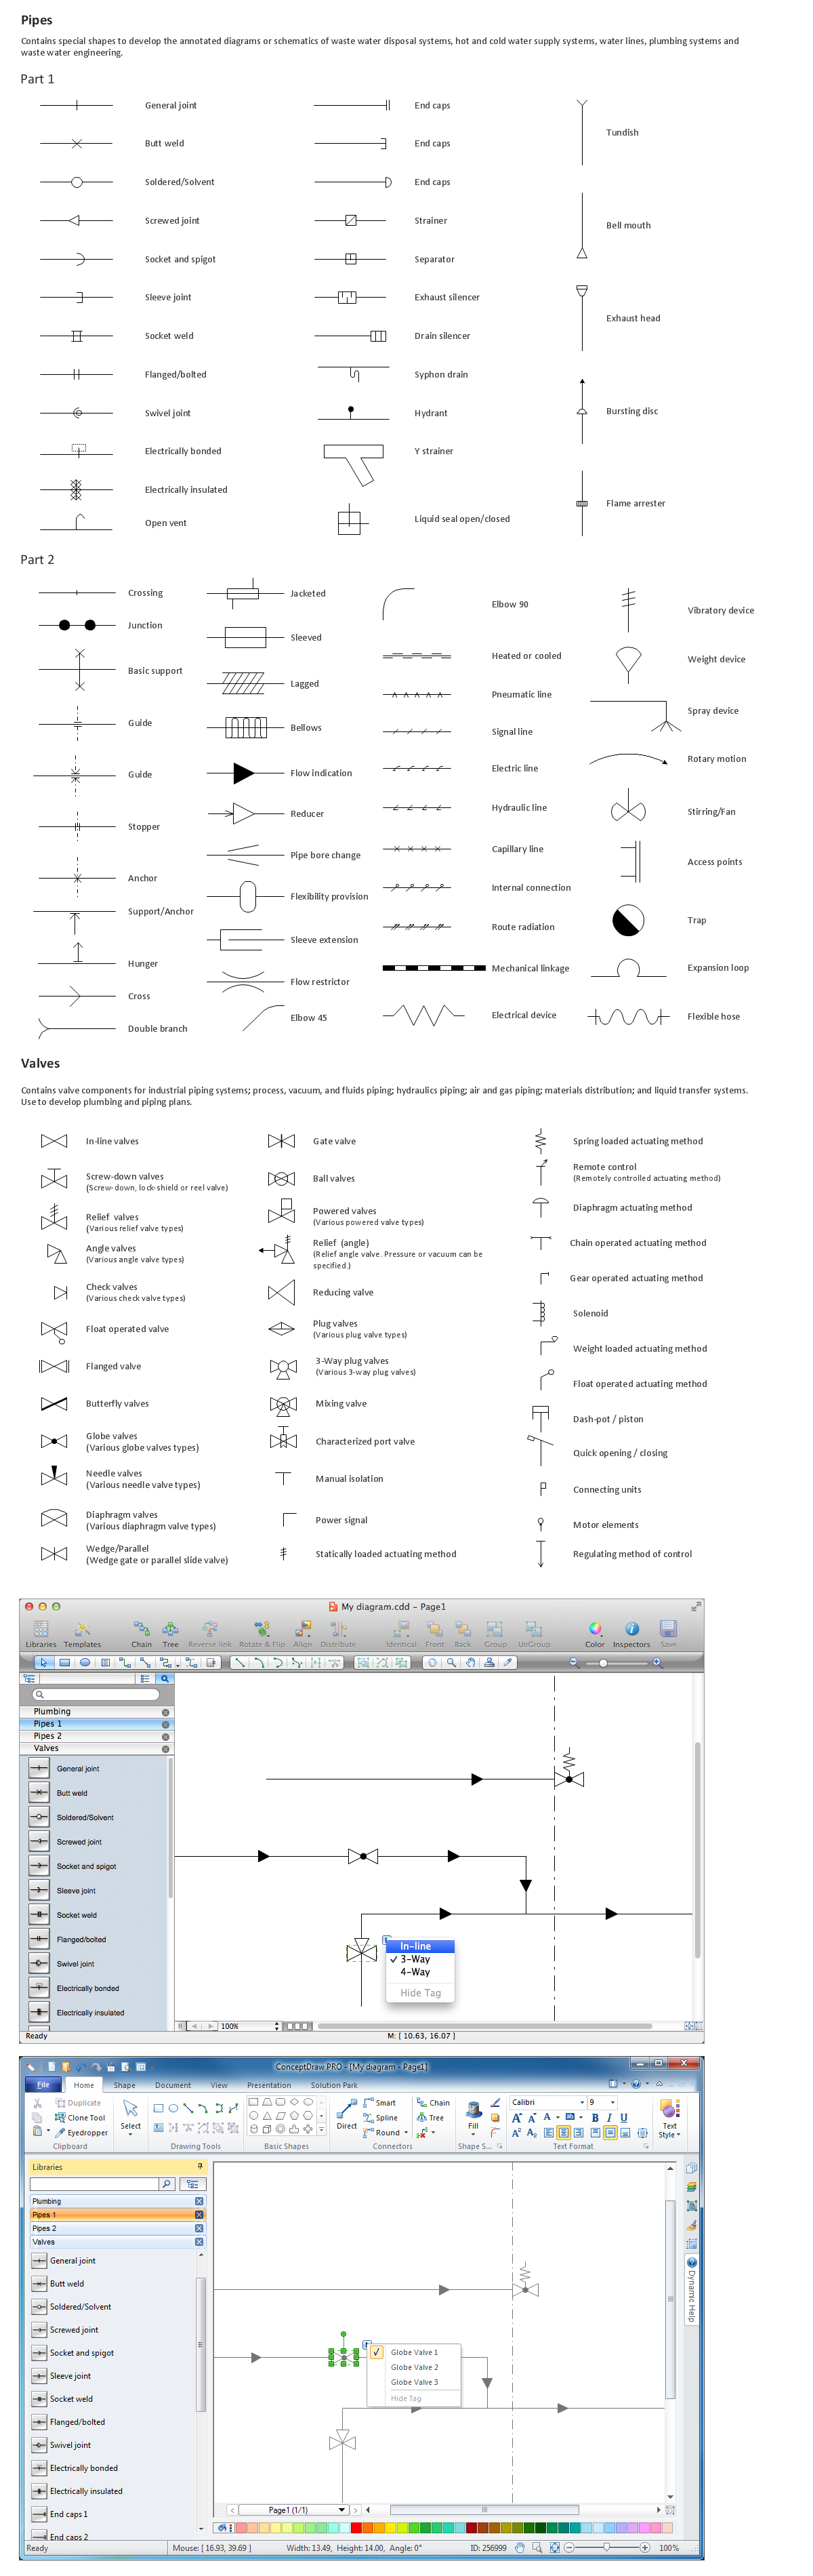
Use building drawing software to develop the annotated diagrams or schematics of waste water disposal systems, hot and cold water supply systems, water lines and waste water engineering.
Picture: Building Drawing Software for Design Piping Plan
The ConceptDraw DIAGRAM diagramming and vector drawing software provides the Cloud Computing Diagrams solution from the Computers and Network area of ConceptDraw Solution Park with powerful drawing tools and libraries containing large amount of predesigned vector objects for easy designing and displaying the structure of Amazon Cloud Computing Architecture.
Flowcharts can be used in designing and documenting both simple and complex processes or programs and, similar to the other types of diagrams, they can help visualize what happens and so help understand some definite process, and, as a result, find flaws, bottlenecks and other features within it.
Visio for Mac and Windows - ConceptDraw as an alternative to MS Visio. ConceptDraw DIAGRAM delivers full-functioned alternative to MS Visio. ConceptDraw DIAGRAM supports import of Visio files. ConceptDraw DIAGRAM supports flowcharting, swimlane, orgchart, project chart, mind map, decision tree, cause and effect, charts and graphs, and many other diagram types.
Picture: Is ConceptDraw DIAGRAM an Alternative to Microsoft Visio?