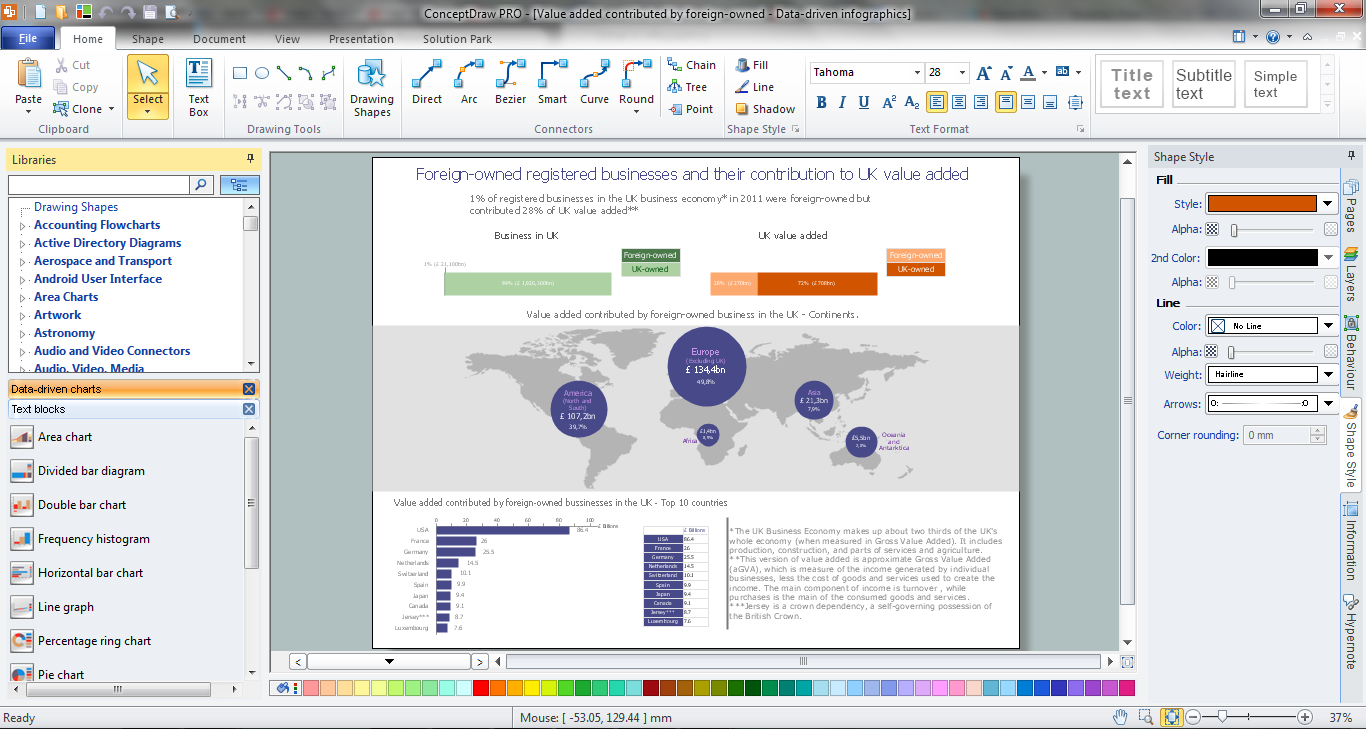
Example 1. Infographic Tools of ConceptDraw DIAGRAM
Among all infographic tools offered by Data-driven Infographics Solution the most main importance have the smart vector objects offered by the Data-driven Charts library. You can easy sure this - you need merely change the data at the table and the object view will change automatically in one moment.

Example 2. Data-driven Charts Library Design Elements
You will also benefit from the predesigned samples included in the Data-driven Infographics Solution. All they are clear and useful examples, and also can become the good source of inspiration for self-dependent professional drawing.

Example 3. Data-driven Infographics — Effects of Taxes and Benefits
The Data-driven Infographics samples you see on this page were created in ConceptDraw DIAGRAM software using the infographics tools of the Data-driven Infographics Solution. They successfully demonstrate solution's capabilities and professional results you can achieve. An experienced user spent 10 minutes creating each of them.
Use the best infographic tools of Data-driven Infographics Solution for ConceptDraw DIAGRAM Solution Park for effective creating the Data-driven Infographics.
All source documents are vector graphic documents. They are available for reviewing, modifying, or converting to a variety of formats (PDF file, MS PowerPoint, MS Visio, and many other graphic formats) from the ConceptDraw STORE. The Data-driven Infographics Solution is available for all ConceptDraw DIAGRAM or later users.
SIX RELATED HOW TO's:
You want design Pictorial Chart or Infographic? And you need powerful infographic software? Then ConceptDraw DIAGRAM diagramming and vector drawing software extended with Pictorial Infographics Solution from the “Infographics” Area is exactly what you need.
Picture: Pictorial Chart
Related Solution:
ConceptDraw DIAGRAM is a Mac OS X and Windows software. Numerous vector stencils, samples and templates created by designers are included in the basic package. This is classic flowchart maker which exactly follows the industry standards using flowchart symbols geathered during a ten years into solution park.
Picture: Flowchart Software
Related Solution:
Create a powerful infographic, become inspired by the people with ConceptDraw.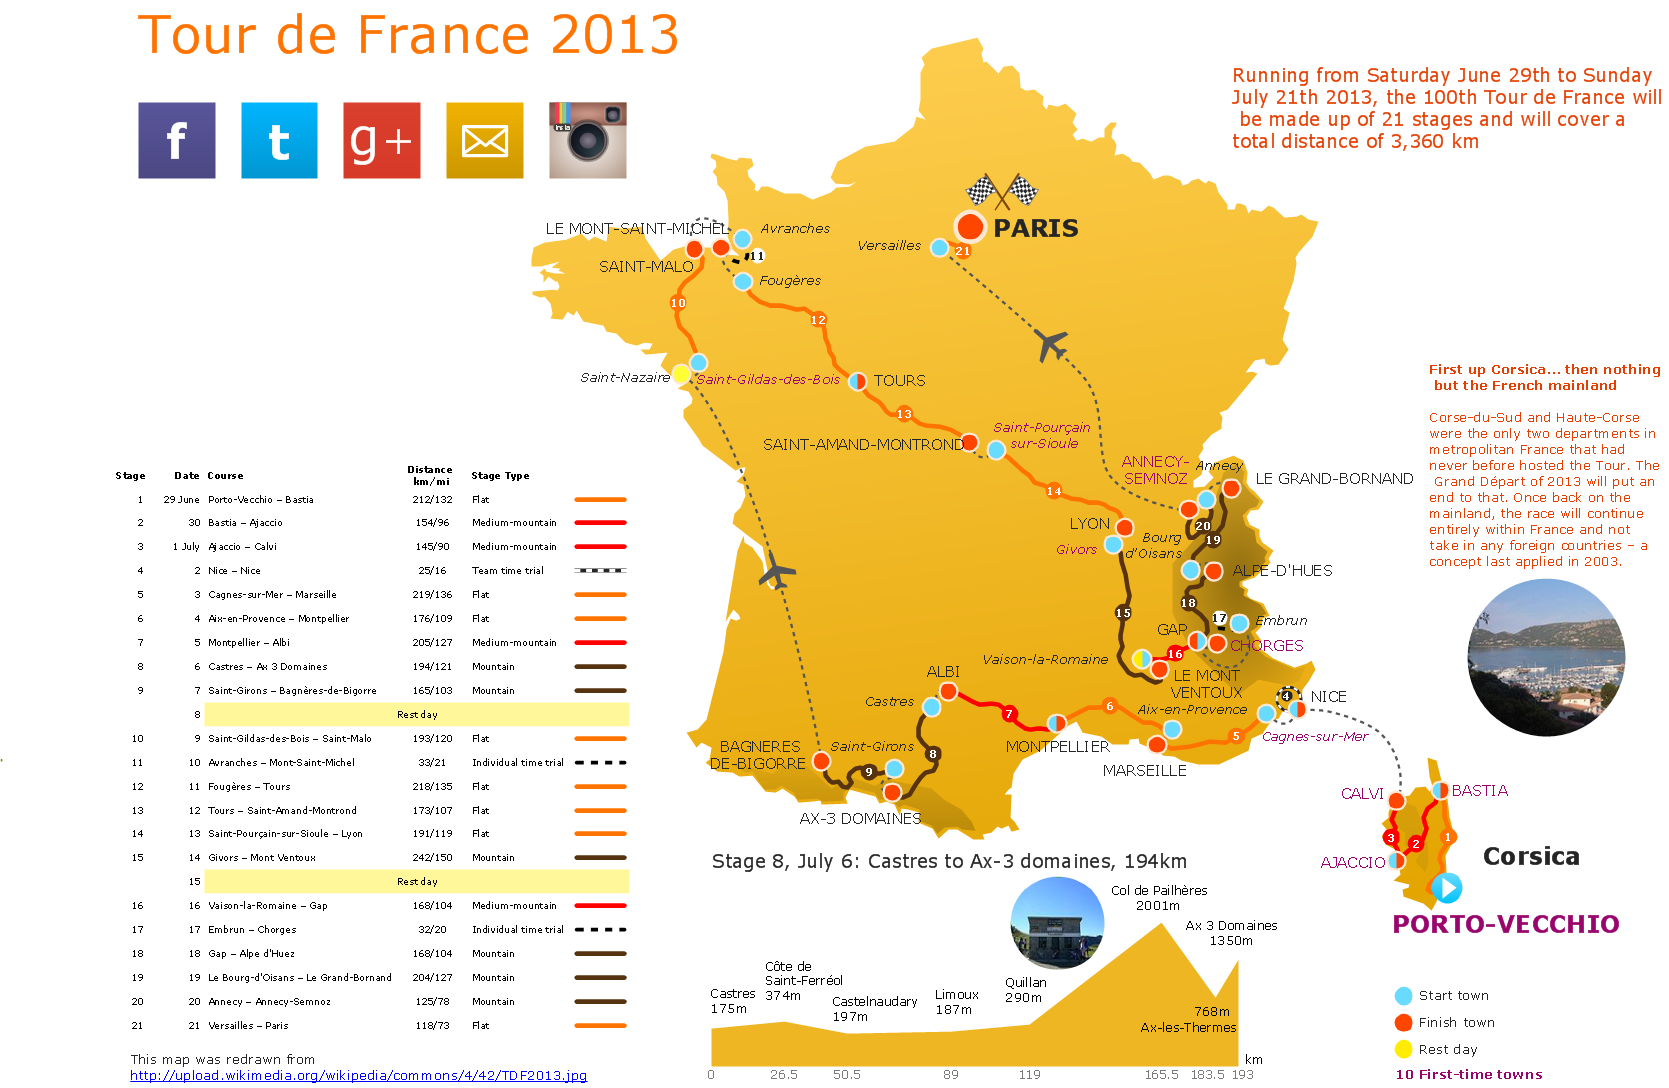
Picture:
How to Create a Powerful Infographic
When You do Not Have a Designer
Related Solution:
Make diagrams, charts, workflows, flowcharts, org charts, project charts easily with ConceptDraw software.
Picture: Best Program to Make Diagrams
Related Solution:
In the course of recent decades data visualization went through significant development and has become an indispensable tool of journalism, business intelligence and science. The way visual information may be conveyed is not limited simply to static or dynamic representation, it can also be interactive. Infographics can be conditionally divided into several general levels. Primarily, this is level of visualization of information, its interpretation and association on any ground. Second level can be defined as a visualization of knowledge, depiction of thoughts and ideas in the form of images or diagrams. Finally, the level of data visualization, which processes data arrays in charts, enabling the information to be more clearly perceived. You can also identify the main approaches to the creation of infographics: exploratory and narrative. Exploratory method insists on minimalist design in favor of data precision without unnecessary details and is common for scientific researches and ana
Picture: Design Pictorial Infographics. Design Infographics
Related Solution:
Electrical Engineering Solution used together with ConceptDraw DIAGRAM drawing facilities makes short a work of drawing various electrical and electronic circuit schemes. A library of vector objects composed from symbols of Analog and Digital Logic elements of electric circuit includes 40 symbolic images of logic gates, bistable switches of bi-stable electric current, circuit controllers, amplifiers, regulators, generators, etc. All of them can be applied in electronic circuit schemes for showing both analog and digital elements of the circuit.
Electrical Engineering Solution used together with ConceptDraw DIAGRAM drawing facilities makes short a work of drawing various electrical and electronic circuit schemes. A library of vector objects composed from symbols of Analog and Digital Logic elements of electric circuit includes 40 symbolic images of logic gates, bistable switches of bi-stable electric current, circuit controllers, amplifiers, regulators, generators, etc. All of them can be applied in electronic circuit schemes for showing both analog and digital elements of the circuit.
Picture:
Electrical Diagram Symbols F.A.Q.
How to Use Electrical ConceptDraw Diagram Software
Related Solution:

