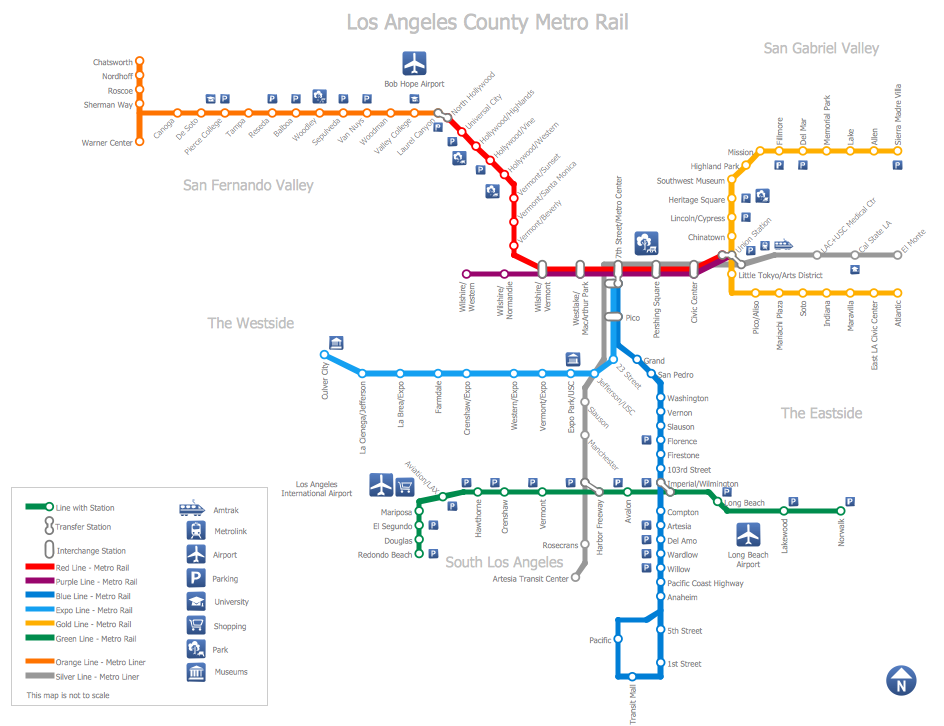
Example 1. Subway Train Map
Metro Map Solution includes the Transport Map library with 37 predesigned vector objects, template and wide variety of different samples. We hope you will find the desired for you among them.

Example 2. Transport Map Library Design Elements
Transport Map library contains all possible objects for creating Subway Train Map of any complexity without efforts. All what you need is simply drag the desired objects and construct the map from them.

Example 3. Metro Map - ELR Route Map
The samples you see on this page were created in ConceptDraw DIAGRAM software using the Metro Map solution. Each Subway Train Map created in ConceptDraw DIAGRAM successfully demonstrates solution's capabilities and professional results you can achieve. An experienced user spent 10-20 minutes creating each of these samples.
Use the Metro Map solution for ConceptDraw DIAGRAM software to create your own Subway Train Map of any complexity quick, easy and effective.
All source documents are vector graphic documents. They are available for reviewing, modifying, or converting to a variety of formats (PDF file, MS PowerPoint, MS Visio, and many other graphic formats) from the ConceptDraw STORE. The Metro Map Solution is available for all ConceptDraw DIAGRAM or later users.
TEN RELATED HOW TO's:
The vector stencils library Industrial transport contains clipart of industrial vehicles for ConceptDraw DIAGRAM diagramming and vector drawing software.
Use it to draw illustrations of industrial vehicles, transportation, lifting and moving materials using machines.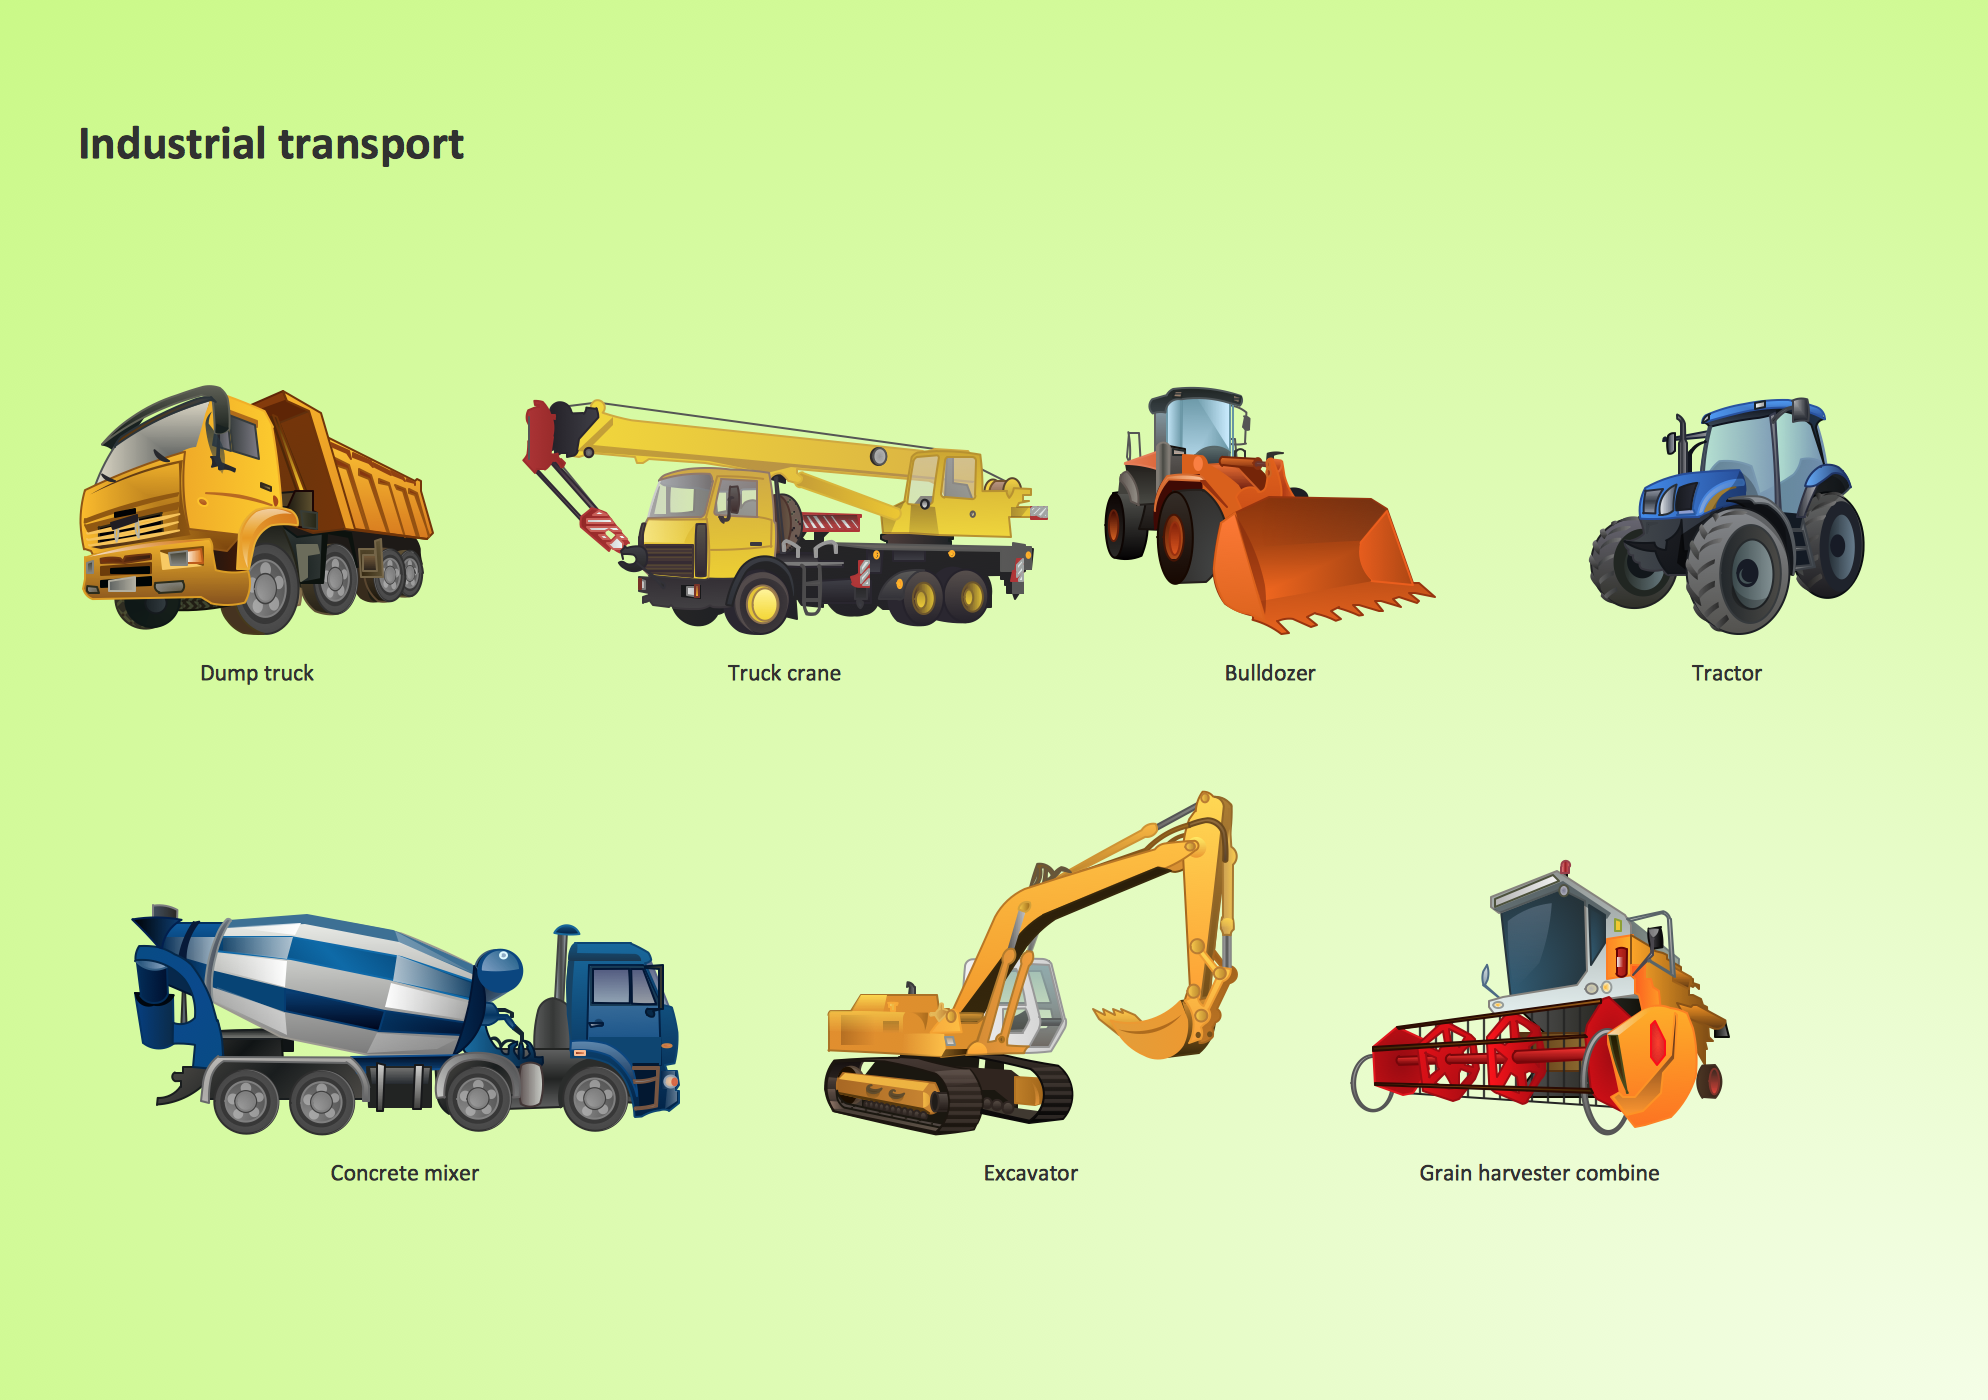
Picture: Industrial transport - Design elements
Related Solution:
The vector stencils library Germany contains contours for ConceptDraw DIAGRAM diagramming and vector drawing software. This library is contained in the Continent Maps solution from Maps area of ConceptDraw Solution Park.
Picture: Geo Map — Europe — Germany
Related Solution:
ConceptDraw collection of vector elements for infographics design.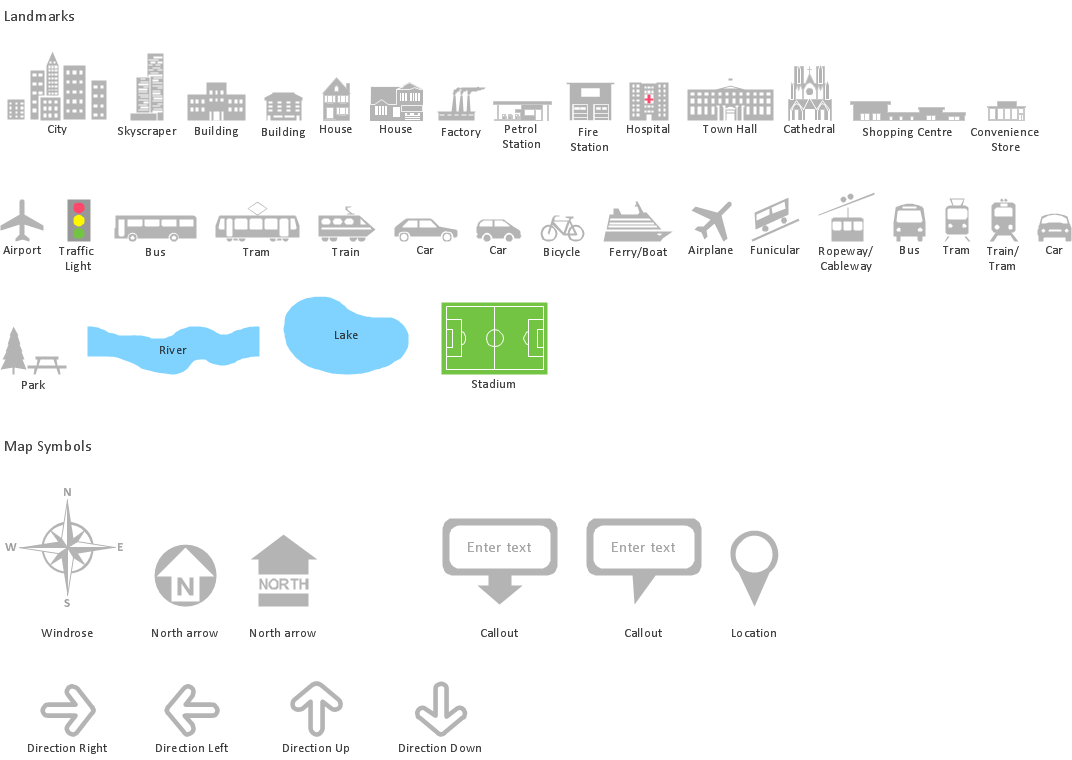
Picture: Map Infographic Design
ConceptDraw DIAGRAM diagramming and vector drawing software enhanced with Electrical Engineering Solution from the Industrial Engineering Area of ConceptDraw Solution Park offers you powerful tools and libraries with incredibly large quantity of predesigned electrical symbols as electrical schematic symbols for easy designing professional looking Electrical Schematics.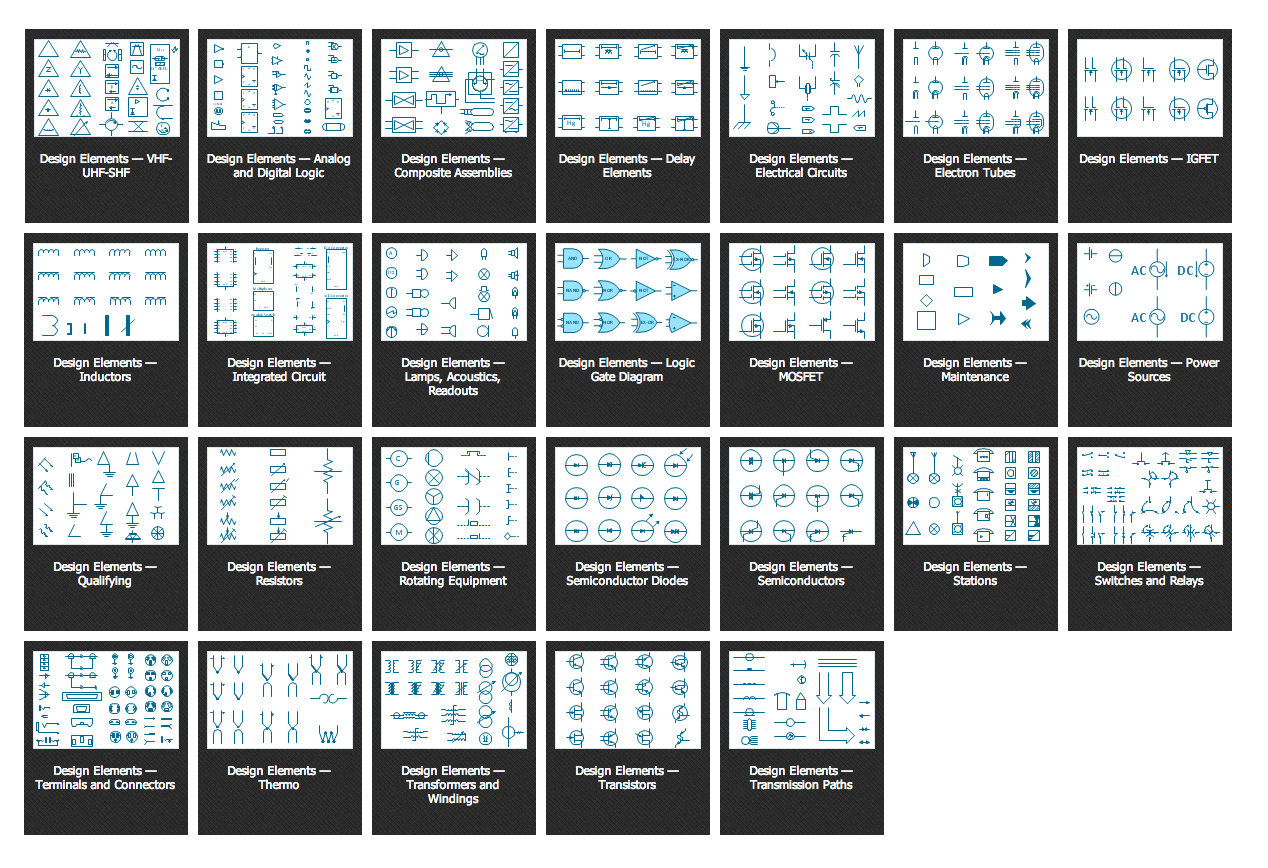
Picture: Electrical Symbols, Electrical Schematic Symbols
Related Solution:
Designing landscapes nowadays doesn’t require any special skills. Therefore, it’s not rocket science how to use landscape design software and create detailed plans and projects. Special Landscape & Garden Solution from the Building Plans area of ConceptDraw Solution Park provides vivid ready-to-use vector objects of trees, bushes, fences, furniture etc.
Picture: How To use Landscape Design Software
Related Solution:
Create maps, flags, and more with ConceptDraw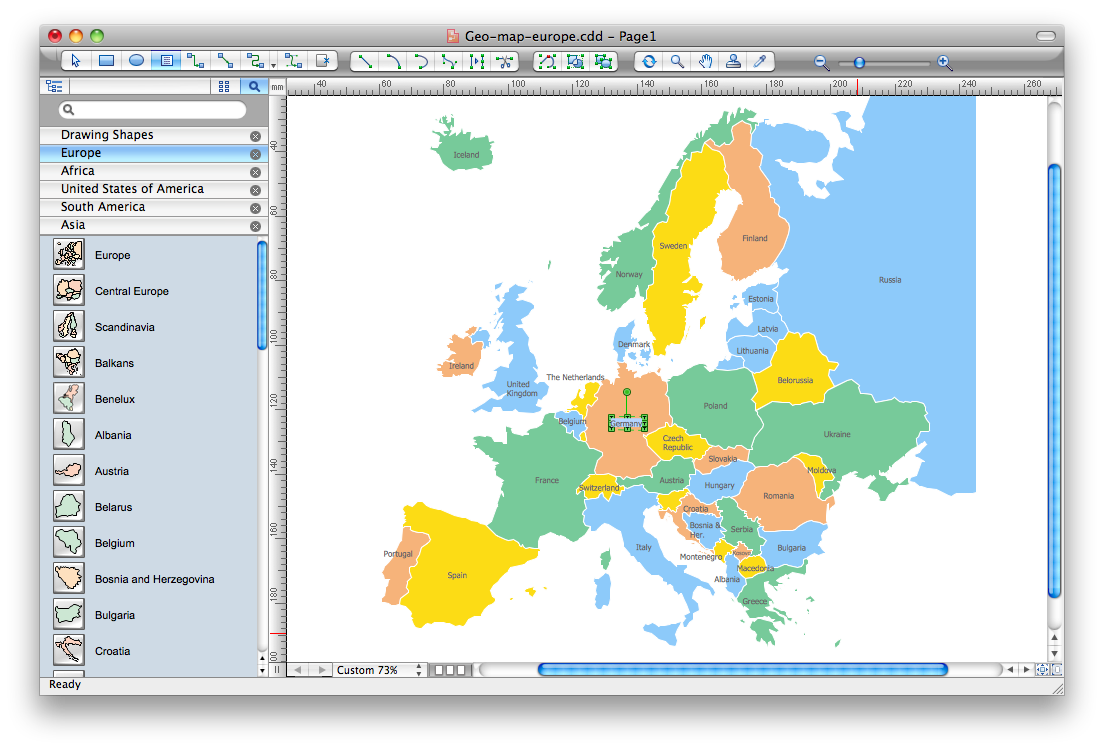
Picture: Map Software
Related Solution:
ConceptDraw DIAGRAM is the professional business graphic software for drawing diagrams and charts with great visual appeal on Mac OS X.
Picture: The Best Drawing Program for Mac
Related Solution:
ConceptDraw DIAGRAM provides the Plant Layout Plans solution from the Building Plans Area of ConceptDraw Solution Park to develop: Plant layouts for production, Storage, Distribution, Transport, Shipping, Receiving of manufactured goods.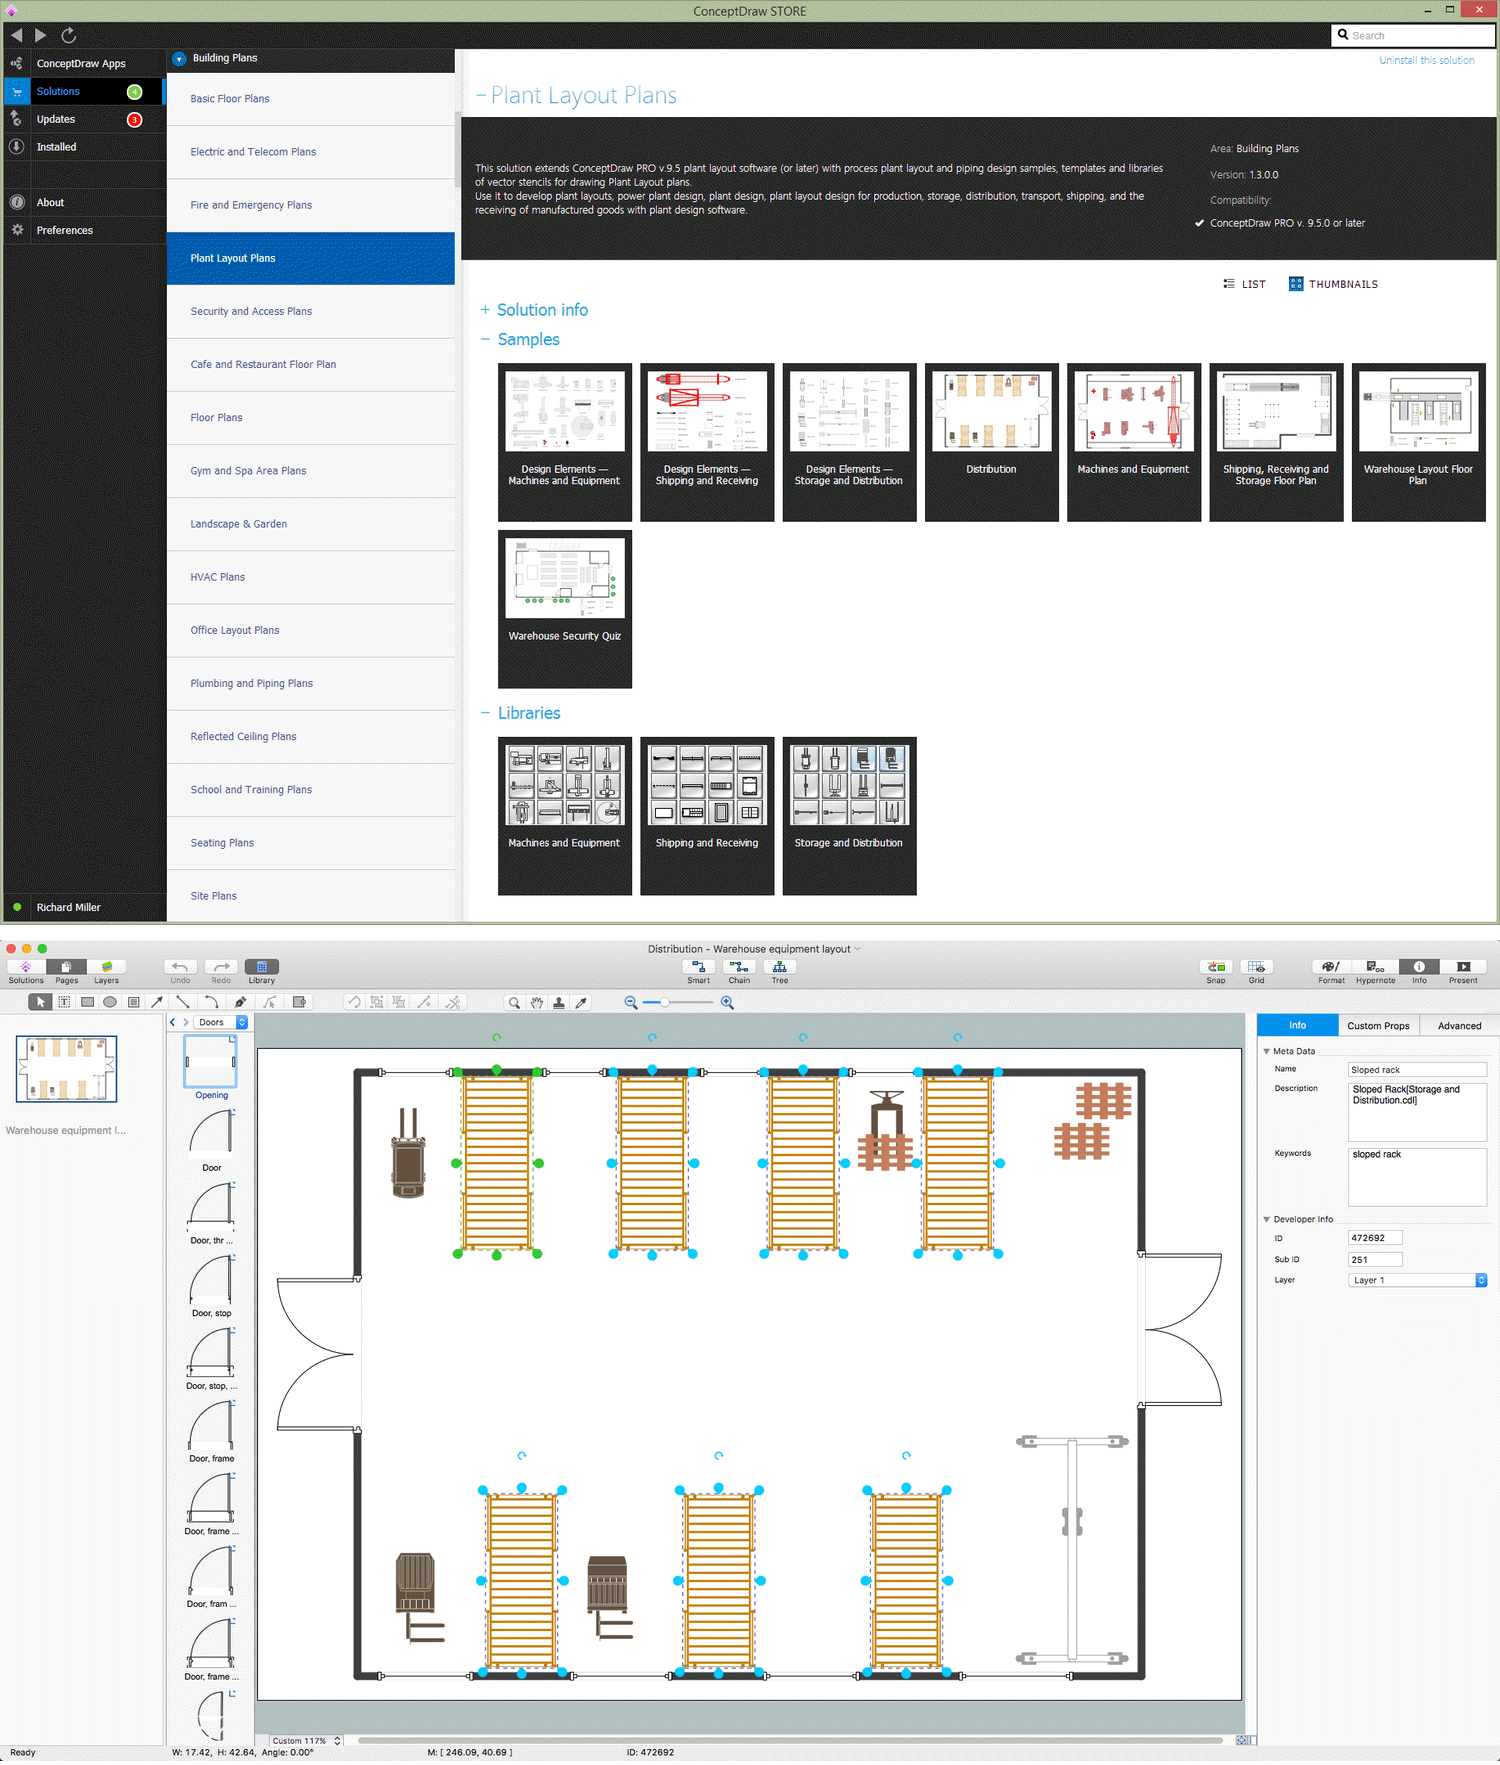
Picture: Storage Design Software
Related Solution:
In the course of recent decades data visualization went through significant development and has become an indispensable tool of journalism, business intelligence and science. The way visual information may be conveyed is not limited simply to static or dynamic representation, it can also be interactive. Infographics can be conditionally divided into several general levels. Primarily, this is level of visualization of information, its interpretation and association on any ground. Second level can be defined as a visualization of knowledge, depiction of thoughts and ideas in the form of images or diagrams. Finally, the level of data visualization, which processes data arrays in charts, enabling the information to be more clearly perceived. You can also identify the main approaches to the creation of infographics: exploratory and narrative. Exploratory method insists on minimalist design in favor of data precision without unnecessary details and is common for scientific researches and ana
Picture: Design Pictorial Infographics. Design Infographics
Related Solution:
You need visually represent the Maps Driving Directions? Now it's incredibly easy to do this in ConceptDraw DIAGRAM diagramming and vector drawing software which was supplied with unique Directional Maps Solution from the Maps Area.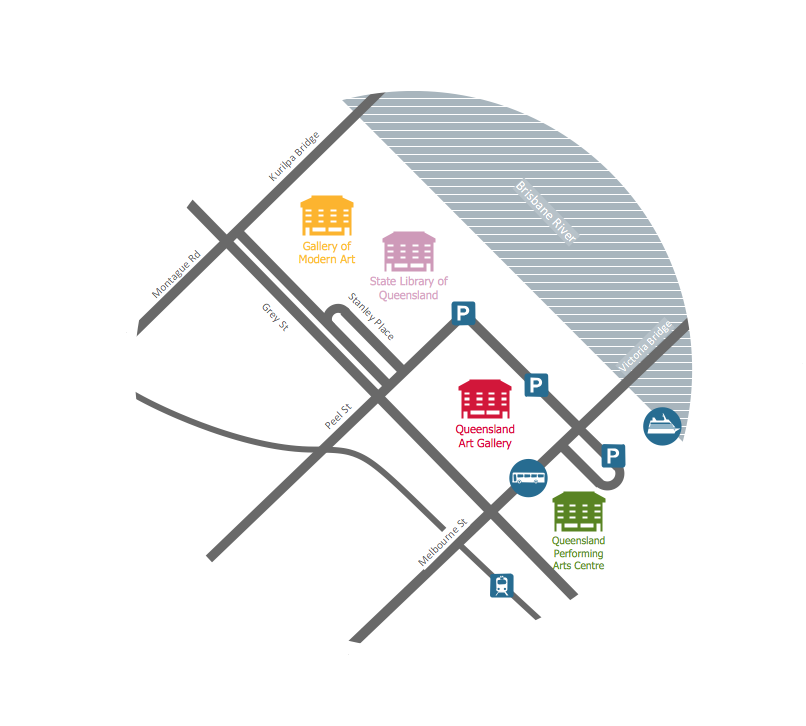
Picture: Maps Driving Directions
Related Solution:

