Tools to Create Your Own Infographics
Infographics
There are two systems that determine the way a person processes information: subconscious and conscious. Subconsious system operates continuously and requires no human intervention, while conscious functions require direct participation. For example, if a person sees a picture, which will depicts someone happy, this person will need a very little time and almost no effort to understand that. That is an example of subliminal perception system. In the next place, if a person sees an image of any logical equation, then he would need some efforts to solve it, which is an example of a conscious system work. Based on this, the main task of data visualization is in presenting the information in a way that the greater part of it would be perceived subconsciously. To achieve such efficiency, one should try to encode data in different visual attributes such as color, shape, size and various shapes as much as possible. It is very important to understand the information that requires visualization. A designer can create a creative and vibrant bar graph or chart that will be meaningless if he does not understand the essence of what he needs to show. Data visualization is used to display a particular information, or to emphasize something. So, in the first place, it is important to analyze the data, and only then to use the illustration tools. There are several common data visual encodings with varying accuracy of comparison. Thus, line and bar charts, for example, are considered the most accurate and color differentiation and pie charts provide a lower level of comparison accuracy.
ConceptDraw DIAGRAMis a software for create your own infographics with more than 10 library objects that scalable vector images. The Spatial Infographics solution is an additional libraries of vector graphic stencils for drawing simple infographical presentation of numerical data. ConceptDraw DIAGRAM allows you to focus on work, not the drawing process.

Sample 1. Europe map - Spatial infographics template.
Solution Spatial Infographics from ConceptDraw Solution Park extends ConceptDraw DIAGRAM ector diagramming and business graphics software with easy-to-use spatial infographics drawing tools.
This solution contains spatial infographics samples, map templates to be filled in, and libraries of vector stencils for main design elements of spatial infographics.
Use this solution to draw your own geospatial infographics documents with thematic maps, road maps, directional maps and transport maps.
TEN RELATED HOW TO's:
When deciding to start your own business, you have to take into account a bunch of different aspects. One of the ways to get inspired is to look through various restaurant floor plans samples or interior photos of already known establishments. This will help you, but keep in mind that a really unforgettable establishment must be unique.
This restaurant floor plan diagram was designed using ConceptDraw Cafe and Restaurant Floor Plan solution. It can be used as a sample while considering a custom restaurant design. With the help of this example you can estimate the amount of furniture best for a dining room or kitchen of the restaurant. In addition, this plan would be useful as a check list when you will consider a list of the furniture and equipment needed for all areas of the future restaurant.
Picture: Restaurant Floor Plans Samples
Related Solution:
Website wireframes are convenient and widely used by developers, visual designers, business analysts, and many other people related with projection, development and promotion websites. Usually website wireframes look lacking of brilliance, but they effectively reflect website functionality, content and visually represent its skeletal framework.
ConceptDraw DIAGRAM software offers a unique Website Wireframe solution from the Software Development area with all needed tools for fast and easy drawing professional looking website wireframe with attractive interface design.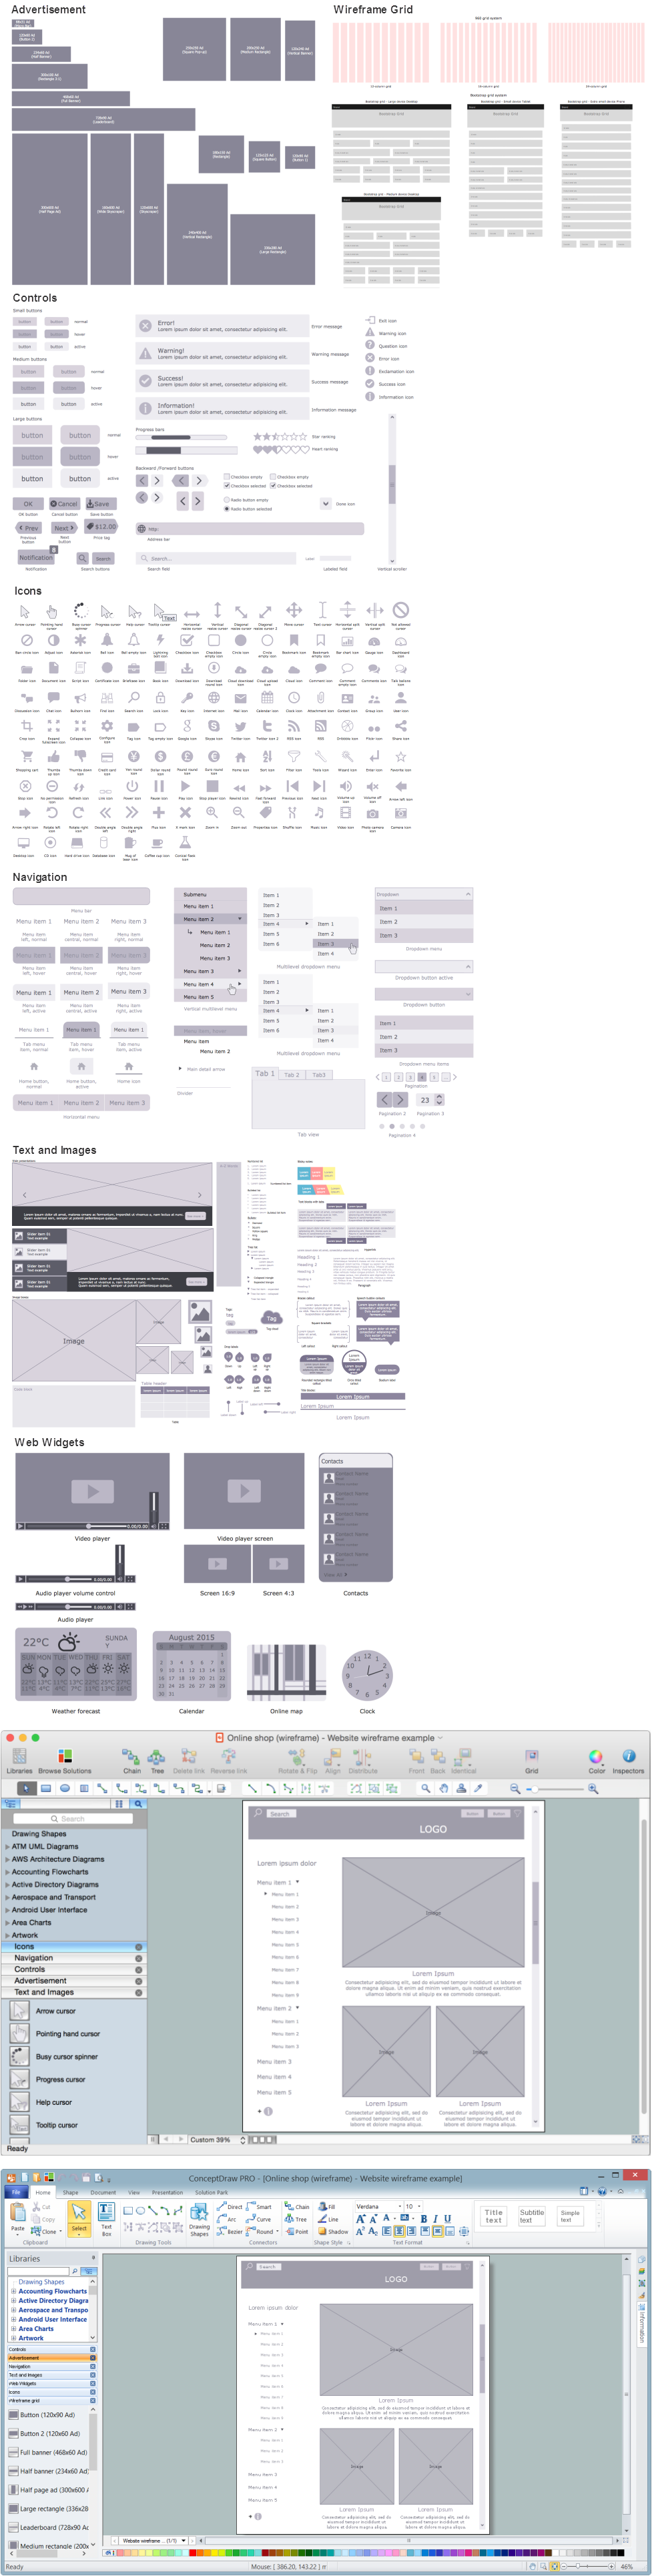
Picture: Interface Design
Related Solution:
The excellent possibility to create attractive Cross Functional Flowcharts for step-by-step visualization the operations of a business process flow of any degree of detailing is offered by ConceptDraw’s Cross-Functional Flowcharts solution. The extensive selection of commonly used vector cross functional flowchart symbols allow you to demonstrate the document flow in organization, to represent each team member’s responsibilities and how processes get shared or transferred between different teams and departments.
Picture: Cross Functional Flowchart Symbols
Related Solution:
The term “cloud” is very popular and widely used now, it is a server, data processing centre, or a network which lets to store the data and software, provides access to them, allows to run applications without installation and gives the possibility to process data hosted remotely via the Internet connection.
For documenting the Cloud Computing Architecture with a goal to facilitate the communication between stakeholders are successfully used the Cloud Computing Architecture diagrams. It is convenient and easy to draw various Cloud Computing Architecture diagrams in ConceptDraw DIAGRAM software with help of tools of the Cloud Computing Diagrams Solution from the Computer and Networks Area of ConceptDraw Solution Park.
Picture: How to Build Cloud Computing DiagramPrincipal Cloud Manufacturing
Related Solution:
Samples, templates and libraries contain vector clip art for drawing the Aerospace Illustrations.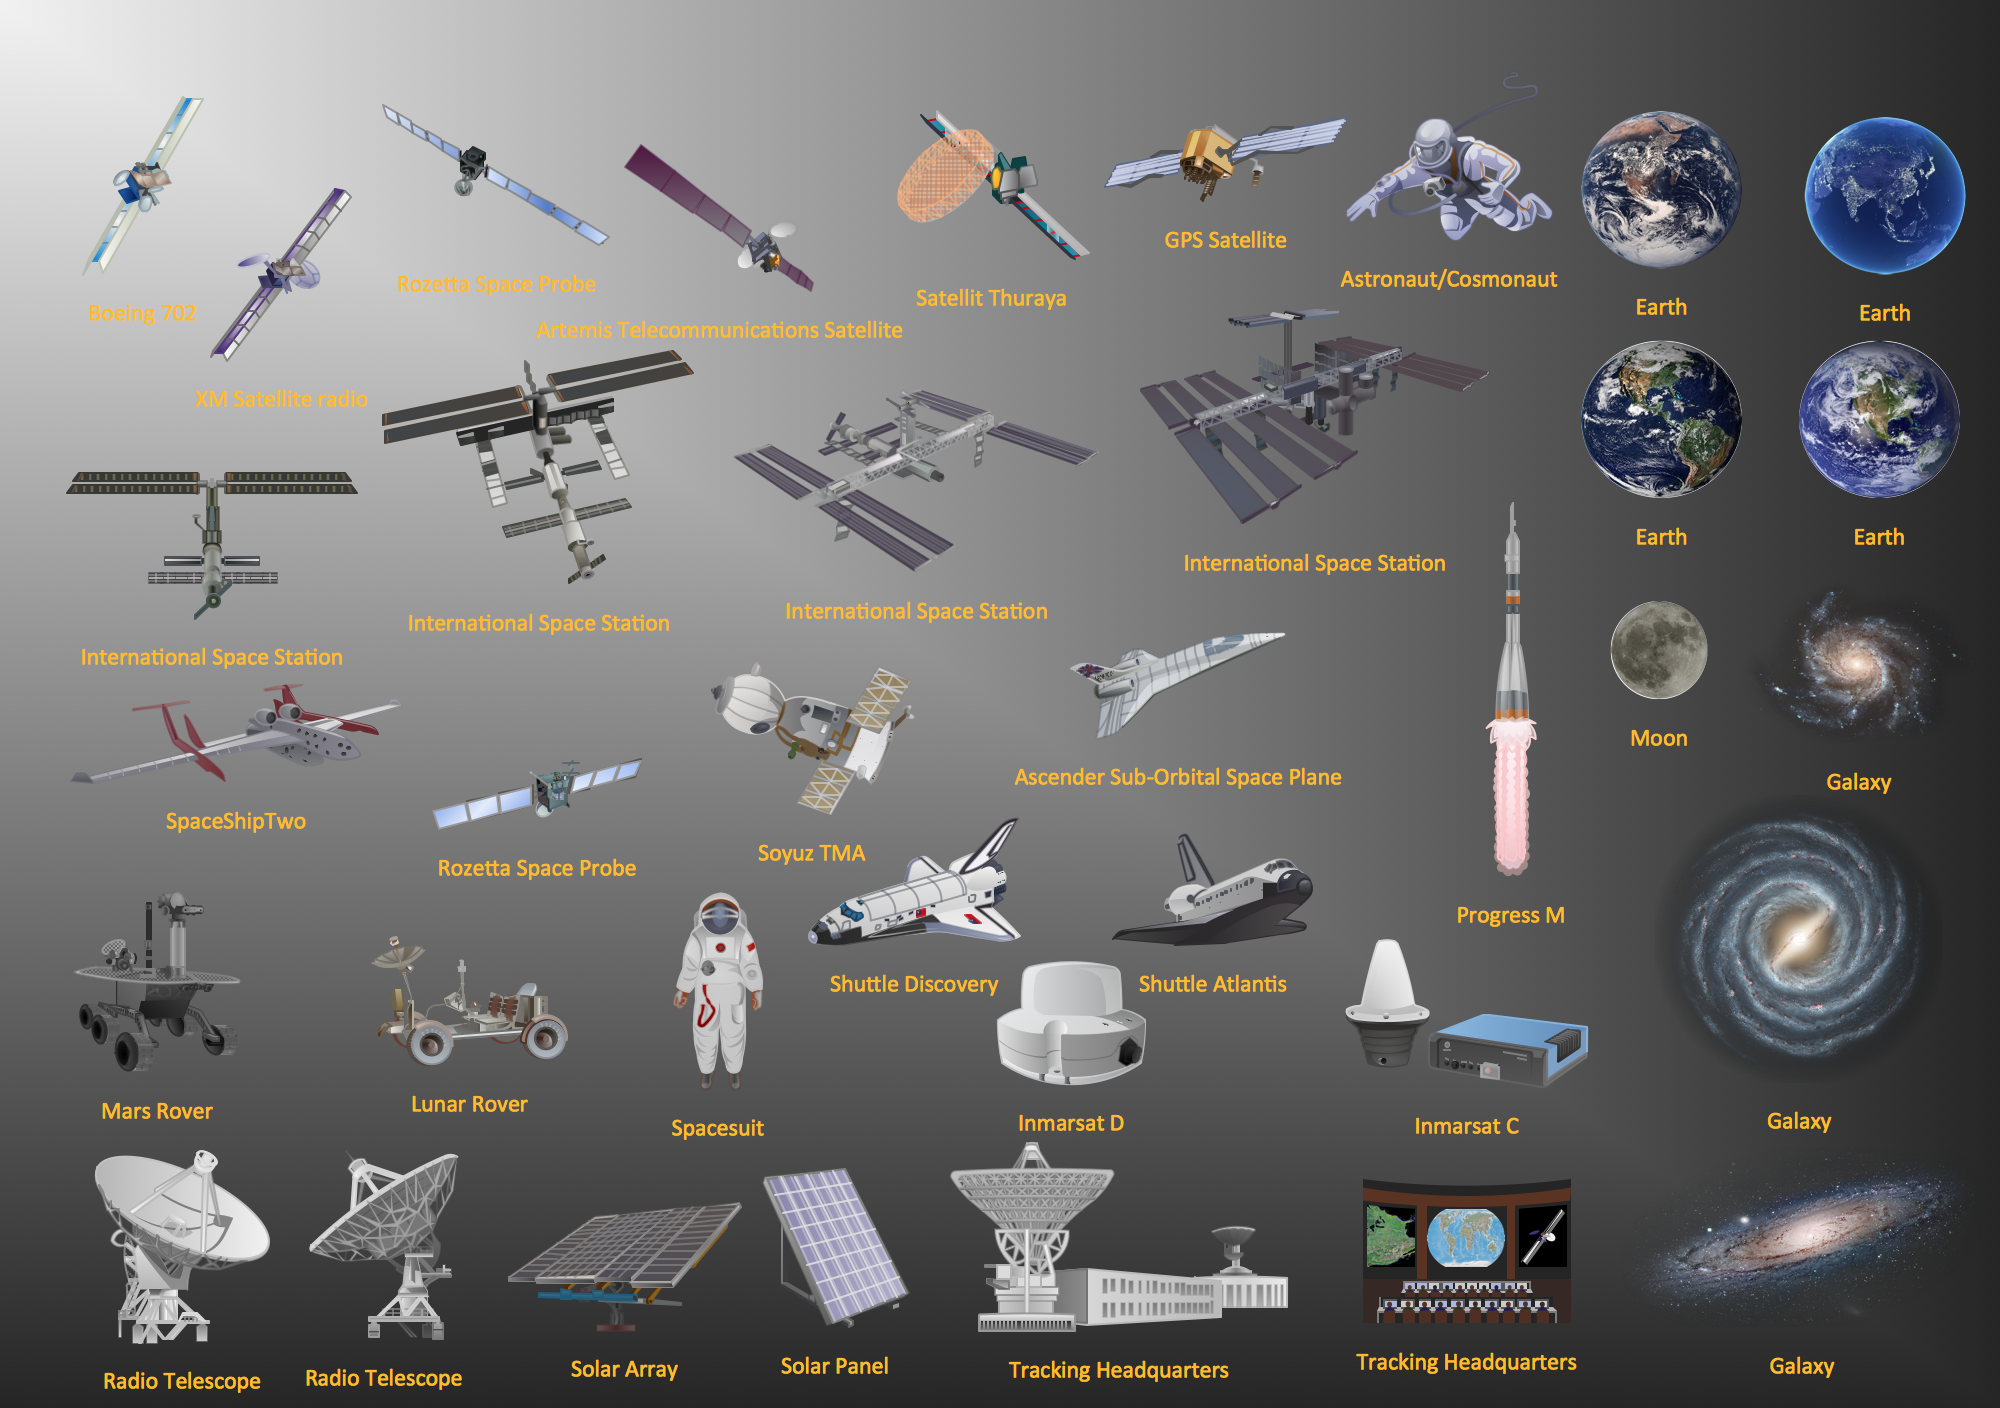
Picture: Aerospace - Design Elements
Related Solution:
The Stakeholder Onion Diagram is a popular and widely used way to view the relationships of stakeholders to a project goal. The Onion Diagram focuses on the project goal, most of other diagram styles focus on the project, stakeholders, and timeline. This difference favorably distinguishes and separates the Onion Diagram from other types of diagrams.
Design fast and easy Stakeholder Onion Diagrams of any complexity in ConceptDraw DIAGRAM diagramming and vector drawing software using the powerful tools of Stakeholder Onion Diagrams Solution from the Management Area of ConceptDraw Solution Park.
Picture: Stakeholder Onion Diagrams
Related Solution:
The AWS diagrams are convenient way for explaining the work of Amazon Web Services. ConceptDraw DIAGRAM diagramming and vector drawing software offers the AWS Architecture Diagrams Solution from the Computer and Networks Area for fast and easy creating the AWS diagrams of any complexity.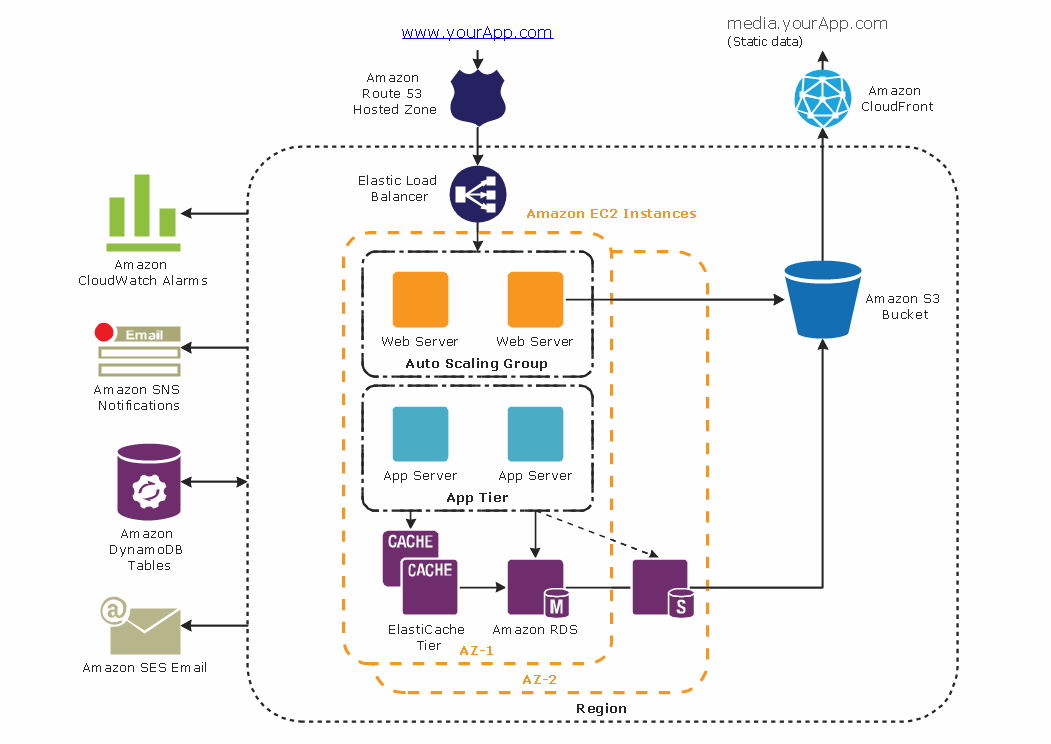
Picture: AWS
Related Solution:
ConceptDraw DIAGRAM drawing software offers the best infographic tools - Data-driven Infographics Solution.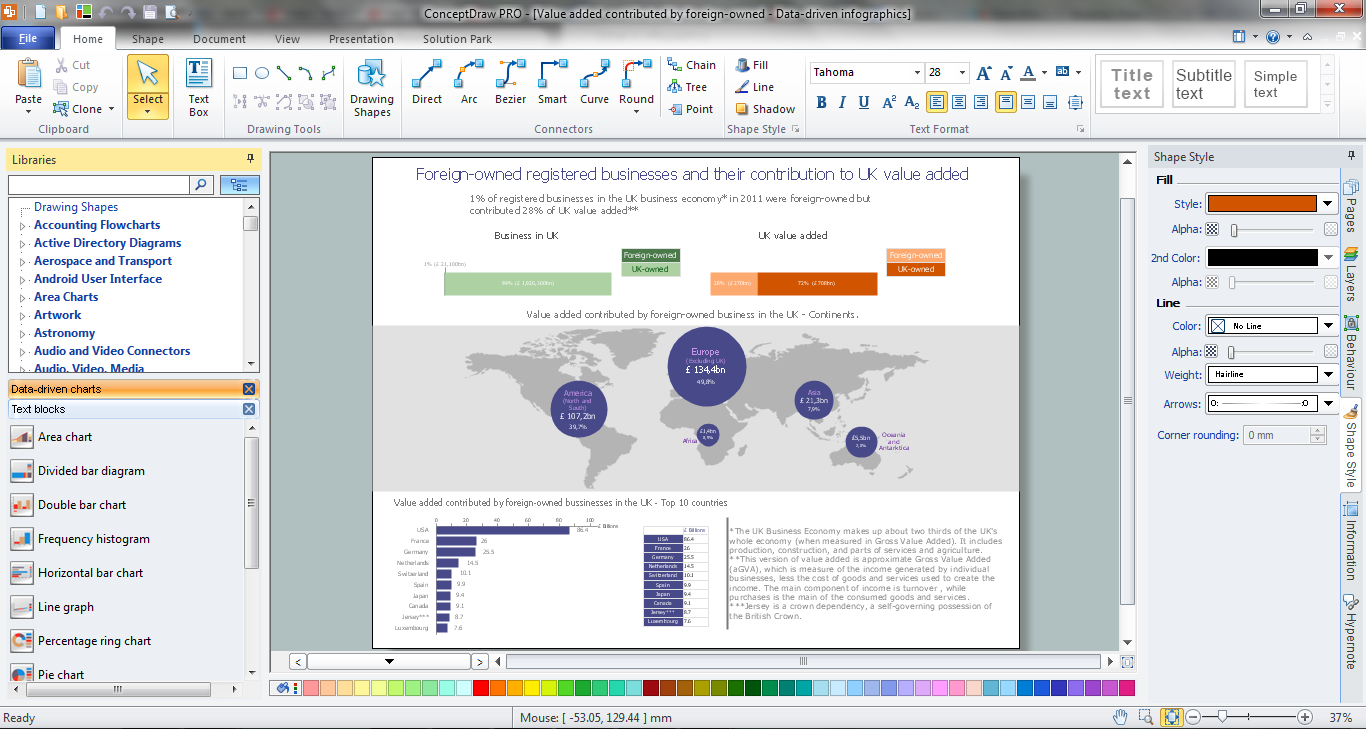
Picture: Infographic Tools
Related Solution:
If you are just a beginner in drawing flowcharts, it may seem that a sheet of paper and a pen are just enough. However, at the time you would want to share your results, diagramming applications would suite you better. it’s very easy to create diagrams that way and to discover new kinds of flowcharts.
The huge collection of sample ConceptDraw diagrams, charts, illustrations and other types of business drawings includes a wide range of business themes. A huge number of graphic images of ConceptDraw documents is divides on business application areas according to business-oriented solutions for which they were made.Here is a short visual list of samples of flowcharts, process diagrams, UML models, management charts, computer network diagrams, maps, infographics, illustrations, etc. In short, each ConceptDraw solution is accompanied with at least ten samples representing some particular examples of the application of the given chart.
Picture: Applications
ConceptDraw DIAGRAM diagramming and vector drawing software extended with Physics solution from the Science and Education area is a powerful software for creating various physics diagrams.
Physics solution provides all tools that you can need for physics diagrams designing. It includes 3 libraries with predesigned vector physics symbols: Optics Library, Mechanics Library and Nuclear Physics Library.
Picture: Physics Symbols
Related Solution: