
Sample 1. SWOT analysis matrix diagram - Design elements.
SWOT Analysis solution from ConceptDraw Solution Park extends ConceptDraw MINDMAP and ConceptDraw DIAGRAM software with easy-to-use SWOT Analysis tools for Mac and PC.
This solution contains SWOT and TOWS matrices and mind map templates to be filled in, that help identify Strengths, Weaknesses, Opportunities, and Threats.
See also:
Marketing — Matrices
- Marketing positioning matrix - Product positioning map
- Product-market matrix - Ansoff matrix
- BCG matrix - Boston growth-share matrix
- Feature comparison chart - Digital scouting cameras
- Marketing matrix diagram - Competitive strategies
- Marketing matrix diagram - Porters value chain
Marketing — Mind Maps
- Marketing mindmap - Marketing research project
- Marketing mind map - Strategic accomplishment mapping
- Twitter Compaign for New Software Product
- Marketing mind map - Sales Call
TEN RELATED HOW TO's:
Drawing an electric circuit plan with all the wiring might seem very complex. If you ever felt afraid to ask how to use electrical and telecom plan software, then it’s time to actually start from altering the templates from the Solution Park. You won’t even notice the moment when you would become an experienced user.
This electrical and telecommunication floor plan plan presents electrical and telecommunication devices located in a country house floor plan. Each electrical or telecom device on this plan is indicated with the particular symbol. Using standard Electrical and Telecommunication symbols makes this floor plan clear for anybody who will be involved into construction process. All the electrical and telecom symbols used in the current floor plan are placed to a legend. This electrical and telecom floor plan can be included as a separate piece into a package of building documentation.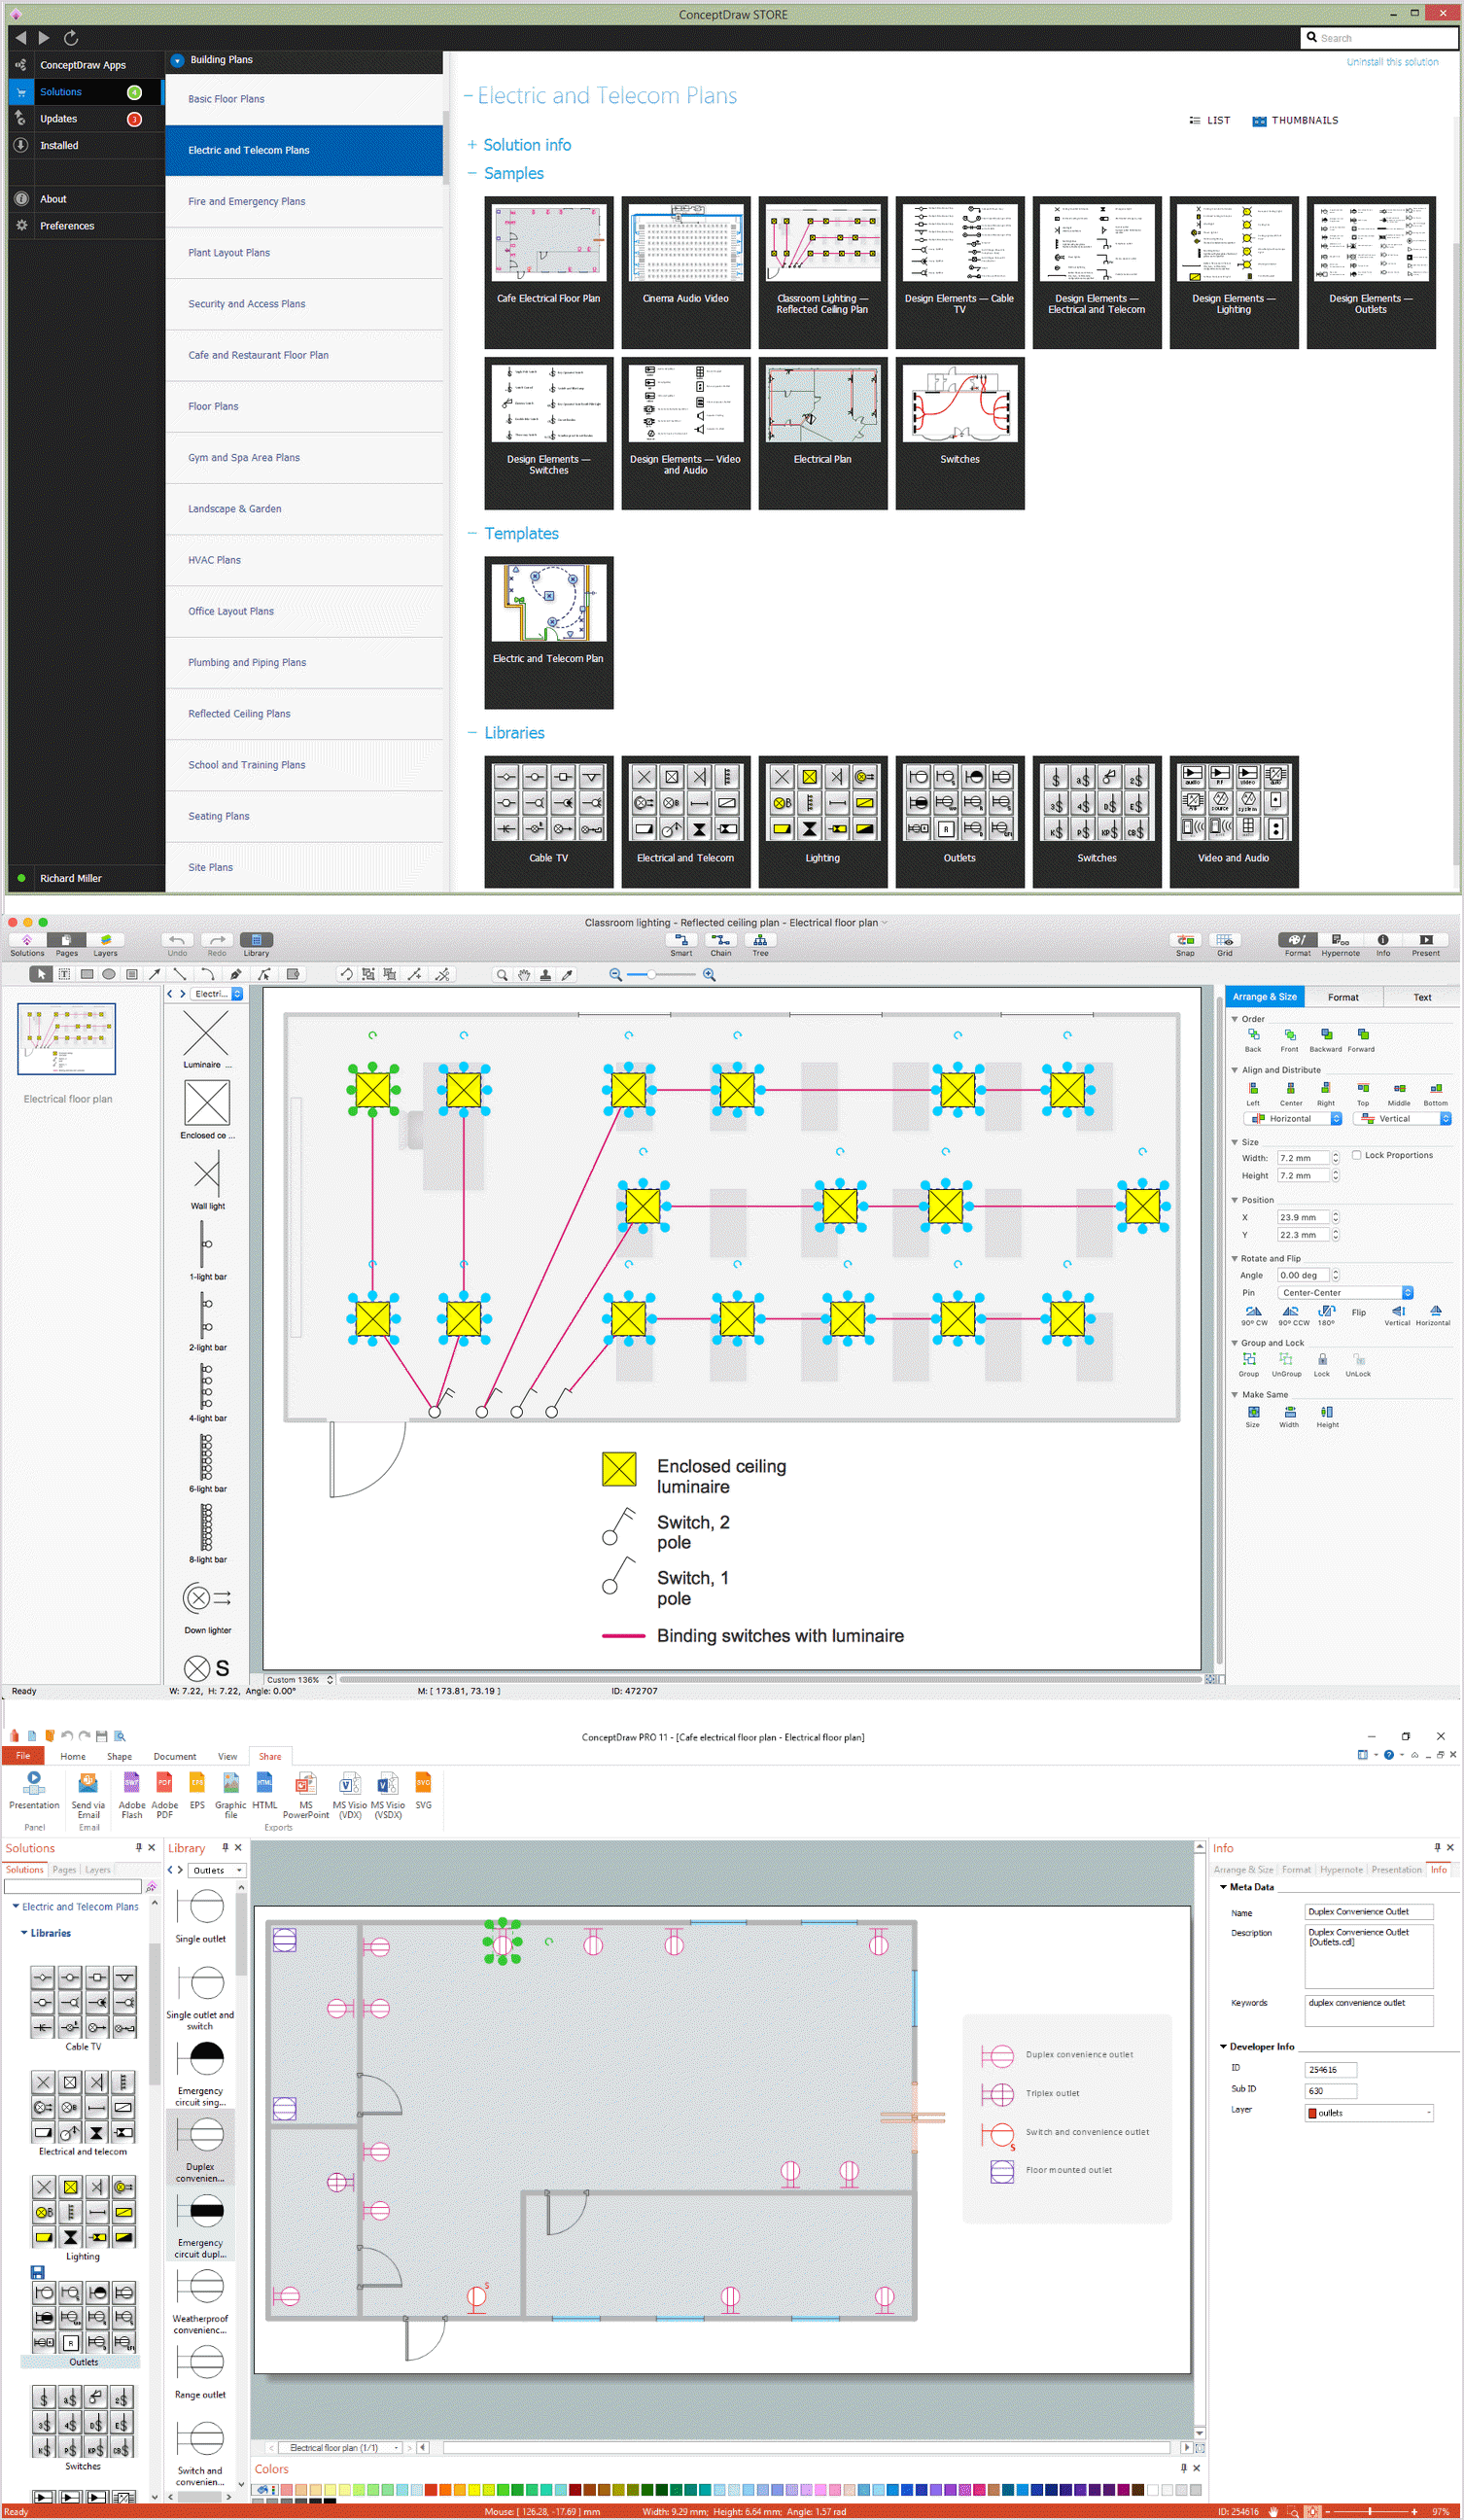
Picture: How To use Electrical and Telecom Plan Software
Related Solution:
ConceptDraw MINDMAP has impressive import and export capabilities includes following formats:
OPML
Mindjet™ MindManager™
Microsoft™ Office products:
PowerPoint™
Project™
Word™
FreeMind (import only)
XMind (import only)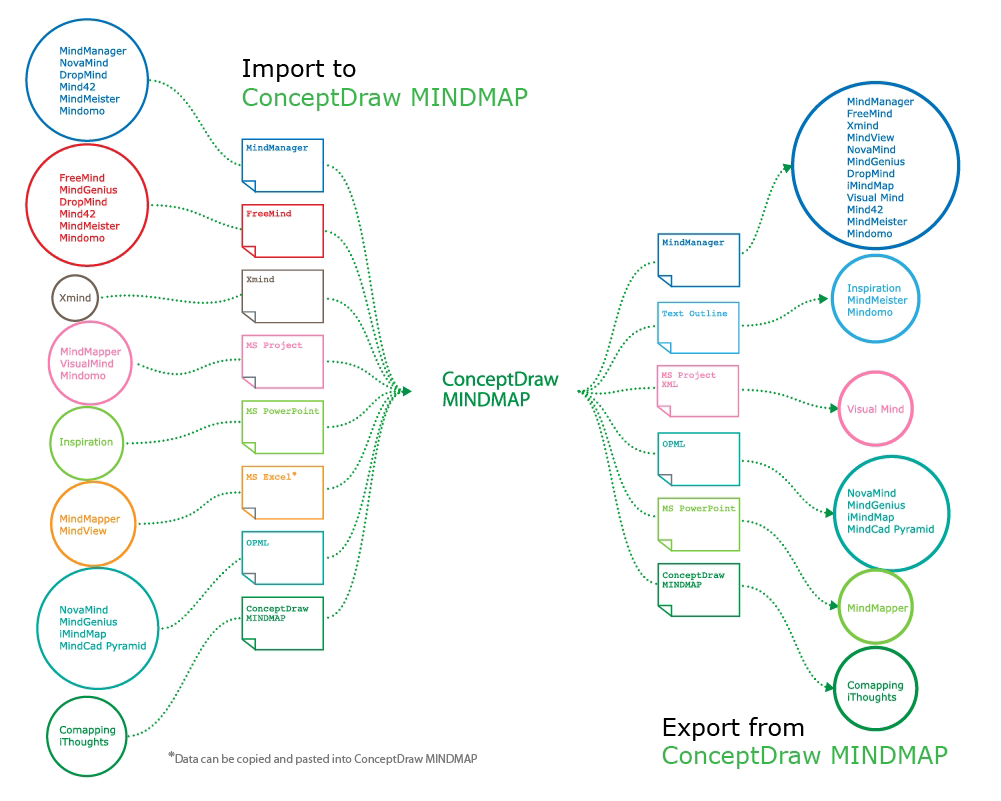
Picture: How to Exchange ConceptDraw MINDMAP Files with Mindjet MindManager
Related Solution:
SWOT Analysis solution extends ConceptDraw MINDMAP and ConceptDraw DIAGRAM products with easy-to-use SWOT Analysis tools.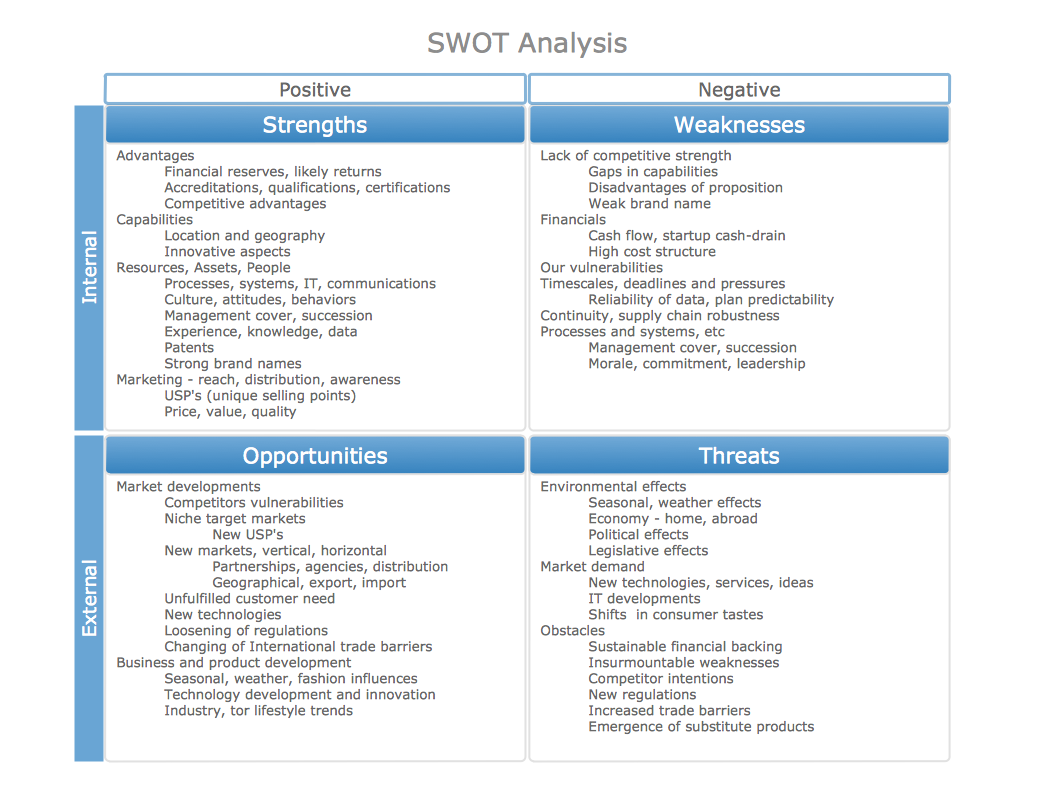
Picture: SWOT Analysis matrix templates and samples
Some organization hold offices for years and decades, or even build their own campuses. However, if it’s time for your organization to move to another building, drawing software for designing office layout plan would come in handy. With such software you can save a lot of time and create a new layout or try to save old layout in a new building.
This office layout plan is an example of a typical office furniture and equipment arrangement. This drawing provides a graphic view of the office area and its facilities including furniture and office equipment. It can be used as template which represent, desks, files, and other pieces of equipment that can be re-arranged according the certain requirements to office space and facilities. The vector graphic objects that represent various office layout elements such as special office furniture and equipment can help you to shape a number of creative ideas and develop your office layout plan.
Picture: Building Drawing Software for Design Office Layout Plan
Related Solution:
UML state machine's goal is to overcome the main limitations of traditional finite-state machines while retaining their main benefits.
ConceptDraw has 393 vector stencils in the 13 libraries that helps you to start using software for designing your own UML Diagrams. You can use the appropriate stencils of UML notation from UML State Machine library.
Picture: UML State Machine Diagram.Design Elements
Related Solution:
Diagrams are a very important part of modern life. With the help of flow diagram software, a lot of companies can promote their ideas at the market. Its usefulness is totally doubtless.
This is a flow chart of the invoice payment flow. This flowchart details decrypts all stages of the process of obtaining and paying bills. It is a description of the universal process - such steps performs accounting departments of almost any organization. Since every business no matter what it does is a consumer of some goods or services. The given flow chart was made using ConceptDraw DIAGRAM software and the Diagrams solution for making flowcharts of any kind.
Picture: Flow Diagram Software
Related Solution:
It’s not easy to plan all the details of your landscape at once. Therefore, you can use a bubble diagram to create a draft of the future project. You can develop any bubble diagrams and use them in your landscape design project with ConceptDraw DIAGRAM and it’s predesigned templates.
This bubble diagram can be applied while initiating the development of garden and landscape design. The bubble diagrams used for this purpose are different from the classic bubble diagrams. Being used in landscape and garden design, they obtain the quite another understanding. Bubbles in this diagram visualize some captured areas, which define the general spaces of a future garden: lawn, flower garden, pool, built-up area, lighting, etc. The bubble diagram represents the landscape project without any special expenses on its creation. It is better to make such simple sketch before you drill down into detailed project and cost estimates.
Picture: Bubble diagrams in Landscape Design with ConceptDraw DIAGRAM
Analysis is very important part for every business, as it helps to understand the weakness and to see the opportunities, and SWOT is one of the most effective tools. To illustrate the multifunctionality of this tool, let’s imagine a SWOT sample in area of computers networking, which can be carried out to realize the pros and cons of some equipment, for example. Even a network topology or a administer can be a subject for this analysis.
This SWOT analysis matrix illustrate the sample of using this useful technique for comprehension of Strengths and Weaknesses, and for determining the Opportunities open to business and the Threats it encounters. Used in a business scope, it will help to create a perspective niche in the market for particular business. The ConceptDraw SWOT and TOWS Analysis solution gives a lot of templates of both SWOT and TOWS matrices that allow managers and marketers create custom diagrams to perform SWOT or TOWS analysis in context of a particular business.
Picture: SWOT Sample in Computers
Collaboration Software helps to transform shared MINDMAP documents to build an effective team collaboration.
Picture: How To Use Collaboration Software
Related Solution:
While creating flowcharts and process flow diagrams, you should use special objects to define different statements, so anyone aware of flowcharts can get your scheme right. There is a short and an extended list of basic flowchart symbols and their meaning. Basic flowchart symbols include terminator objects, rectangles for describing steps of a process, diamonds representing appearing conditions and questions and parallelograms to show incoming data.
This diagram gives a general review of the standard symbols that are used when creating flowcharts and process flow diagrams. The practice of using a set of standard flowchart symbols was admitted in order to make flowcharts and other process flow diagrams created by any person properly understandable by other people. The flowchart symbols depict different kinds of actions and phases in a process. The sequence of the actions, and the relationships between them are shown by special lines and arrows. There are a large number of flowchart symbols. Which of them can be used in the particular diagram depends on its type. For instance, some symbols used in data flow diagrams usually are not used in the process flowcharts. Business process system use exactly these flowchart symbols.
Picture: Flowchart Symbols: Meaning and Examples
Related Solution: