Export from ConceptDraw MINDMAP to Apple iCal
|
ConceptDraw MINDMAP Mac OS X version enables you to export your mind map into the iCal calendar and generate tasks from mind map topics. You can export tasks to an existing calendar, overwrite existing calendars, or add new tasks to them.
Pic. 1. ConceptDraw MINDMAP example — Weekend to-do list. |

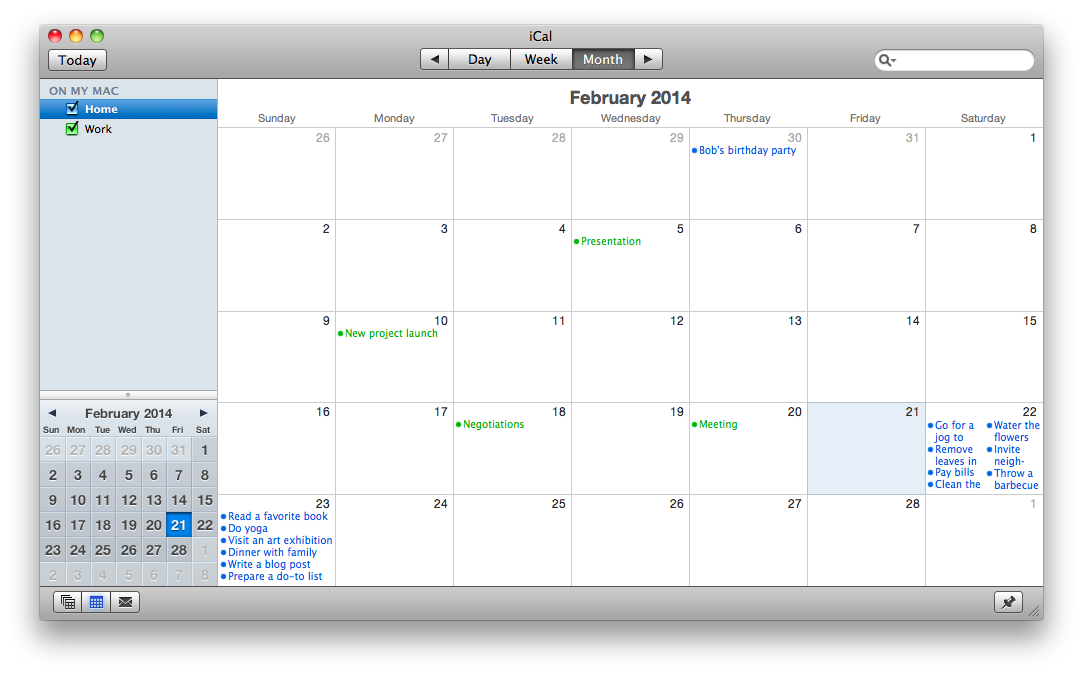
Pic. 2. Apple iCal with tasks exported from ConceptDraw MINDMAP topics.
With ConceptDraw MINDMAP Mac OS X version your activities can be planned quickly and easily.
See also Samples of mind maps:
- Mind Maps
- Mind Maps — Marketing
- Mind Maps — Idea Communication
- Mind Maps — Mind Map Exchange
-
Mind Maps — Presentation Exchange
TEN RELATED HOW TO's:It is impossible to imagine mechanical engineering without drawings which represent various mechanical schemes and designs. ConceptDraw DIAGRAM diagramming and vector drawing software supplied with Mechanical Engineering solution from the Engineering area of ConceptDraw Solution Park offers the set of useful tools which make it a powerful Mechanical Drawing Software. Picture: Mechanical Drawing SoftwareRelated Solution:Every company meets some risks during project life cycle. It’s easy to face them using such tools as SWOT analysis matrix diagram that depicts Strengths, Weaknesses, Opportunities and Threats of any proposed subject. ConceptDraw Solution Park contains excellent templates of of SWOT and TOWS matrices. Making SWOT matrix is frequently used in practical marketing. It is the valuable tool of marketing strategy development. SWOT matrix allows to define the strengths and weaknesses of the organization, possible outside threats and opportunities and evaluate the current strategic competitors. Using ConceptDraw SWOT and TOWS Matrix Diagrams solution you can perform SWOT analysis. You can create a SWOT matrix in and then compare the strengths and weaknesses of your organization and the opportunities and threats of market. The well-performed SWOT-analysis allows you define the steps that can be taken for the improvement of your company market position and determine and problems that need to be solve urgently.
 Picture: SWOT analysis matrix diagram templatesHow to do Skype Presentation. Solution for ConceptDraw Mindmap
 Picture: Skype PresentationRelated Solution:If you have doubts about some situation, there are tools that might help you. First used in the Stanford Research Institute in the 60s, SWOT analysis is a great solution and if you need to build a strategy, this tool is very effective. As a result, you will get the clear idea of all the opportunities and threats you might face. This matrix was build for a TOWS analysis performance. A TOWS analysis includes the same process of listing strengths, weaknesses, opportunities and threats as a SWOT analysis. But, unlike SWOT, TOWS analysis primarily takes into account threats and opportunities and then at least - weaknesses and strengths. This is also a is a strategic planning tool. Beyond making a matrix, the strategy manager should investigate ways the organization can take edge of opportunities and reduce threats by turning to advantage strengths and weaknesses. Making SWOT and TOWS analysis uses the same approach and outputs close results. ConceptDraw SWOT and TOWS Matrix Diagrams solution supplies templates of matrices, that help to list clearly the constituents of SWOT and TOWS analysis.
 Picture: SWOT Analysis Solution - Strategy ToolsConceptDraw PROJECT is simple project management software for planning projects, it include tools for planning project objectives. This type of project planning software intended for professional who use project terms daily. CoonceptDraw PROJECT can be used as customer project management software to keep on track on-site operations. It often used for planning marketing activity as marketing project management software, also it used as simple project management software for software development projects.
 Picture: ConceptDraw PROJECT Project Management Software ToolConceptDraw DIAGRAM software extended with Fishbone Diagrams solution from the Management area of ConceptDraw Solution Park is perfect for Cause and Effect Diagram creating. It gives the ability to draw fishbone diagram that identifies many possible causes for an effect or a problem. Causes and Effects are usually grouped into major categories to identify these sources of variation. Causes and Effects in the diagram show relationships among various factor. Fishbone diagram shows factors of Equipment, Process, People, Materials, Environment and Management, all affecting the overall problem.
 Picture: Cause and Effect DiagramRelated Solution:This method of problem analysis is widely used in IT, manufacture industries and chemical engineering. If you want to take a fresh look on your problem, you can draw a fishbone diagram with ConceptDraw DIAGRAM software, which supports both MAC OS and Windows. You can see and download fishbone diagram samples and templates in ConceptDraw Solution Park. This Fishbone (Ishikawa) diagram can be applied as template for performing the cause and effect analysis of a service industry problems. It can help to determine factors causing problems. Causes in this diagram are categorized according to the 4S’s principle that means Surroundings, Suppliers, Systems and Skills. Grouping causes allows to reveal main interactions between different events. This diagram was made using ConceptDraw Fishbone diagrams solution. It can help to reveal the causes effected a complicated issue. Of course it can be used together with other methods of approaching to the problem solving.
 Picture: Draw Fishbone Diagram on MAC SoftwareRelated Solution:SWOT analysis is an effective method of business planning, the question is how to do it. The most obvious way is to make a SWOT analysis in a Word document, which is not very convenient. Luckily, you can use software like ConceptDraw DIAGRAM that has features and templates made especially for SWOT analyzing. A SWOT Analysis is a manager's means of the strategic planning. It is used to define and classify considerable internal moments (strengths and weaknesses) and external forces (opportunities and threats) a business faces. You can use ConceptDraw MINDMAP to determine and organize factors utilized for SWOT analysis, and represent them in the SWOT matrix using ConceptDraw DIAGRAM. Using mind maps empowers you to explore and rank a lot of data engaged for SWOT analysis as well as recognize the relations between various pieces of information.
 Picture: How to Make SWOT Analysis in a Word DocumentRelated Solution:These donut chart templates was designed using ConceptDraw DIAGRAM diagramming and vector drawing software extended with Pie Charts solution from Graphs and Charts area of ConceptDraw Solution Park. All these donut chart templates are included in the Pie Charts solution. You can quickly rework these examples into your own charts by simply changing displayed data, title and legend texts.
 Picture: Donut Chart TemplatesRelated Solution:Below you can see the symbol for pool table. You can find this symbol in the library of the Floor Plans Solution and use it in your floor plan of the sport complex, home, etc. ConceptDraw DIAGRAM is a powerful diagramming and vector drawing software for creating the different Floor Plans. It’s very convenient, simple and quick to design the professional looking Floor Plans of any difficulty in ConceptDraw DIAGRAM.
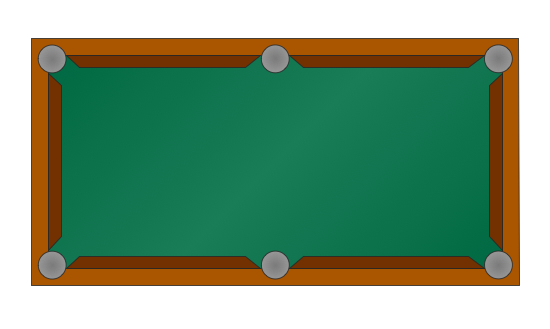 Picture: Symbol for Pool Table for Floor PlansRelated Solution:ConceptDrawMINDMAP 16