Made with
ConceptDraw
PROJECT 15

ConceptDraw PROJECT
Project Management Software Tool

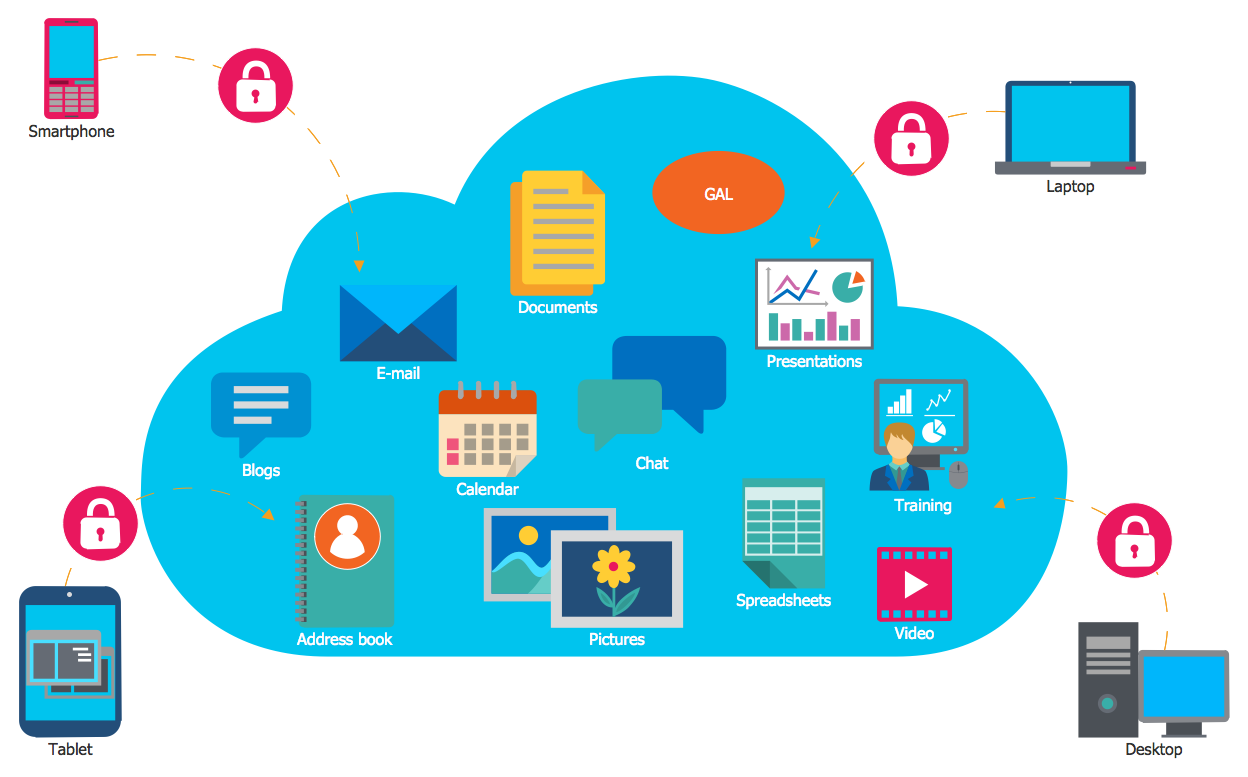
Project management software tool allows to organize and manage projects more effectively. is simple project management software for planning project tasks along with project objectives. This flexible tool can be used as your customer project management software or marketing project management software, also it used as simple project management software for software development projects.
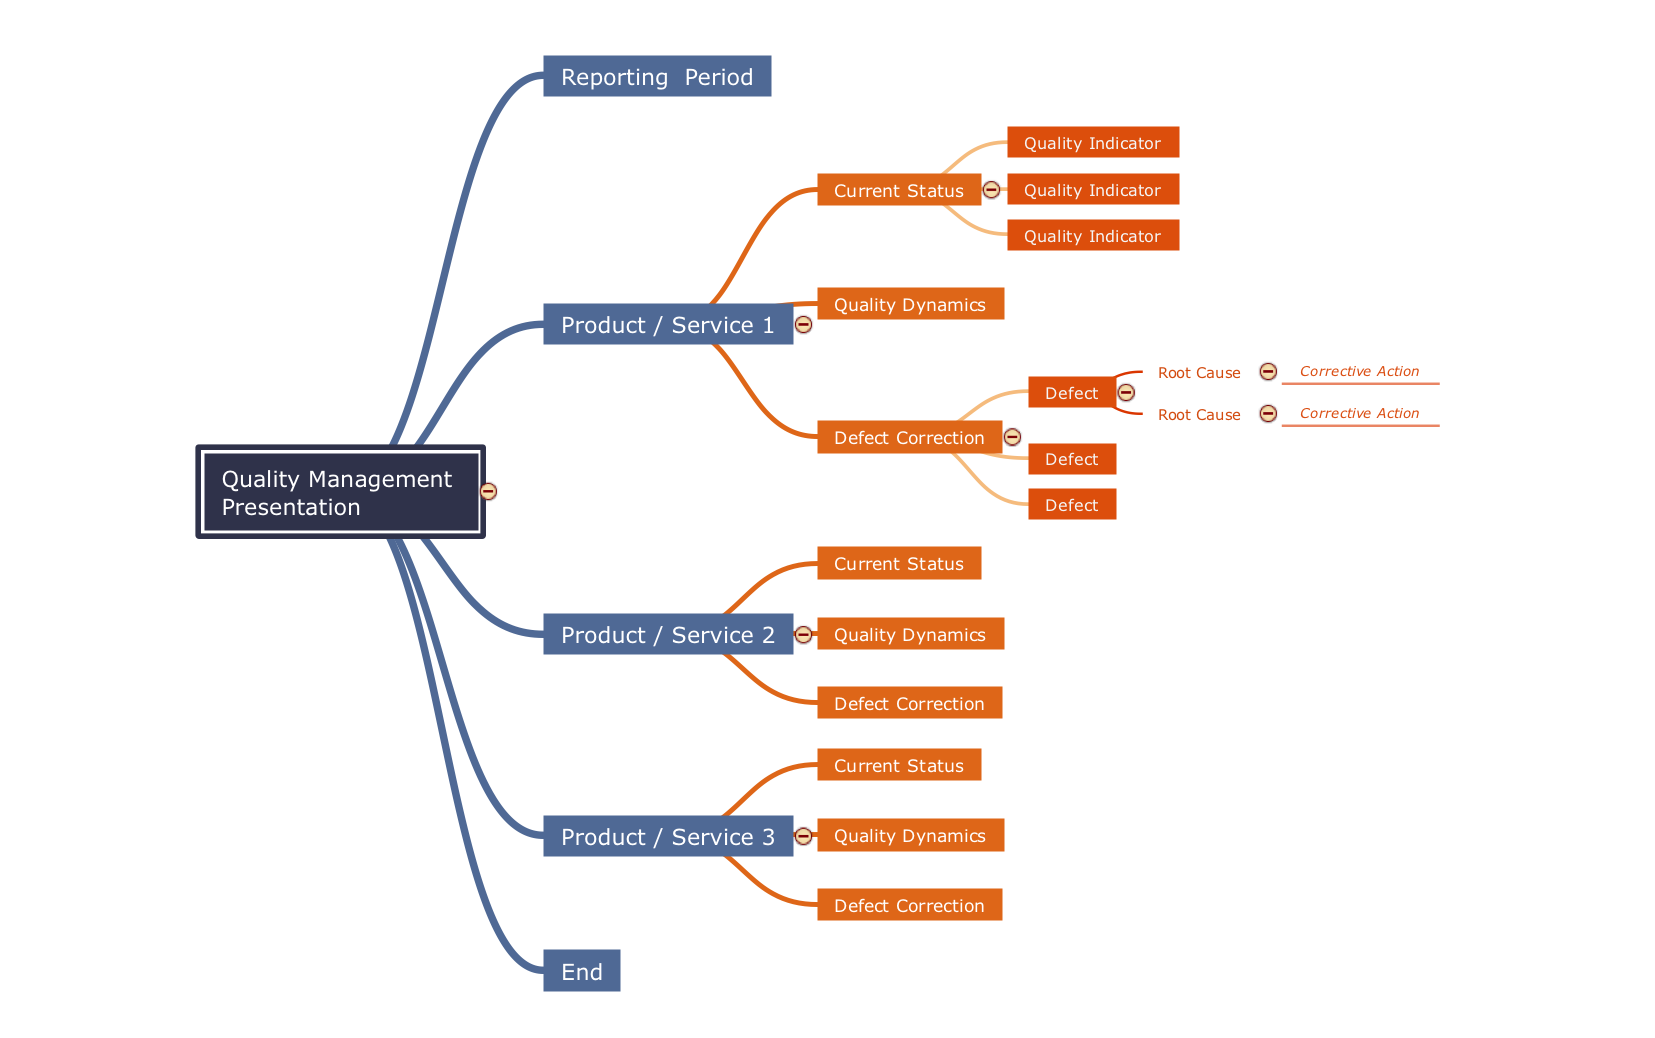
project management tool. Example of Gantt Chart in project management tool
Gantt Chart
in project management tool

Project management tool. Main views:

  • Gantt charts
  • Resource list
  • Projects view
  • MindMaps

When do you need Project management Tool?

If you are on the fast track in your career and start facing such challenges as coordination many people, coordination tasks and works, manage project with a great deal of time and money involved - it is the right time to get Project management tool involved in your work.

Why is it worth investing in Project management tool?

  • With Project management tool you can work more effectively!
  • With Project management tool you can coordinate and manage projects more efficiency!
  • With Project management tool you can save time and money!
  • With Project management tool you can complete projects on time and on budget!
  • With Project management tool you can to get projects dome more quickly and intelligently.

Download FREE trial of Management tool now! Read more about management tool


Why from a wide range of project management tools it's better to choose management application?


Key Features of management tool:

  • Easily share your projects across Mac and Win with management tool
  • management tool allows to work with projects of any size and length
  • Make a quick HTML report with Wizard that is a part of Project management tool
  • Brainstorm and generate your projects from MINDMAP with Management tool
  • management tool allows to generate project status reports
  • management tool supports export/import to/from a number of formats e.g. Microsoft Project XML
  • management tool lets you publish your projects across the Web
  • Email your projects and project reports as PDF files.

No other project management tool gives you all these at such low price!

Download FREE trial of Management tool now! Read more about management tool

ConceptDraw PROJECT <br>Project Management Software Tool *


Gantt Chart : Gantt chart software : Gant Chart

TEN RELATED HOW TO's:
A team briefing tool is an excellent way to enable communication upwards, downwards and sideways throughout an organisation.How To Conduct Effective Team Briefings *
Picture: How To Conduct Effective Team Briefings
Related Solution:
The Audio & Video Connectors solution contains a set of pre-designed objects, libraries, templates, and samples; allowing quick and easy diagramming of various configurations of audio and video devices.Audio Visual Cables and Connectors *
Picture: Audio Visual Cables and Connectors
Related Solution:
The program (or project) evaluation and review technique, commonly abbreviated PERT, is a statistical tool, used in project management, which was designed to analyze and represent the tasks involved in completing a given project. ConceptDraw DIAGRAM diagramming and vector drawing software extended with Seven Management and Planning Tools Solution from the Management Area offers the extensive drawing tools for effective drawing the PERT Chart of any complexity.PERT Chart *
Picture: PERT Chart
Related Solution:
New way to present documents via Skype conference call on Mac. All participants receive files. Presentation can be created automatically from plenty document formats.How To Send Presentation via Skype (Mac OS X) *
Picture: How To Send Presentation via Skype (Mac OS X)
Related Solution:
When searching for a diagramming tool, we look for a powerful and reliable software that would be easy to use. To mention one, ConceptDraw DIAGRAM has all the necessary features to create cross-functional flowcharts (Swim Lanes) quick and effortlessly. You can draw swim lane diagrams in both vertical and horizontal ways. This cross-functional flowchart displays a payroll process. It explains to each participant his role in the process depending on the category, represented with swimlanes. Using this flowchart, every employee can easily find out what he can expect in terms of salary. Generally a cross-functional diagram enables one to take a look at processes with a wider scope and with more precision than simple flowchart. Business process capturing using cross-functional flowcharts can be useful for stakeholders and managers to define clearly the staff's roles and responsibilities.Cross-Functional Flowchart (Swim Lanes) *
Picture: Cross-Functional Flowchart (Swim Lanes)
Related Solution:
A competent delegation of responsibilities between workers guarantees business success in most cases. At first sight, it might seem that workflow diagram symbols are quite similar to a regular flowchart. But workflow diagram is a more accurate way to present working processes. Workflow diagrams are helpful for a working process analyzation, to depict a pathway of process issues, personalize responsibilities and identify resources that will help to optimize a workflow. Generally, Workflow diagram deploys flowchart symbols for displaying work process steps and relationships. But, often it require some additions and improvements to become more professional and illustrative. The Workflow solution for ConceptDraw DIAGRAM provides the user with a big library of symbols that are designed especially for workflow diagrams.Workflow Diagram Symbols *
Picture: Workflow Diagram Symbols
Related Solution:
Many of us want to be able to create designs efficiently yet quickly. ConceptDraw DIAGRAM will help you to make awesome drawings without having to design all those Time Elements. These elements include graphs, symbols, cliparts, visual data representation and a whole lot of other stuff.Time - Design Elements *
Picture: Time - Design Elements
Related Solution:
Of course it is possible to keep network records in text documents, but it is very difficult to use them later. A more sound way to keep such documentation is to create a network diagram that might represent either logical network structure or physical. These diagrams are easy to understand and you will thank yourself later. There is a physical network diagram. It is a tool to represent, maintain and analysis of network equipment and interconnections. Network diagram depicts the actual network information in the attractive clear graphic form. One can learn here the LAN cable length, telecommunication type and carrying capacity. The diagram depicts servers, IP address and domain name as well. Also it shows location of hubs, switches, modems, routers, and other network equipment. The sets of special symbols and images delivered with ConceptDraw Network Diagrams solution are used to show network components. Symbols have a standard view. Therefore, various specialists can read the network diagram without any discrepancies.Network diagrams with ConceptDraw DIAGRAM  *
Picture: Network diagrams with ConceptDraw DIAGRAM
Related Solution:
There are many tools to manage a process or to illustrate an algorithm or a workflow. Flowcharting is one of those tools. However, it may be difficult to show complex processes that require multiple attributes or several people in a simple flowchart, so a cross-functional flowchart would be a solution for that situation. To create such flowchart, group processes and steps to labeled rows or columns, and divide those groups with horizontal or vertical parallel lines. It is worth mentioning that there are different types of cross-functional flowcharts, like opportunity or deployment flowchart. This diagram shows a cross-functional flowchart that was made for a trading process. It contains 14 processes, distributed through 5 lines depicting the participants who interact with the process. Also there are connectors that show the data flow of information between processes. The cross-functional flowchart displays a detailed model of the trading process, as well as all participants in the process and how they interact with each other. The lines in the flowchart indicates the position, department and role of the trading process participants.Cross-Functional Flowchart
Picture: Cross-Functional Flowchart
Related Solution:
ConceptDraw DIAGRAM software enhanced with Organizational charts solution is an essential tool to ✔️ show the internal structure of an organization, ✔️ outline the hierarchy, ✔️ display key roles or job titles, ✔️ show relationships among employees or departments, ✔️ facilitate communication and cooperation, ✔️ visualize reporting relationshipsOrganization Chart Software
Picture: Organization Chart Software: A Comprehensive Guide
Related Solution:
ConceptDraw
PROJECT 15