EPC (Event-driven Process Chain) Flowcharts
Event-driven Process Chain
The Event-driven Process Chain (EPC) allows managers visually present business process models for making decisions for business processes improvement. The EPC is able to cope with extremely diverse and complex businesses processes.
ConceptDraw DIAGRAM is a software for making EPC diagrams that provide company performance.
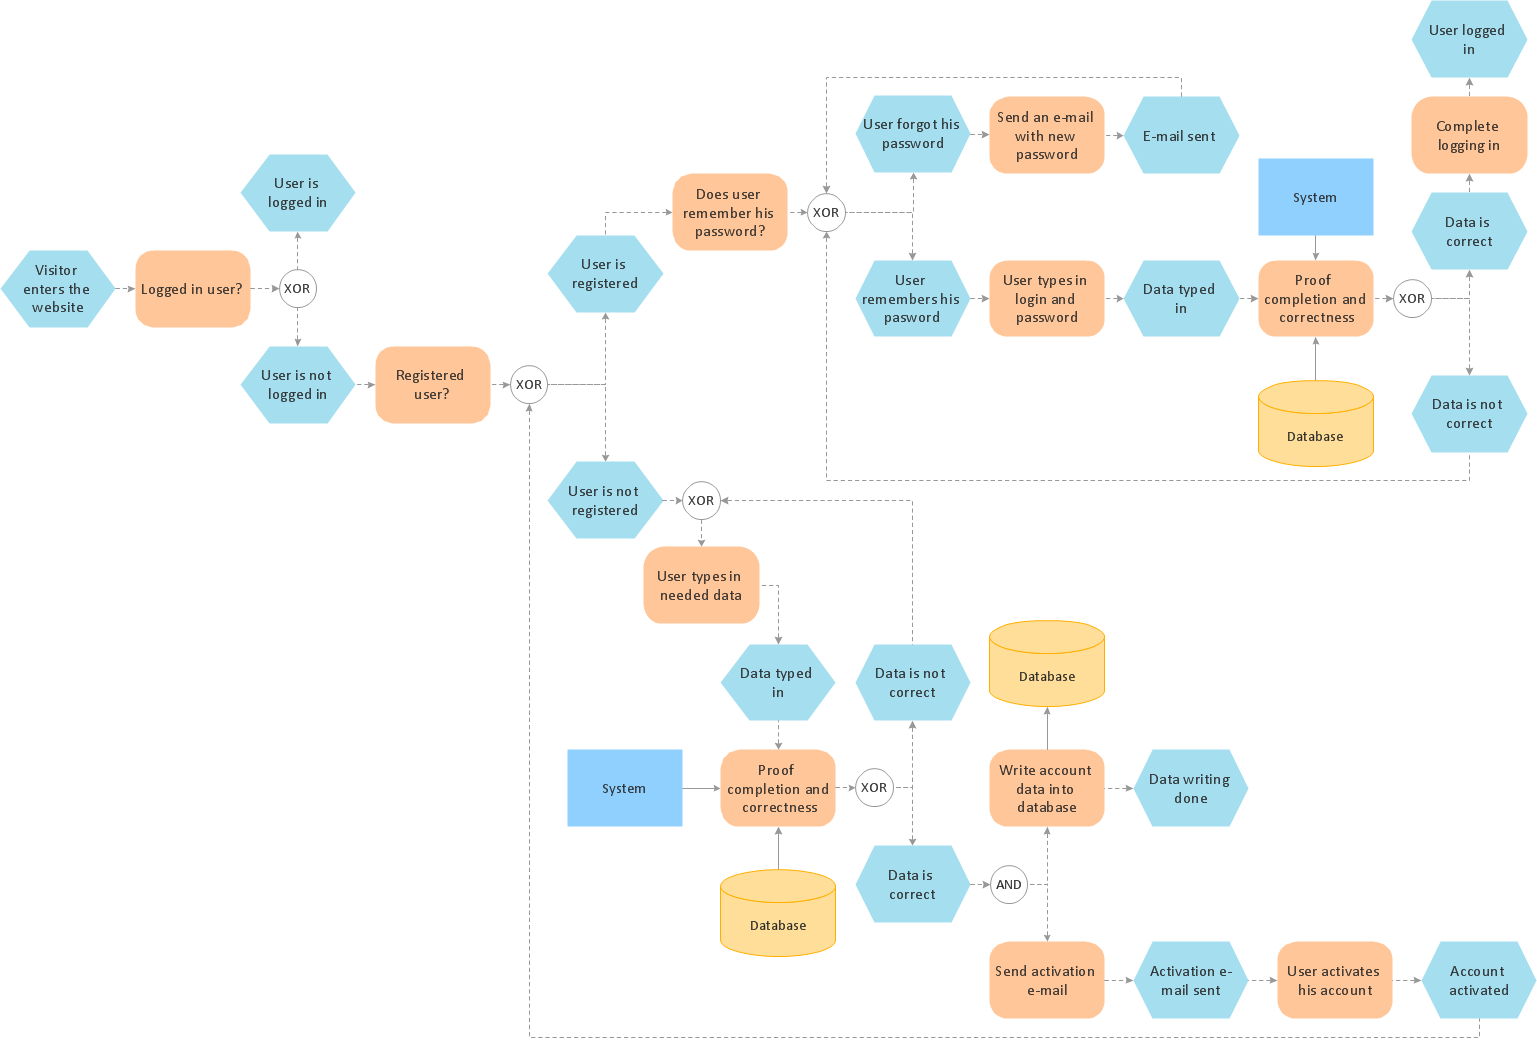
Pic.1 Login and registration processing - EPC diagram sample.
The Event-driven Process Chain Diagrams solution extends ConceptDraw DIAGRAM software with EPC templates, samples, and vector shape library for the drawing of EPC diagrams.
The Event-driven Chain Diagrams solution assists in the planning of resources and improves business processes using EPC flowcharts.
TEN RELATED HOW TO's:
Draw your own business process flowcharts using ConceptDraw DIAGRAM diagramming and business graphics software.
The Flowcharts Solution for ConceptDraw DIAGRAM is a comprehensive set of examples and samples in several different color themes for professionals that need to graphically represent a process.
Picture: Flow Chart Diagram Examples
Related Solution:
ConceptDraw DIAGRAM is a software for producing flow charts. The software delivers built-in object libraries with vector stencils that allows you to use RapidDraw technology. By clicking on direction arrows one can add a new object to flowchart. Users can start drawing their own flowchart diagrams in fast and simple way.
Picture: Diagram Flow Chart
Related Solution:
Tips on how to make an accounting flowchart. Describing methods and symbols that are used to represent the accounting system.
Picture: How to Make an Accounting Process Flowchart
Related Solution:
My friend works as a marketologist. Once he asked me about Marketing and Sales Organization chart, as it was new for him. Luckily, ConceptDraw Solution Park has tons of examples to show to an unexperienced user.
This organizational chart was designed with ConceptDraw DIAGRAM and its Organizational Charts solution, that can be find in the Management section of Solution Park. This solution offers a vector objects library and a set of samples and templates. The vector library contains symbols and icons that provide you with possibility to show the organizational structure of your organization at a glance. It allows to depict the interrelations of authority and responsibility between positions in an organization. Organizational charts provide both employers and employees a clear view of the sale and marketing departments structure, reporting system, management levels.
Picture: Marketing and Sales Organization chart.Organization chart Example
Related Solution:
Use ConceptDraw DIAGRAM software with Flowcharts Solution to create Process Flow Charts, Flow Chart Process Maps, and High-Level Process Flow Charts to illustrate ✔️ high-level processes in industrial, chemical, and process engineering, ✔️ major plant processes, ✔️ minor details
Picture: Process Flow Chart
Related Solution:
ConceptDraw DIAGRAM diagramming and vector drawing software extended with tools of Flowcharts Solution from the Diagrams Area of ConceptDraw Solution Park ideally suits for fast and easy Online Flow Chart designing. We propose to verify this right now.
Picture: Online Flow Chart
Related Solution:
When you need a drawing software to create a professional looking cross-functional charts, ConceptDraw with its Arrows10 Technology - is more than enough versatility to draw any type of diagram with any degree of complexity.
Use templates with process maps, diagrams, charts to get the drawing in minutes.
Picture: Cross-Functional Process Map Template
ConceptDraw software has been developed for drawing any type of flowchart. Use RapidDraw - thi is flowchart maker technology for adding new objects to a flowchart quickly. This is technology of fast drawing technique focused on making great-looking flowcharts quickly. To get started using it download flowchart maker ConceptDraw DIAGRAM.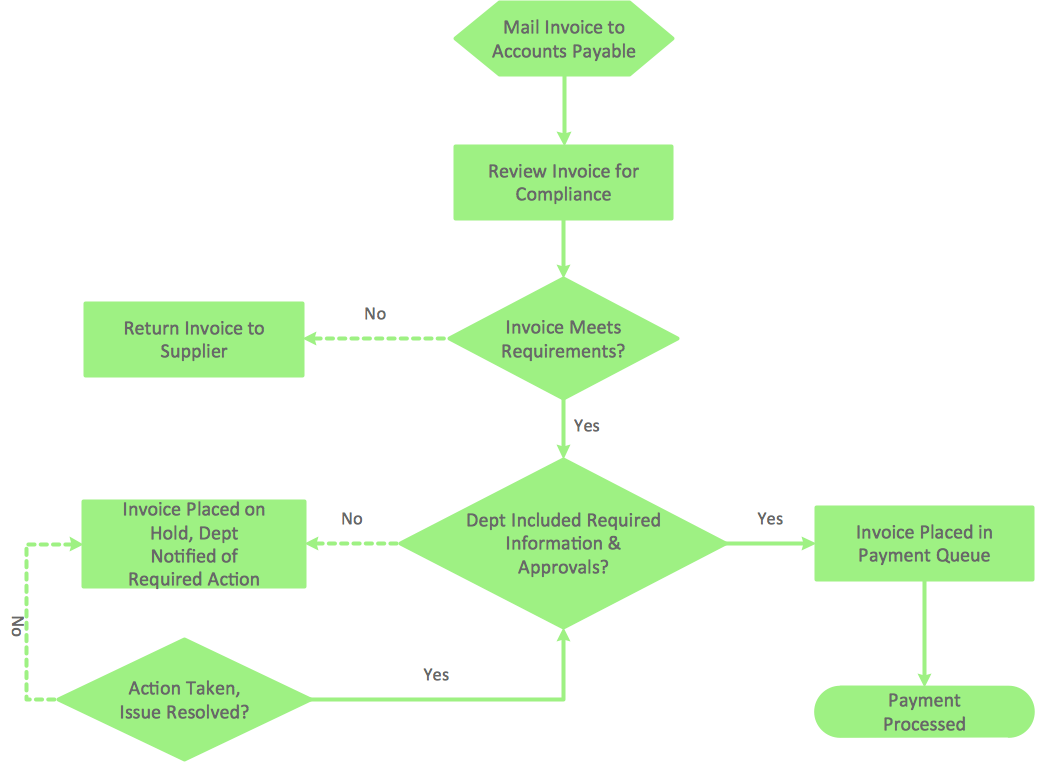
Picture: Flowchart Program Mac
Related Solution:
ConceptDraw helps you to start designing your own UML Collaboration Diagrams with examples and templates.
Picture: Diagramming Software for Design UML Collaboration Diagrams
Users can start draw their own flowchart diagrams from existing examples.
Picture: Examples of Flowchart Diagram
Related Solution:
ConceptDraw
DIAGRAM 18