Account Flowchart
Flowchart Examples
ConceptDraw defines some flowchart types, divided into ten categories
Every flowchart type has specific shapes and examples
Create your own flow charts of computer or network system account processing using the ConceptDraw DIAGRAM diagramming and vector drawing software extended with the Cross-Functional Flowcharts solution.
"A user is a person who uses a computer or network service. A user often has a user account and is identified by a username (also user name). A user's account allows a user to authenticate to system services and be granted authorization to access them; however, authentication does not imply authorization. To log into an account, a user is typically required to authenticate oneself with a password or other credentials for the purposes of accounting, security, logging, and resource management.
Once the user has logged on, the operating system will often use an identifier such as an integer to refer to them, rather than their username, through a process known as identity correlation. In Unix systems, the username is correlated with a user identifier or user id.
Computer systems are divided into two groups based on what kind of users they have:
- Single-user systems do not have a concept of several user accounts.
- Multi-user systems have such a concept, and require users to identify themselves before using the system.
Each user account on a multi-user system typically has a home directory, in which to store files pertaining exclusively to that user's activities, which is protected from access by other users (though a system administrator may have access). User accounts often contain a public user profile, which contains basic information provided by the account's owner." [User (computing). Wikipedia]

Example 1. Account Flowchart
This sample was created in ConceptDraw DIAGRAM using the Cross-Functional Flowcharts solution from the Business Processes area of ConceptDraw Solution Park. It shows the Cross-Functional Flowchart of account creation on Wikipedia using the Account Creation Interface application software. You can see the process of the handling the user requests.
Using the ready-to-use predesigned objects, samples and templates from the Cross-Functional Flowcharts Solution for ConceptDraw DIAGRAM you can create your own professional Flowchart Diagrams quick and easy.
The Flowcharts produced with ConceptDraw DIAGRAM are vector graphic documents and are available for reviewing, modifying, and converting to a variety of formats (image, HTML, PDF file, MS PowerPoint Presentation, Adobe Flash or MS Visio).
TEN RELATED HOW TO's:
Functional modeling allows to make complex business processes simple. One of the basic methods is IDEF0 and one of the most effective also. To create a business model, use flowchart symbols.
The IDEF0 library, supplied with ConceptDraw IDEF0 Diagrams solution contains 18 IDEF0 basic notation symbols. All symbols are the vector graphic images what means, that one can customize their size preserving the stable quality. Another library of IDEF0 symbols can be find out in the the Business Process Diagrams solution, included to the Business Processes section of ConceptDraw Solution Park. These libraries composed from just vector objects and are totally compatible. You can apply the IDEF0 symbols from both libraries at your flowcharts, if needed.
Picture: IDEF0 Flowchart Symbols
Related Solution:
Flowcharts are helpful in understanding a complicated process. ConceptDraw DIAGRAM allows you to creating a simple flowchart. The ability to create flowcharts is contained in the Flowcharts solution. The solution provides a set of special tools for creating flowcharts.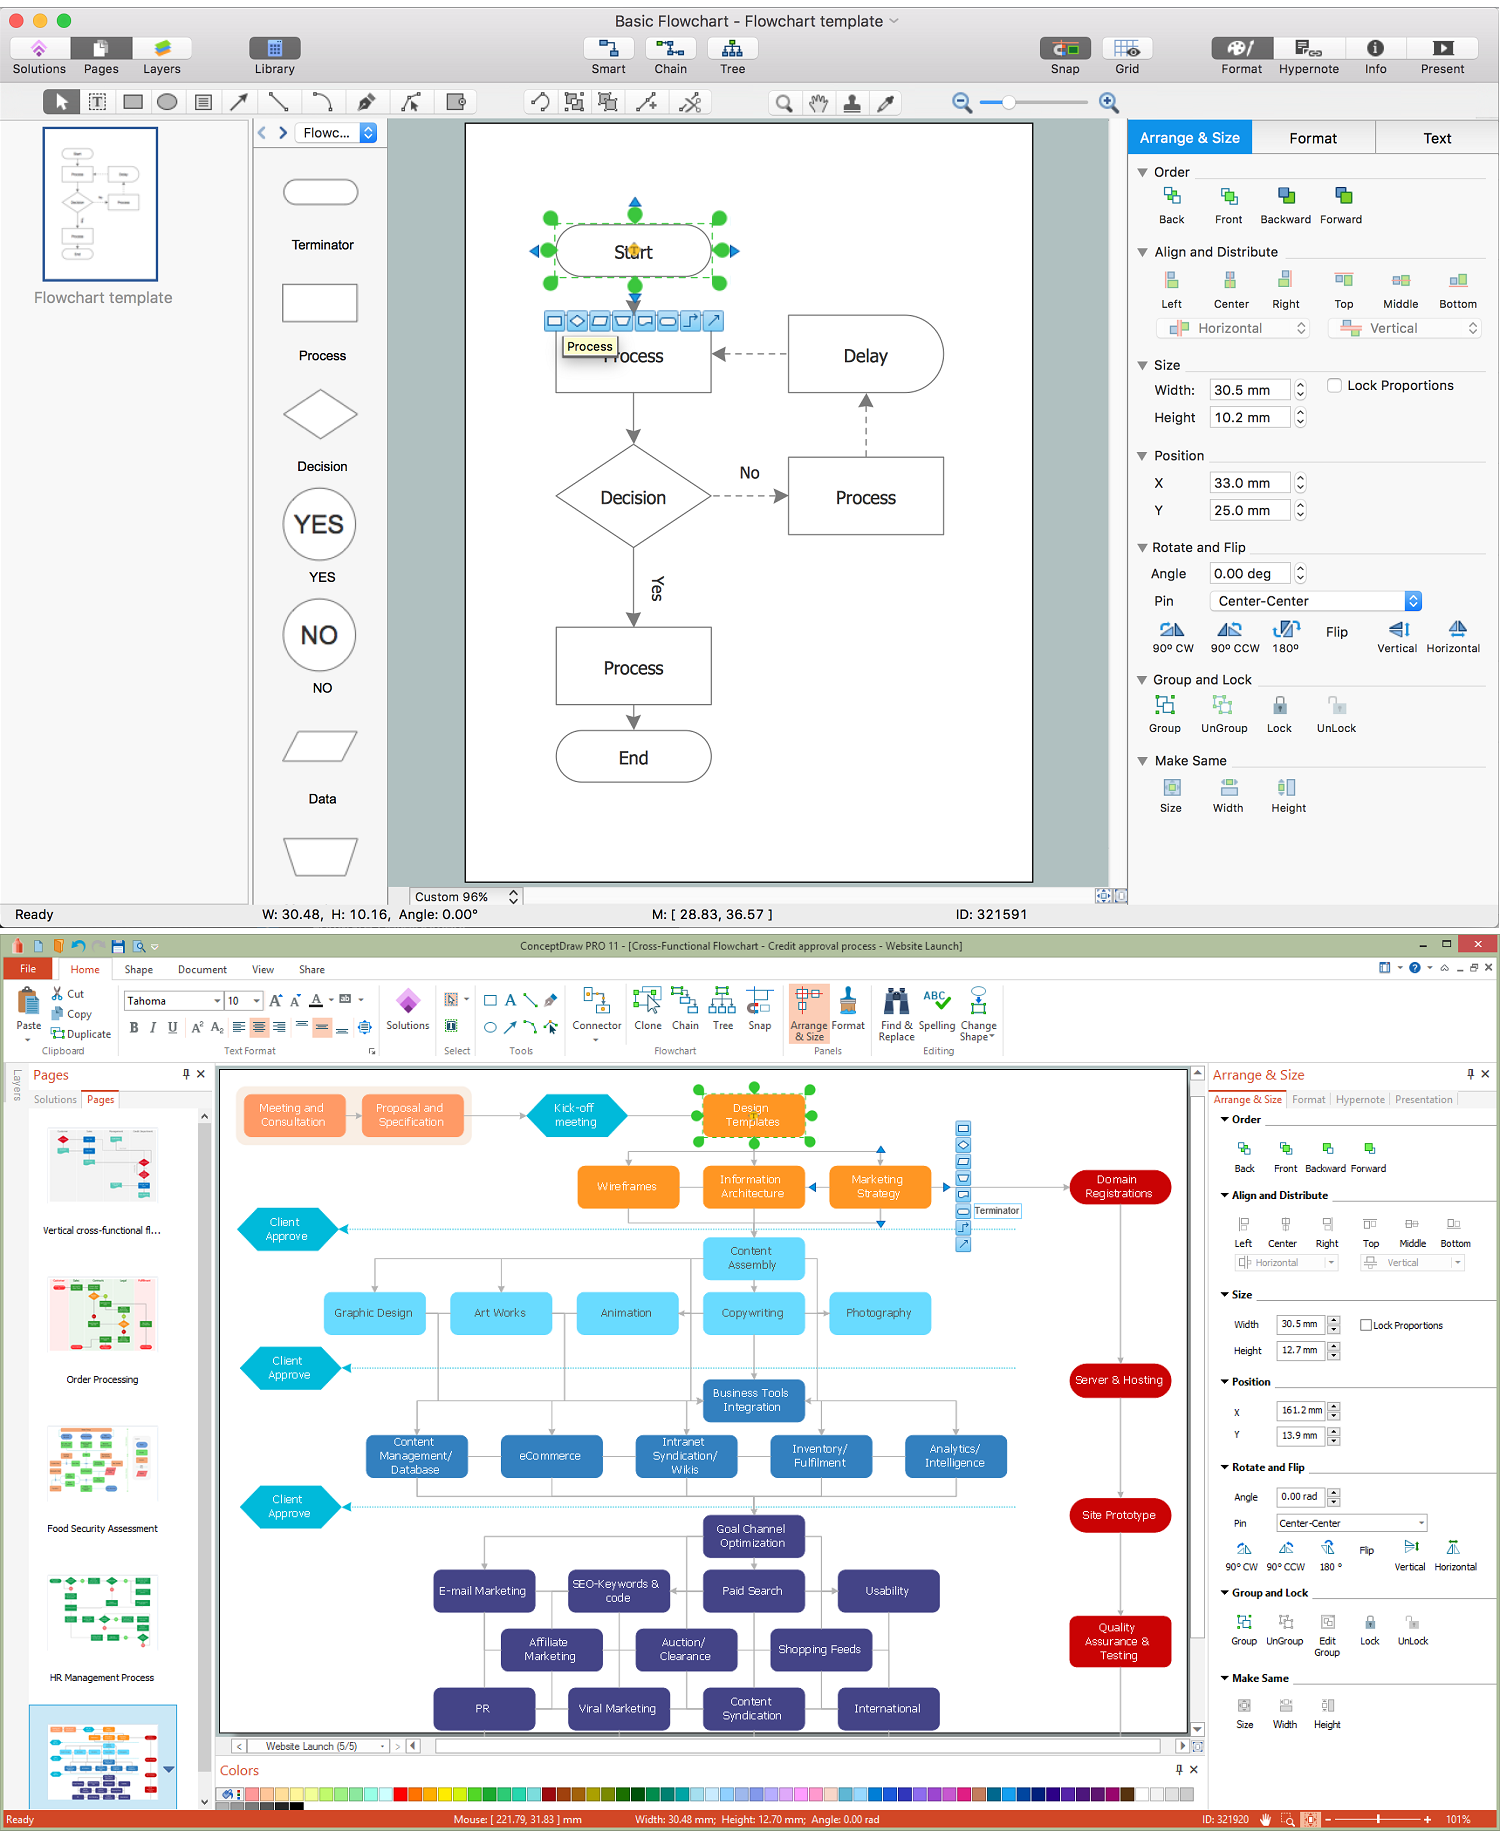
Picture: Creating a Simple Flowchart
Related Solution:
ConceptDraw DIAGRAM is a professional software for building of great-looking Flowcharts ✔️ of various types and any degree of complexity, ✔️ in a few simple steps, ✔️ even if you have no experience, ✔️ using RapidDraw technology, ✔️ to perform different tasks in different fields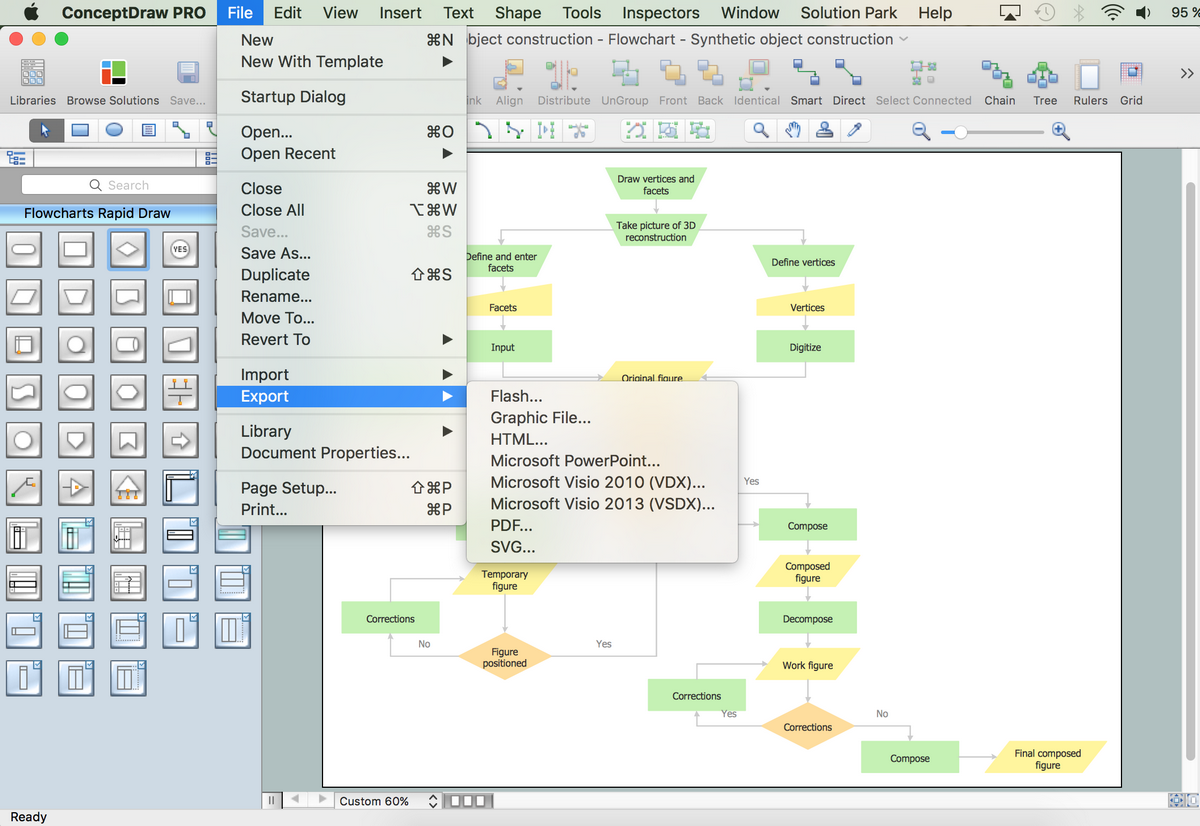
Picture: How to Build a Flowchart
Related Solution:
It is convenient to use a powerful ConceptDraw DIAGRAM software extended with Flowcharts Solution to design flowcharts of various types which will additionally illustrate a definition flowchart.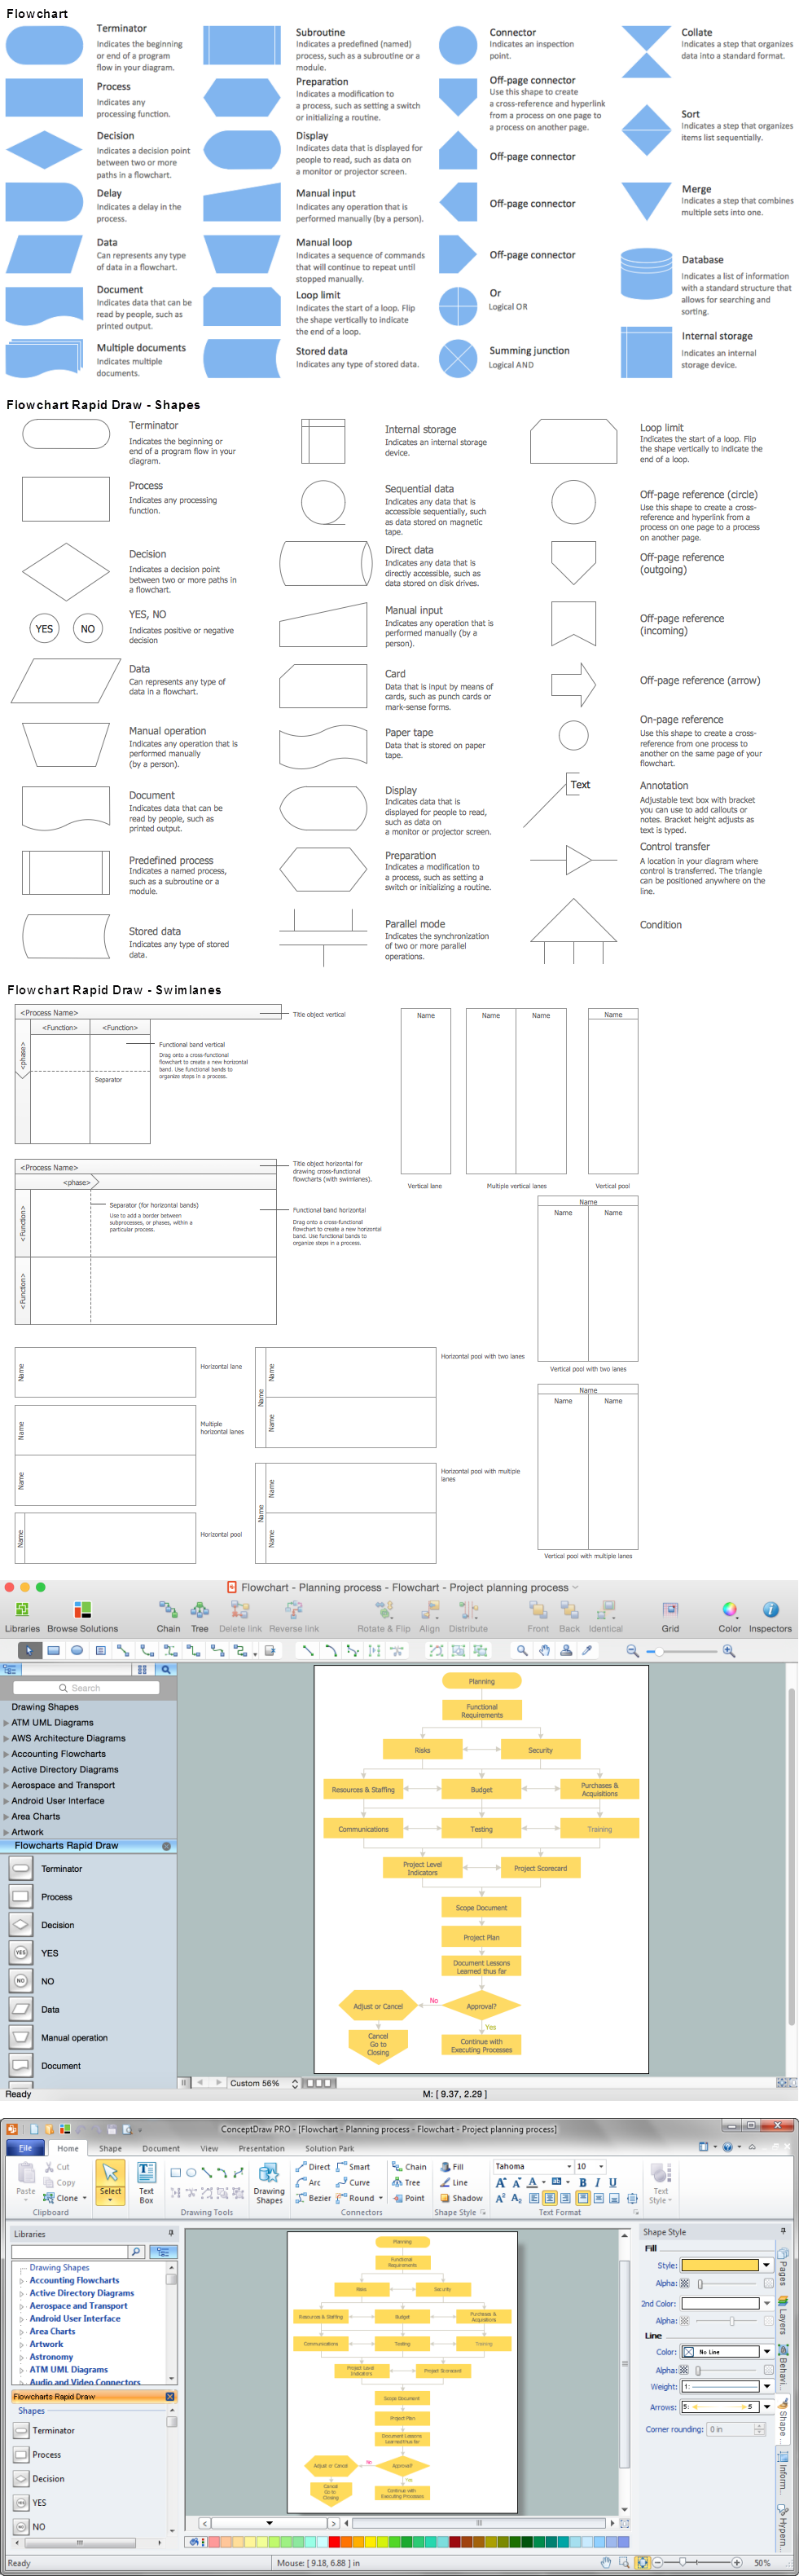
Picture: Definition Flowchart
Related Solution:
Use Case Diagrams technology. IDEF4 standard implies not only graphical presentation but the additional information about diagrams of heredity, methods systematization and types which are contained in specifications.
Picture: IDEF4 Standard
When studying a business process or system involving the transfer of data, it is common to use a Data Flow Diagram (DFD) to visualize how data are processed. Being initially used exclusively in regards to the flow of data through a computer system, now DFDs are employed as the business modeling tools. They are applied to describe the business events and interactions, or physical systems involving data storage and transfer. ConceptDraw DIAGRAM is a powerful Data Flow Diagram software thanks to the Data Flow Diagrams solution from the Software Development area of ConceptDraw Solution Park.
Picture: Data Flow Diagram Software
Related Solution:
UML Use Case Diagram Taxi Service - This sample was created in ConceptDraw DIAGRAM diagramming and vector drawing software using the UML Use Case Diagram library of the Rapid UML Solution from the Software Development area of ConceptDraw Solution Park.
This sample shows the work of the taxi service and is used by taxi stations, by airports, in the tourism field and delivery service.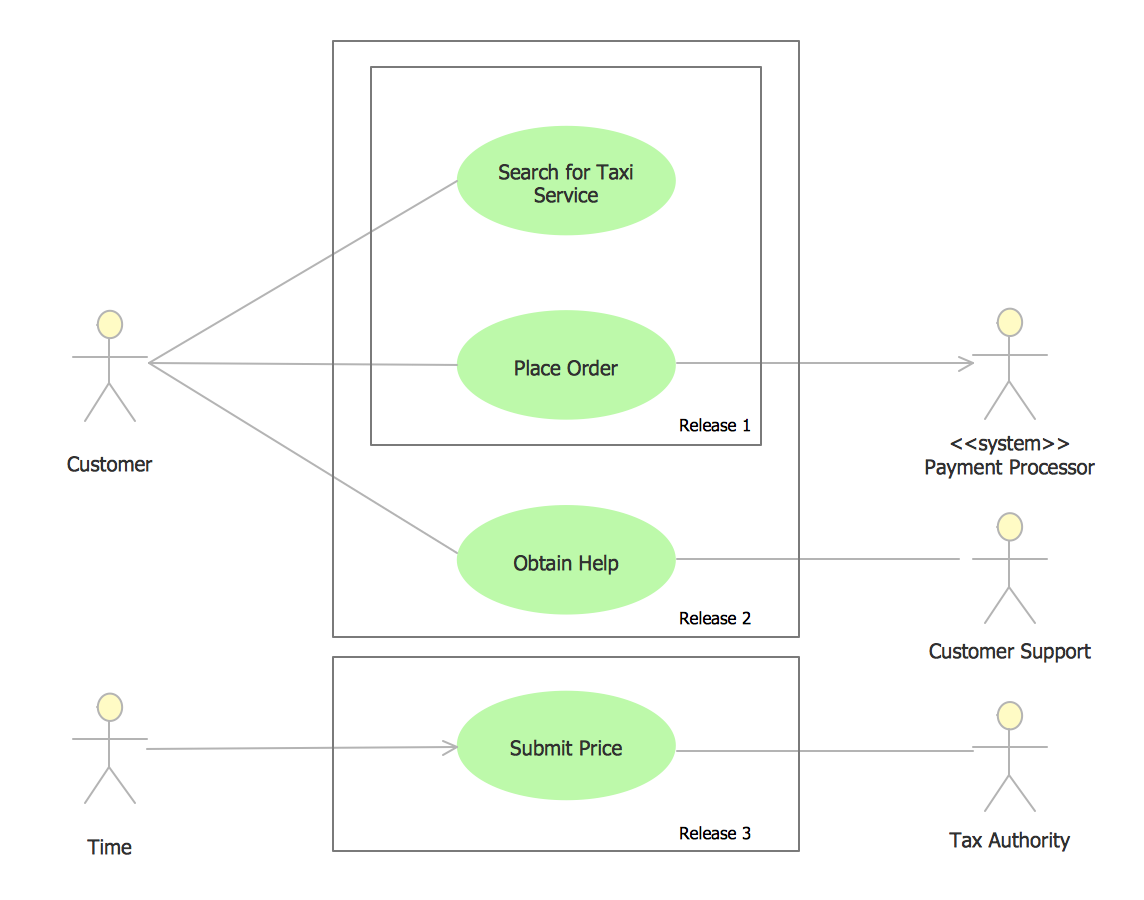
Picture: UML Use Case Diagram Example - Taxi Service
Related Solution:
ConceptDraw is rapid and powerful network diagram drawing software with rich examples, templates, design objects and stencils.
Picture: Draw Network Diagram based on Templates and Examples
UML Collaboration Diagram depicts the interactions between objects or parts in terms of sequenced messages and describes both the static structure and dynamic behavior of a system.
Rapid UML solution provides templates, examples and libraries of stencils for quick and easy drawing all the types of system and software engineering diagrams according to UML 2.4 and 1.2 notations.
Picture: UML Collaboration Diagram (UML2.0)
Related Solution:
ConceptDraw DIAGRAM is the world’s premier cross-platform business-diagramming tool. Many, who are looking for an alternative to Visio, are pleasantly surprised with how well they can integrate ConceptDraw DIAGRAM into their existing processes. With tens of thousands of template objects, and an easy method for importing vital custom objects from existing Visio documents, ConceptDraw DIAGRAM is a powerful tool for making extremely detailed diagrams, quickly and easily.
Picture: ConceptDraw DIAGRAM : Able to Leap Tall Buildings in a Single Bound
Related Solution: