Ordering Process Flowchart. Flowchart Examples
A flowchart is a widely used type of diagram that visually represents an algorithm, workflow, or process, using the boxes of various kinds to depict the steps and connecting them with arrows to show the order of execution of these steps.
The ConceptDraw DIAGRAM supplied with Accounting Flowcharts Solution from the Finance and Accounting Area of ConceptDraw Solution Park is a powerful diagramming and vector drawing software which ideally suits for designing Ordering Process Flowchart of any complexity.
The accounting flowchart, voucher payable flowchart, and Ordering Process flowchart examples were created using Accounting Flowcharts library design elements.
Accounting Flowchart

Example 1. Accounting Flowchart Example
Accounting Flowcharts Solution provides for ConceptDraw users a lot of powerful drawing tools and Accounting Flowcharts library with numerous collection of predesigned vector objects, large quantity of useful Accounting Flowchart, Process Flowchart and Ordering Process Flowchart samples and examples, and also accounting flowchart template.
Accounting Flowcharts Design Elements

Example 2. Accounting Flowcharts Library Design Elements
All this diversity of library objects, flowchart examples and samples is available for viewing and editing from ConceptDraw STORE. Each sample can be used as the perfect base for your own flowchart, you can start with ready sample and simply make desired changes.
Flowchart for Voucher Payable

Example 3. Flowchart for Voucher Payable
Bravely use Align, Fill, Text, and more other useful ConceptDraw tools designing your Ordering Process Flowchart. They will help you fast and easy represent information, create bright and attractive diagrams which can be then effectively used in various publications, and will have great success at conferences, meetings, and discussions with your colleagues.
Ordering Process Flowchart
Example 4. Ordering Process Flowchart.
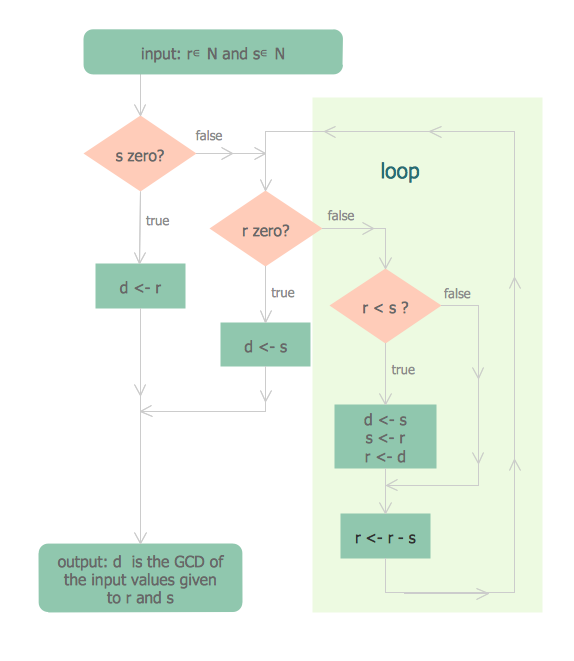
Academ Flowchart to get simply the GCD of two positive integers
This example was redesigned from the Wikimedia Commons file [commons.wikimedia.org]
This Ordering Process Flowchart was created in ConceptDraw DIAGRAM software using the Accounting Flowcharts Solution and demonstrates the algorithm of finding the GCD of two positive integers r and s. An experienced user spent 10 minutes creating this sample.
Use the Accounting Flowcharts Solution for ConceptDraw Solution Park to create your own professionally designed Ordering Process Flowchart of any complexity fast and easy.
All source documents are vector graphic documents. They are available for reviewing, modifying, or converting to a variety of formats (PDF file, MS PowerPoint, MS Visio, and many other graphic formats) from the ConceptDraw STORE. The Accounting Flowcharts Solution is available for all ConceptDraw DIAGRAM users.
TEN RELATED HOW TO's:
In ConceptDraw DIAGRAM it really is sp simple to draw even the most complex cross-functional flowcharts. Use the RapidDraw technology and Cross-Functional libraries in ConceptDraw DIAGRAM for the best results.
Picture: How to Simplify Flow Charting — Cross-functional Flowchart
Related Solution:
Visual information is easier to perceive. You can teach even a child to make diagrams with a good flowchart example that would be interesting for it. Flowcharts can be fun, it’s not about business processes or programming algorithms.
This flowchart shows step by step process of manufacturing of Nixtamal The product which is obtained by processing maize with calcium hydroxide. We must assume that the Aztecs were very fond of this product, if the recipe of its production came to our times. This flow chart was designed using ConceptDraw DIAGRAM with its solution for designing flowcharts of various types, sizes and purposes. ConceptDraw Flowcharts solution consists from the library of flowchart symbols, containing the set vector objects. Also there are a lot of diverse templates and samples of flow charts.
Picture: Flowchart Examples and Templates
Related Solution:
ConceptDraw DIAGRAM diagramming and vector drawing software extended with Target and Circular Diagrams solution from the Marketing area of ConceptDraw Solution Park is a powerful tool for Daily Schedule Chart design.
Picture: Daily Schedule Chart
Related Solution:
The Accounting flowchart shows how information flows from source documents through the accounting records. The are based on the accounting procedures or processes.
Picture: What process should be essentially adopted.Accounting Flowchart Example
Related Solution:
Use ConceptDraw DIAGRAM with Accounting Flowcharts solution to document and communicate visually how accounting processes work, and how each operation is done.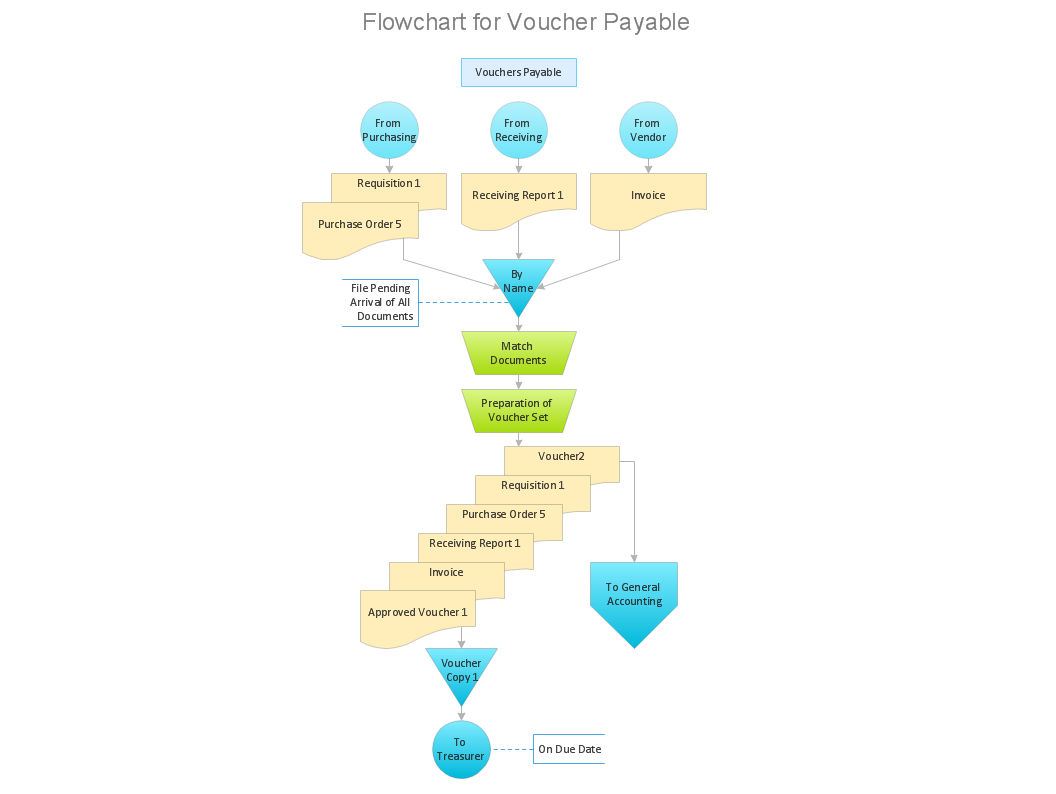
Picture: Accounting Flowchart: Purchasing, Receiving, Payable and Payment
Related Solution:
When thinking about data visualization, one of the first tools that comes to mind is a flowchart design. You can find flowchart symbols, shapes, stencils and icons easily on the Internet, but it might take time to systematize this information. Nevertheless, once you start flowcharting, you’ll love its simplicity and efficiency.
This diagram consists from standard flowchart symbols, approved by ANSI (American National Standard Institute) for drawing flowcharts. A flowchart is a diagram that represents a step-by-step algorithm of any process, displaying the process stages as boxes that are connected with arrows. Flowchart design makes it clear and readable.
Flowchart designed using ConceptDraw DIAGRAM flowchart software allows to make attractive and clear process presentation, it makes interpretation of the business process flow fresh and versatile. Great flowchart design view is a big advantage over the diagram created manually on a paper.
Picture: Flowchart Design: Principles, Layout, Symbols and Best Practices
Related Solution:
ConceptDraw DIAGRAM diagramming and vector drawing software extended with Flowcharts Solution from the 'Diagrams' area of ConceptDraw Solution Park is a powerful tool for drawing Flow Charts of any complexity you need. Irrespective of whether you want to draw a Simple Flow Chart or large complex Flow Diagram, you estimate to do it without efforts thanks to the extensive drawing tools of Flowcharts solution, there are professional flowchart symbols and basic flowchart symbols. This sample shows the Gravitational Search Algorithm (GSA) that is the optimization algorithm.
Picture: Simple Flow Chart
Related Solution:
Account Flowchart Stockbridge System
Flowchart Examples →
Once you decide to create a flowchart mentioning all the processes , you can always use well as professionally software — ConceptDraw
Picture:
Account Flowchart Stockbridge System
Flowchart Examples
Related Solution:
While creating flowcharts and process flow diagrams, you should use special objects to define different statements, so anyone aware of flowcharts can get your scheme right. There is a short and an extended list of basic flowchart symbols and their meaning. Basic flowchart symbols include terminator objects, rectangles for describing steps of a process, diamonds representing appearing conditions and questions and parallelograms to show incoming data.
This diagram gives a general review of the standard symbols that are used when creating flowcharts and process flow diagrams. The practice of using a set of standard flowchart symbols was admitted in order to make flowcharts and other process flow diagrams created by any person properly understandable by other people. The flowchart symbols depict different kinds of actions and phases in a process. The sequence of the actions, and the relationships between them are shown by special lines and arrows. There are a large number of flowchart symbols. Which of them can be used in the particular diagram depends on its type. For instance, some symbols used in data flow diagrams usually are not used in the process flowcharts. Business process system use exactly these flowchart symbols.
Picture: Flowchart Symbols: Meaning and Examples
Related Solution:
Android is an operating system based on the Linux kernel and developed by Google for smartphones, tablet computers, electronic books, netbooks, smartbooks, digital players, watches, game consoles, TV and other devices.
ConceptDraw DIAGRAM extended with Android User Interface Solution from the Software Development Area is a powerful software with extensive drawing tools which can help you to build the intelligible, attractive and easy for perception Android GUI for your application.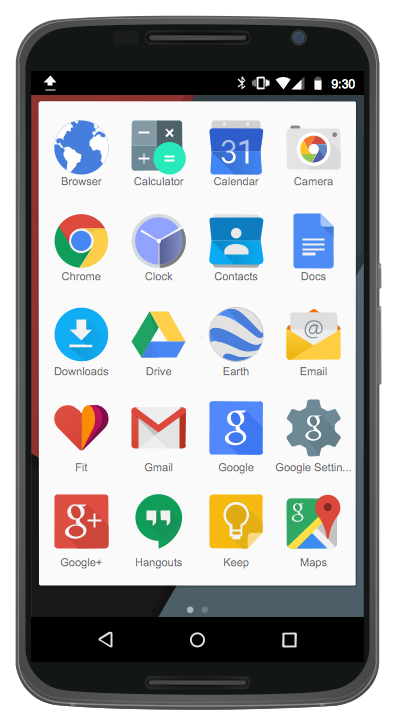
Picture: Android GUI
Related Solution:


