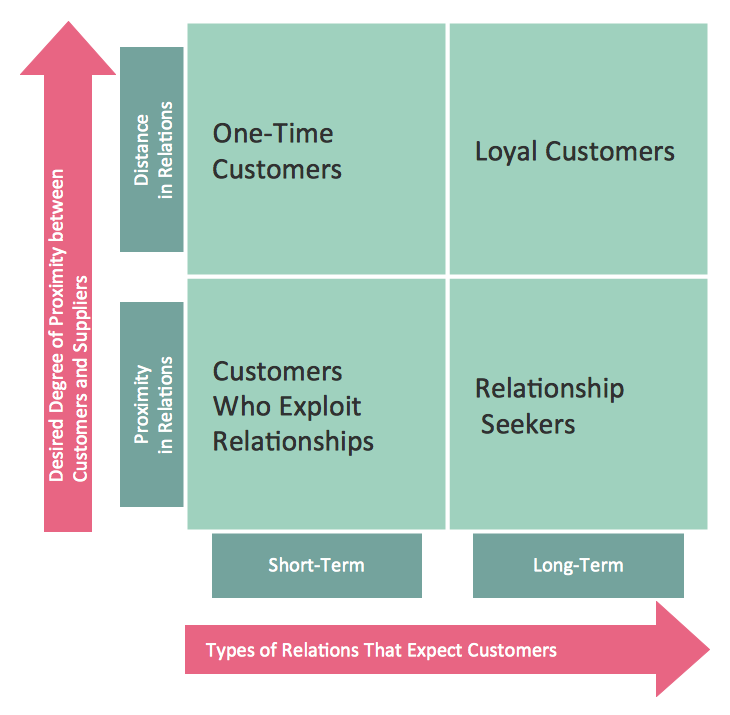
Example 1. Matrices - Customer Types Matrix
Matrices Solution provides the full set of useful tools - Matrices library with large number of ready-to-use vector objects, and collection of predesigned samples and templates.
All these templates are available from ConceptDraw STORE. Various types of matrices can be easily designed on their base.

Example 2. Matrices - Flow Process Chart
The following features make ConceptDraw DIAGRAM the best Matrices Design Software:
- You don't need to be an artist to draw professional looking matrices in a few minutes.
- Large quantity of ready-to-use vector objects makes your drawing matrices quick and easy.
- Great number of predesigned templates and samples give you the good start for your own matrices.
- ConceptDraw DIAGRAM provides you the possibility to use the grid, rules and guides. You can easily rotate, group, align, arrange the objects, use different fonts and colors to make your diagram exceptionally looking.
- All ConceptDraw DIAGRAM documents are vector graphic files and are available for reviewing, modifying, and converting to a variety of formats: image, HTML, PDF file, MS PowerPoint Presentation, Adobe Flash, MS Visio.
- Using ConceptDraw STORE you can navigate through ConceptDraw Solution Park, managing downloads and updates. You can access libraries, templates and samples directly from the ConceptDraw STORE.
- If you have any questions, our free of charge support is always ready to come to your aid.
NINE RELATED HOW TO's:
This sample was created in ConceptDraw DIAGRAM diagramming and vector drawing software using the Bubble Diagrams Solution from the ConceptDraw Solution Park.
This sample shows the BCG (Boston Consulting Group) matrix that is used in marketing and product management for strategic analysis and planning.
Picture: Bubble Plot
Related Solution:
ConceptDraw DIAGRAM extended with Matrices solution from the Marketing area of ConceptDraw Solution Park is the best Deployment Chart Software.
The Matrices solution offers you the useful tools for creating Deployment Charts in just minutes.
The Deployment Charts designed with ConceptDraw DIAGRAM are vector graphic documents and are available for reviewing, modifying, converting to a variety of formats (image, HTML, PDF file, MS PowerPoint Presentation, Adobe Flash or MS Visio XML), printing and send via e-mail in one moment.
Picture: Deployment Chart Software
Related Solution:
SWOT Analysis solution extends ConceptDraw MINDMAP and ConceptDraw DIAGRAM products with easy-to-use SWOT Analysis tools.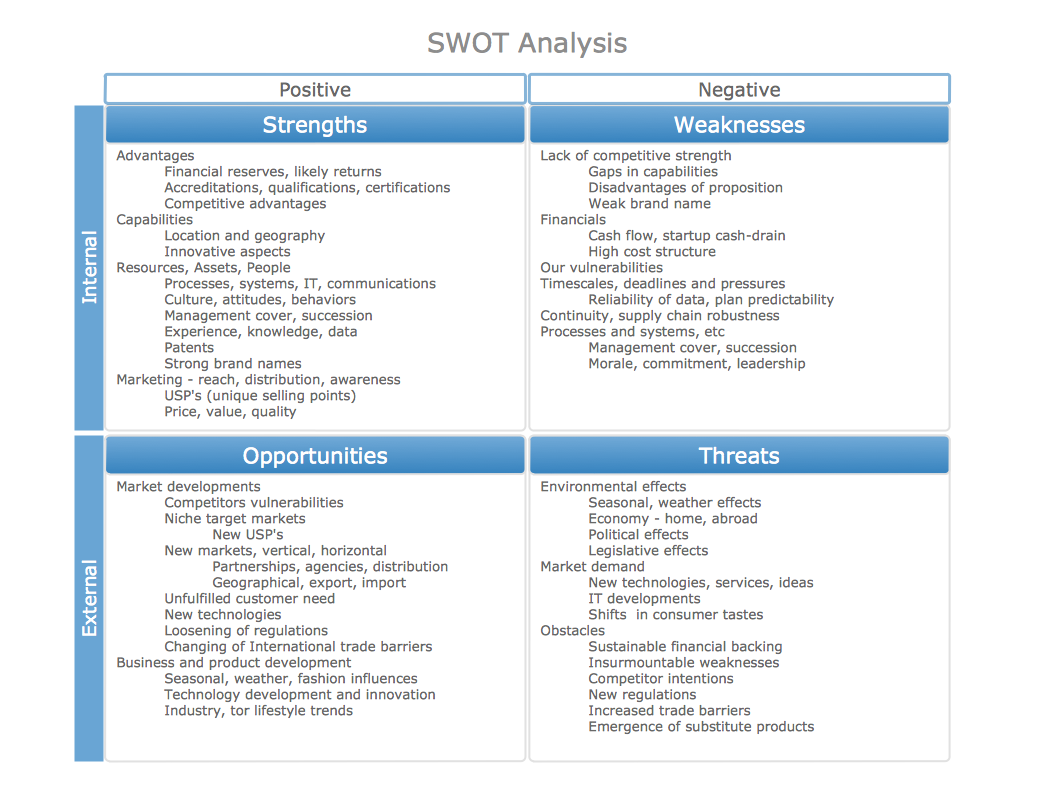
Picture: SWOT Analysis matrix templates and samples
This sample shows the Polar Graph. The Polar Graph is a graph in the polar coordinate system in which the each point on the plane is defined by two values - the polar angle and the polar radius. The certain equations have very complex graphs in the Cartesian coordinates, but the application of the polar coordinate system allows usually produce the simple Polar Graphs for these equations.
Picture: Polar Graph
If you have your own business, you shouldn’t be afraid to use different management techniques. It also should be mentioned that SWOT analysis tool for small business is just as useful as for an transatlantic corporation. If you want to see whether you company is able to compete on the market, SWOT analysis is a great solution.
The following drawing illustrates the simple template, created for providing SWOT analysis. You can use it for your management courses as a tutorial for SWOT analysis. The tips, added to each section of a matrix are intended to help you to fill them with the information of the strengths and weaknesses of your training case, and do not forget, at the same time, about opportunities and threats. This template is one of a set of templates of SWOT matrices that can be found in the the ConceptDraw SWOT and TOWS diagrams solution. This solution used as part of simple project management software in ConceptDraw Office as advertising agency software or marketing management software.
Picture: SWOT Analysis Tool for Small Business
To support you in your tasks you can use the power of ConceptDraw DIAGRAM providing
intelligent vector graphics that are useful for marketing diagramming and
ConceptDraw MINDMAP for key marketing mind maps.
Picture: Business Productivity - Marketing
Related Solution:
Different organizations have different organizational structures. Matrix organization is one of the most popular and widely used type of organizational structure. Use ConceptDraw DIAGRAM diagramming and vector drawing software extended with 25 Typical Orgcharts solution from the Management area of ConceptDraw Solution Park for fast and easy designing matrix organizational chart for your company.
Picture: Matrix Organization
Related Solution:
Africa has 54 fully recognized sovereign states, 9 territories and two de facto independent states with limited or no recognition.
Vector design elements library Africa contains country map contours, geographical maps, cartograms and thematic maps for ConceptDraw DIAGRAM diagramming and vector drawing software.
All ConceptDraw DIAGRAM documents are vector graphic files and are available for reviewing, modifying, and converting to a variety of formats: image, HTML, PDF file, MS PowerPoint Presentation, Adobe Flash, MS Visio (.VDX,.VSDX).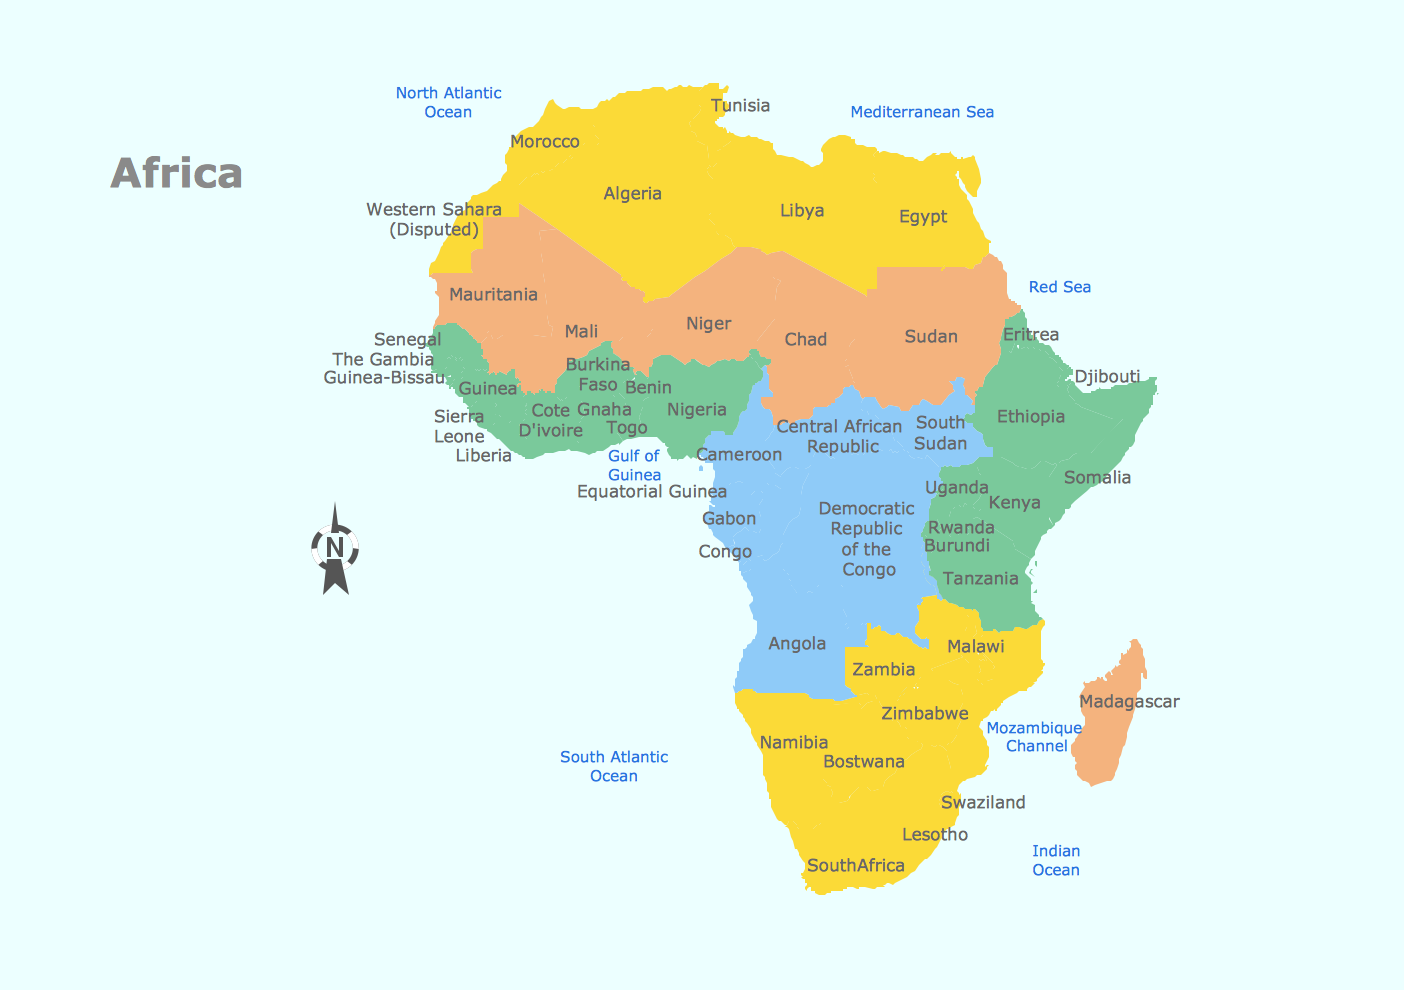
Picture: Geo Map — Africa
Related Solution:
macOS is used increasingly often as a productivity platform by many companies and businesses across the world. SWOT Analysis is an essential business tool for companies to determine their future course of action. As a tool for digital drawing of SWOT Analysis diagrams under macOS, ConceptDraw offers Mac Tools - SWOT Analysis examples and templates are included to allow for effortless creation of SWOT and TOWS Analysis diagrams. With ConceptDraw it is equally easy to create your SWOT Analysis diagram under Microsoft Windows and macOS.
This image demonstrates the diversity of SWOT and TOWS matrix templates delivered with SWOT and TOWS Diagrams add-on for ConceptDraw DIAGRAM diagramming software. Together they compose a professional solution for performing SWOT and TOWS analysis. There are number of templates of different Matrix Diagrams. In addition to the set of embedded templates, this solution allows one to design SWOT and TOWS matrices tailored to certain business characteristics or corporate style. Using matrix template, you can easily discover Strengths, Weaknesses, Opportunities, and Threats, your business faced. This means that the first step to creating a successful business strategy, you have done.
Picture: Mac Tools - SWOT Analysis


